Aeromagnetic survey is one of geophysical methods to study geological structures and distribution of mineral resources by measurements of the geomagnetic field using aircraft. It includes measuring the total field and gradients,which can be divided into measurements of vertical gradients,horizontal gradients and triaxial gradients. The tri-axial aeromagnetic gradient survey uses four sensors to obtain longitudinal horizontal gradients,lateral horizontal gradients,and downward vertical gradients by calculations of differences between magnetometers,and determine change rates of the geomagnetic field in three directions. Developing tri-axial aeromagnetic gradient survey and practical interpretation methods is a further measure to improve the resolution of objects[1]. With the financial support by the National High Technology Research and Development Program of China (863 Program),China Aero Geophysical Survey and Remote Sensing Center for Land and Resources (AGRS) has successfully developed AGS-863 Tri-axial Aeromagnetic Gradiometer with self-owned intellectual property. The test results show that the gradiometer system has excellent synchronism,consistency,long-term stability and compensation precision[2]. Through trial flight,we acquired nearly 25000 km tri-axial aeromagnetic gradient data.
According to the measurement principle of aeromagnetic gradient survey,the measured gradient data are free from diurnal variations and the lateral horizontal gradient (lateral gradient) provides more information between survey lines[3]. Based on this advantage of lateral gradients,Hardwick[4, 5] used the measured lateral gradients from two wingtip-mounted sensors to extrapolate values of the total magnetic field onto "pseudo-lines" at a specified distance on either side of the survey line. These values are then included in the interpolation of the total magnetic field. The method is called "Gradient-Enhanced Gridding". The enhanced total field grid map highlights anomalies over small magnetic sources that lie between survey lines and over linear sources that strike obliquely to the survey lines. O’Connell[6] realized total field data gridding using longitudinal and lateral gradients with the minimum curvature operator[7]. In the absence of the lateral gradient data,the improvement in gridding methods[8, 9, 10, 11, 12, 13] can be more reasonably close to the real distribution trend,but cannot increase magnetic field information between survey lines. Reford[14, 15] pointed out that the gradient-enhanced gridding will introduce level noise in some low-gradient areas and more careful leveling of the lateral gradient channel prior to gridding would minimize the problem. Based on Hardwick method and Akima interpolation[16],we have studied bi-directional line gridding and finally realized gradient-enhanced gridding with consideration of variations in horizontal gradients. We also used the effective filter method to reduce the effects of false anomalies on the gridding data after enhancement.
2 METHOD 2.1 Horizontal Gradient MeasurementsLateral gradient measurements are carried out using two wingtip sensors and the gradients are obtained by differences in the cross-lines divided by the sensor spacing. The lateral gradient is[3]

The instrument sampling rate of aeromagnetic survey is generally ten times or more per second. Survey point spacing is far less than the line spacing. Therefore,the aeromagnetic data is a typical linear measurement data and its grid map could be prepared using the bi-directional line gridding method[17, 18]. Bi-directional line gridding,which applies a spline (linear,Akima or cubic) to make interpolation along one direction then along the direction normal to last direction.
The Hardwick method uses bi-directional line gridding and uses lateral gradients to construct pseudolines[4] on which the total magnetic field value is


The gradient-enhanced gridding by the Hardwick method and Akima interpolation includes three steps:
(1) Total field and lateral gradient gridding,which applies Akima interpolation along the survey lines. Since the impact of wind current,the actual flight path is a polyline. In order to make Akima interpolation applicable to the polyline,we use following equation to obtain xi+1 - xi when calculating Eq.(3) and slopes

(2) The total field values of pseudo-lines are calculated by the Eq.(2). Pseudo-line provides the variation trend of the magnetic field between survey lines. Therefore,D is not necessarily equal to half the sensor spacing,but is greater than zero and less than half line spacing.
(3) Make Akima interpolation in direction normal to the real lines and pseudo-lines.
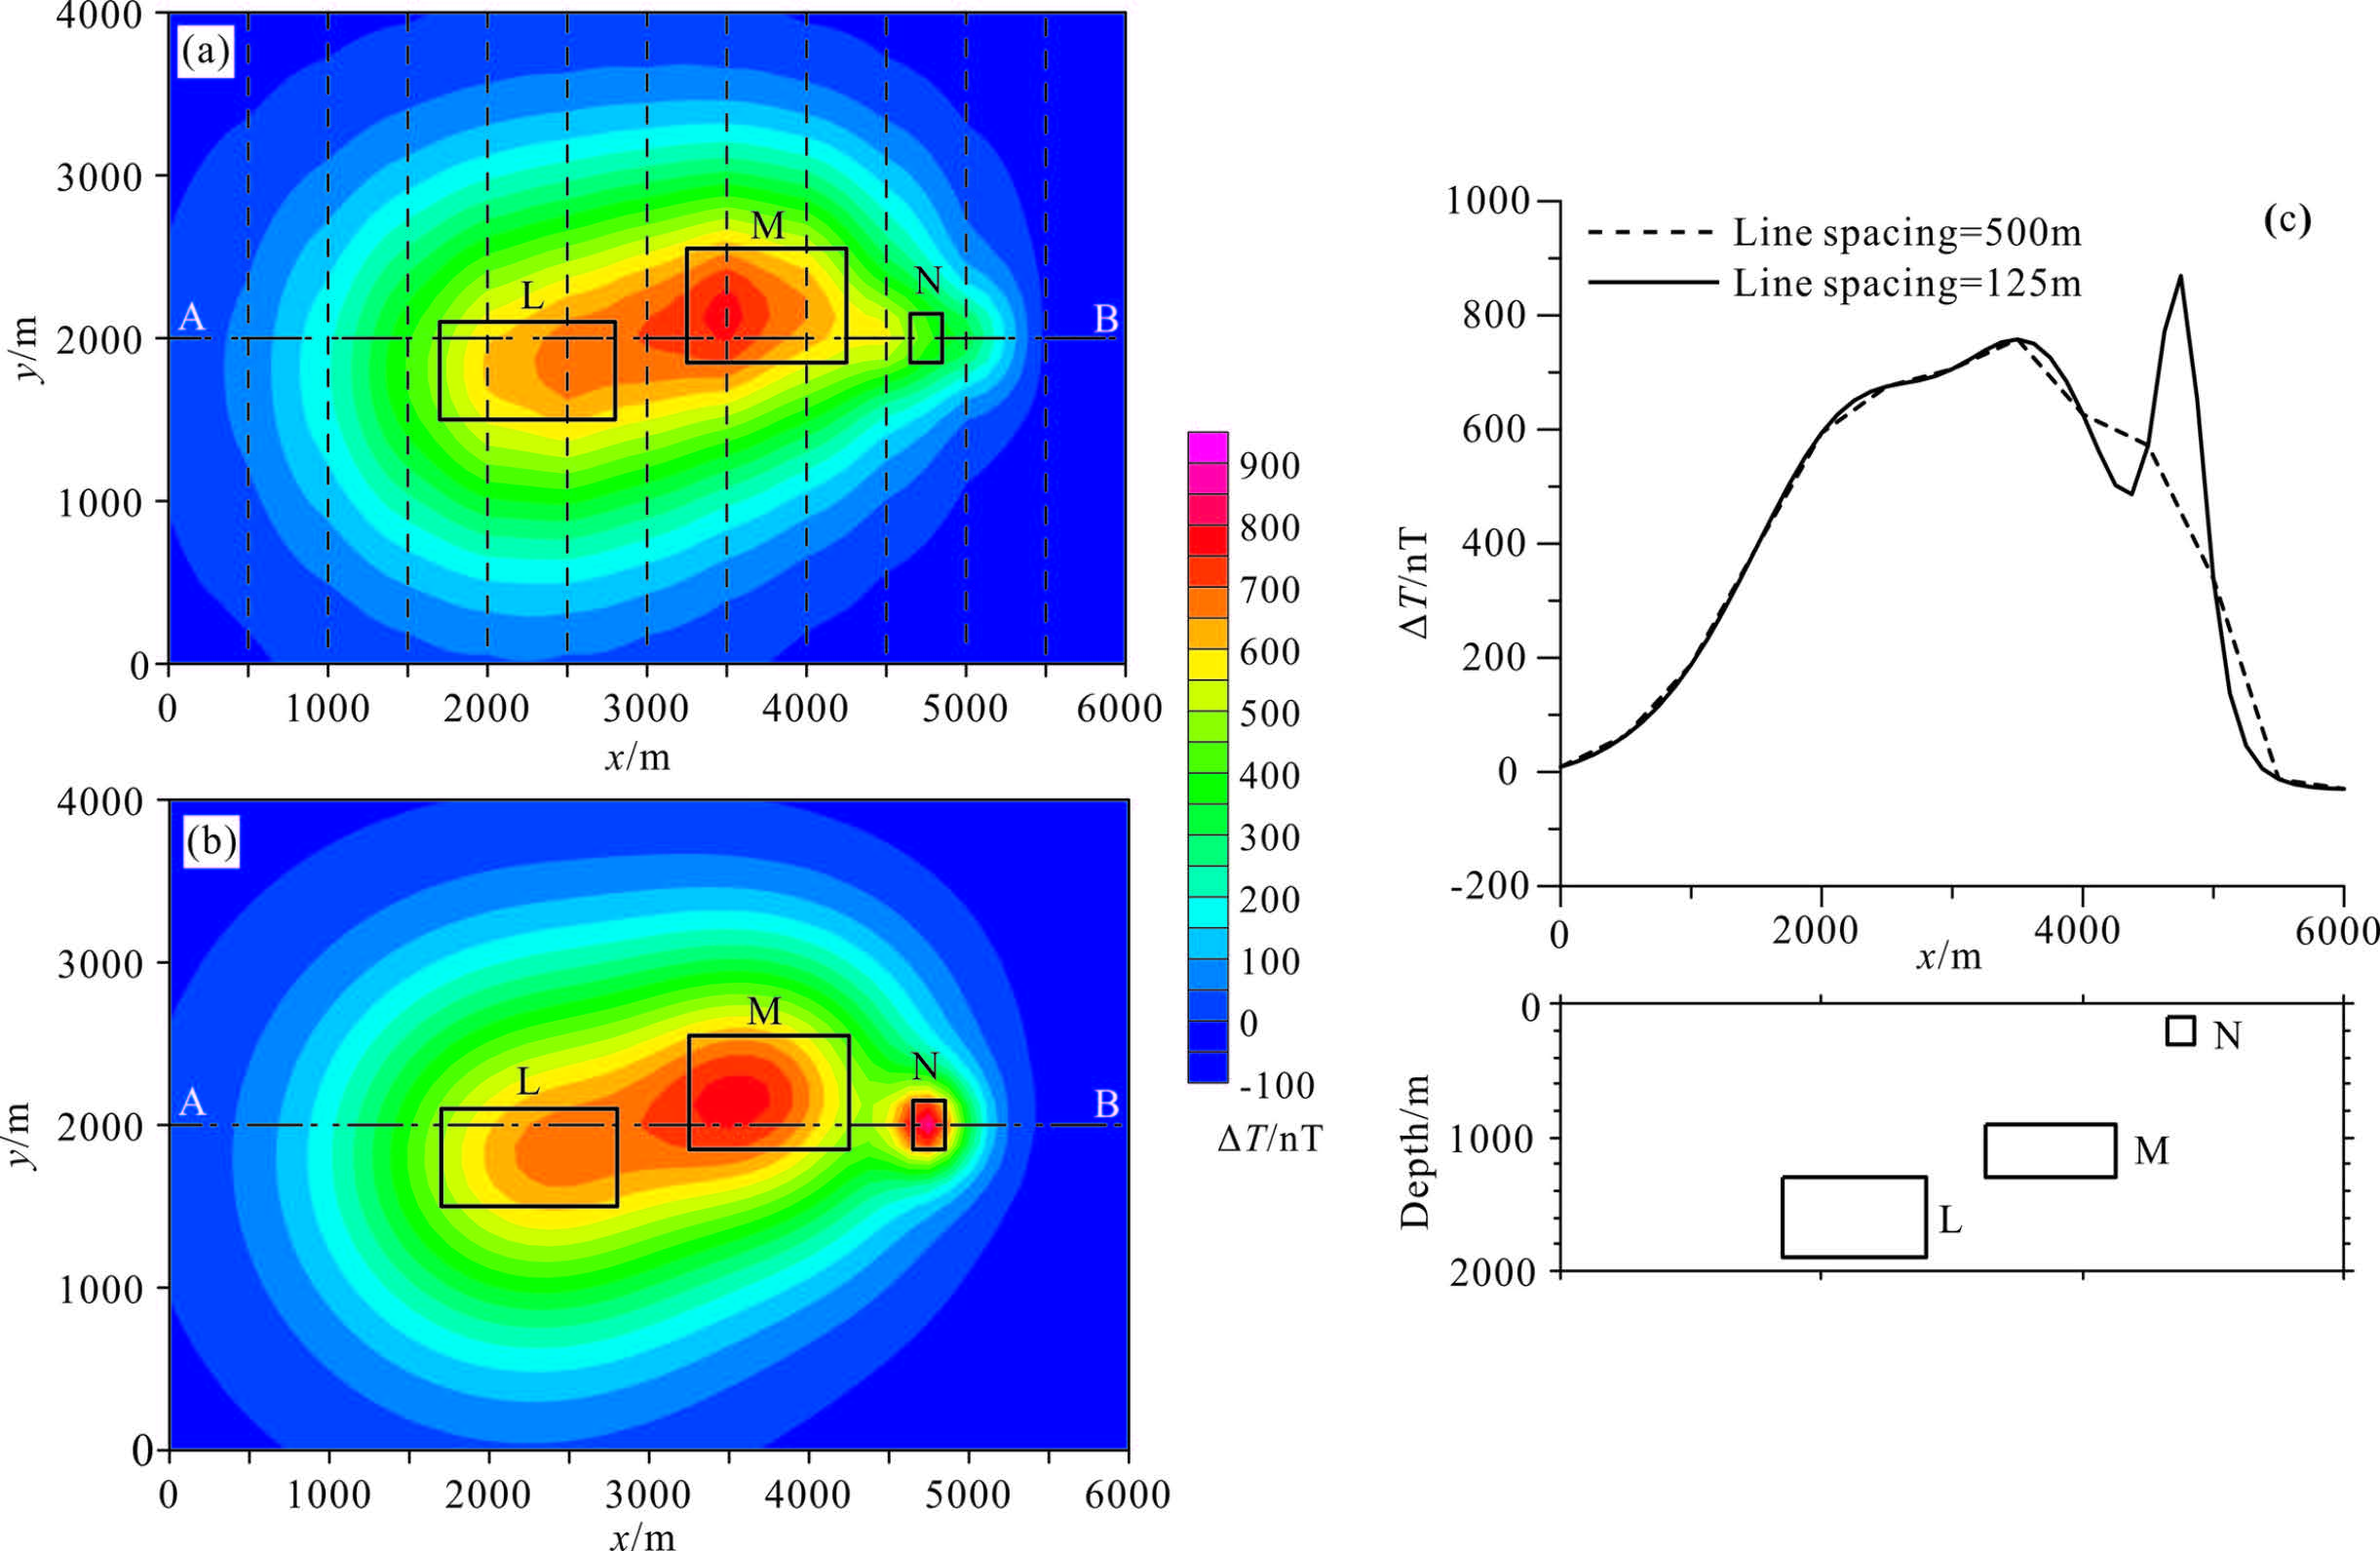
3 TESTS ON THEORETICAL MODELS 3.1 Test 1In test 1,we designed three rectangular models of vertical magnetization. The model parameters are shown in Table1. Model’s planar and profile positions are shown in Fig.1. The survey lines were flown at a height of 200 m. Fig.1a shows that the magnetic anomalies of models L and M are very obvious (all maps were gridded at 125 m interval). Model N lies between two survey lines and its magnetic anomalies are not obvious. When the survey line spacing is 125 m,the magnetic anomalies of model N are very obvious (Fig.1(b,c)).
| Table 1 Parameter of models |
|
Fig.1 Model location and total field (a) Total field,line spacing: 500 m; (b) Total field,line spacing: 125 m; (c) Total field profile (A-B profile in Fig.1a and Fig.1b). |
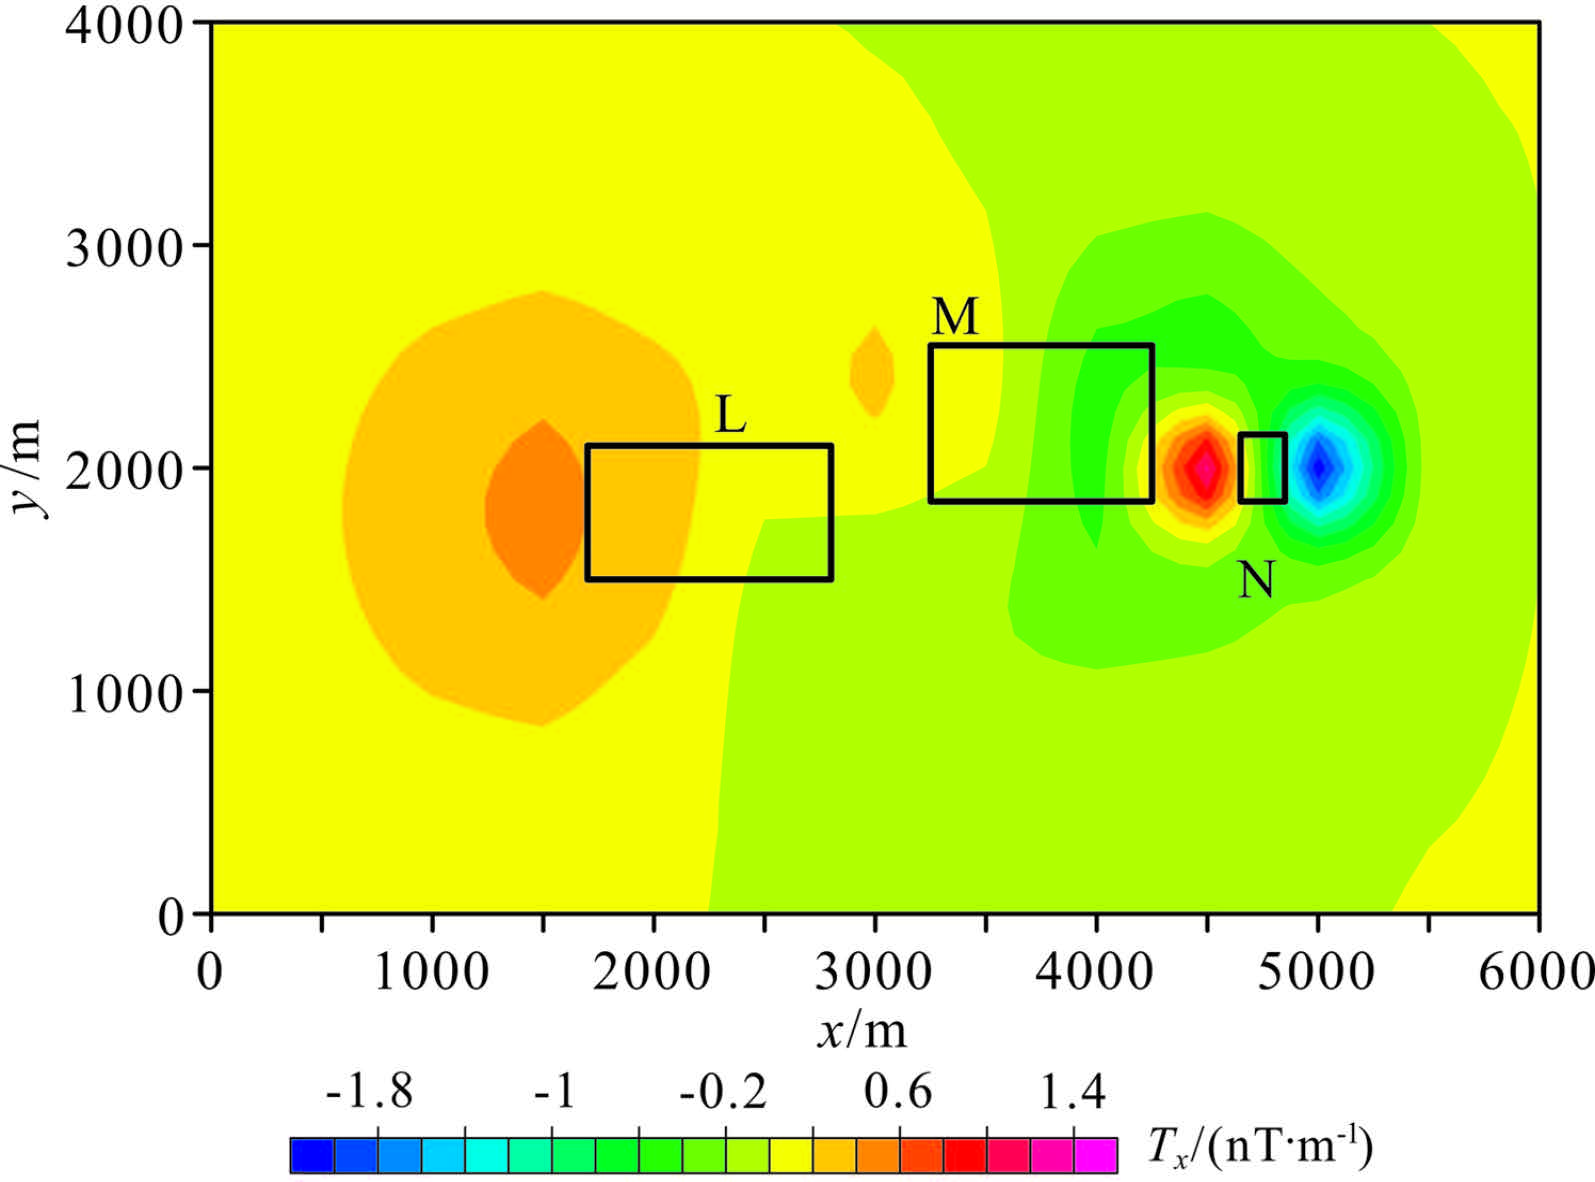
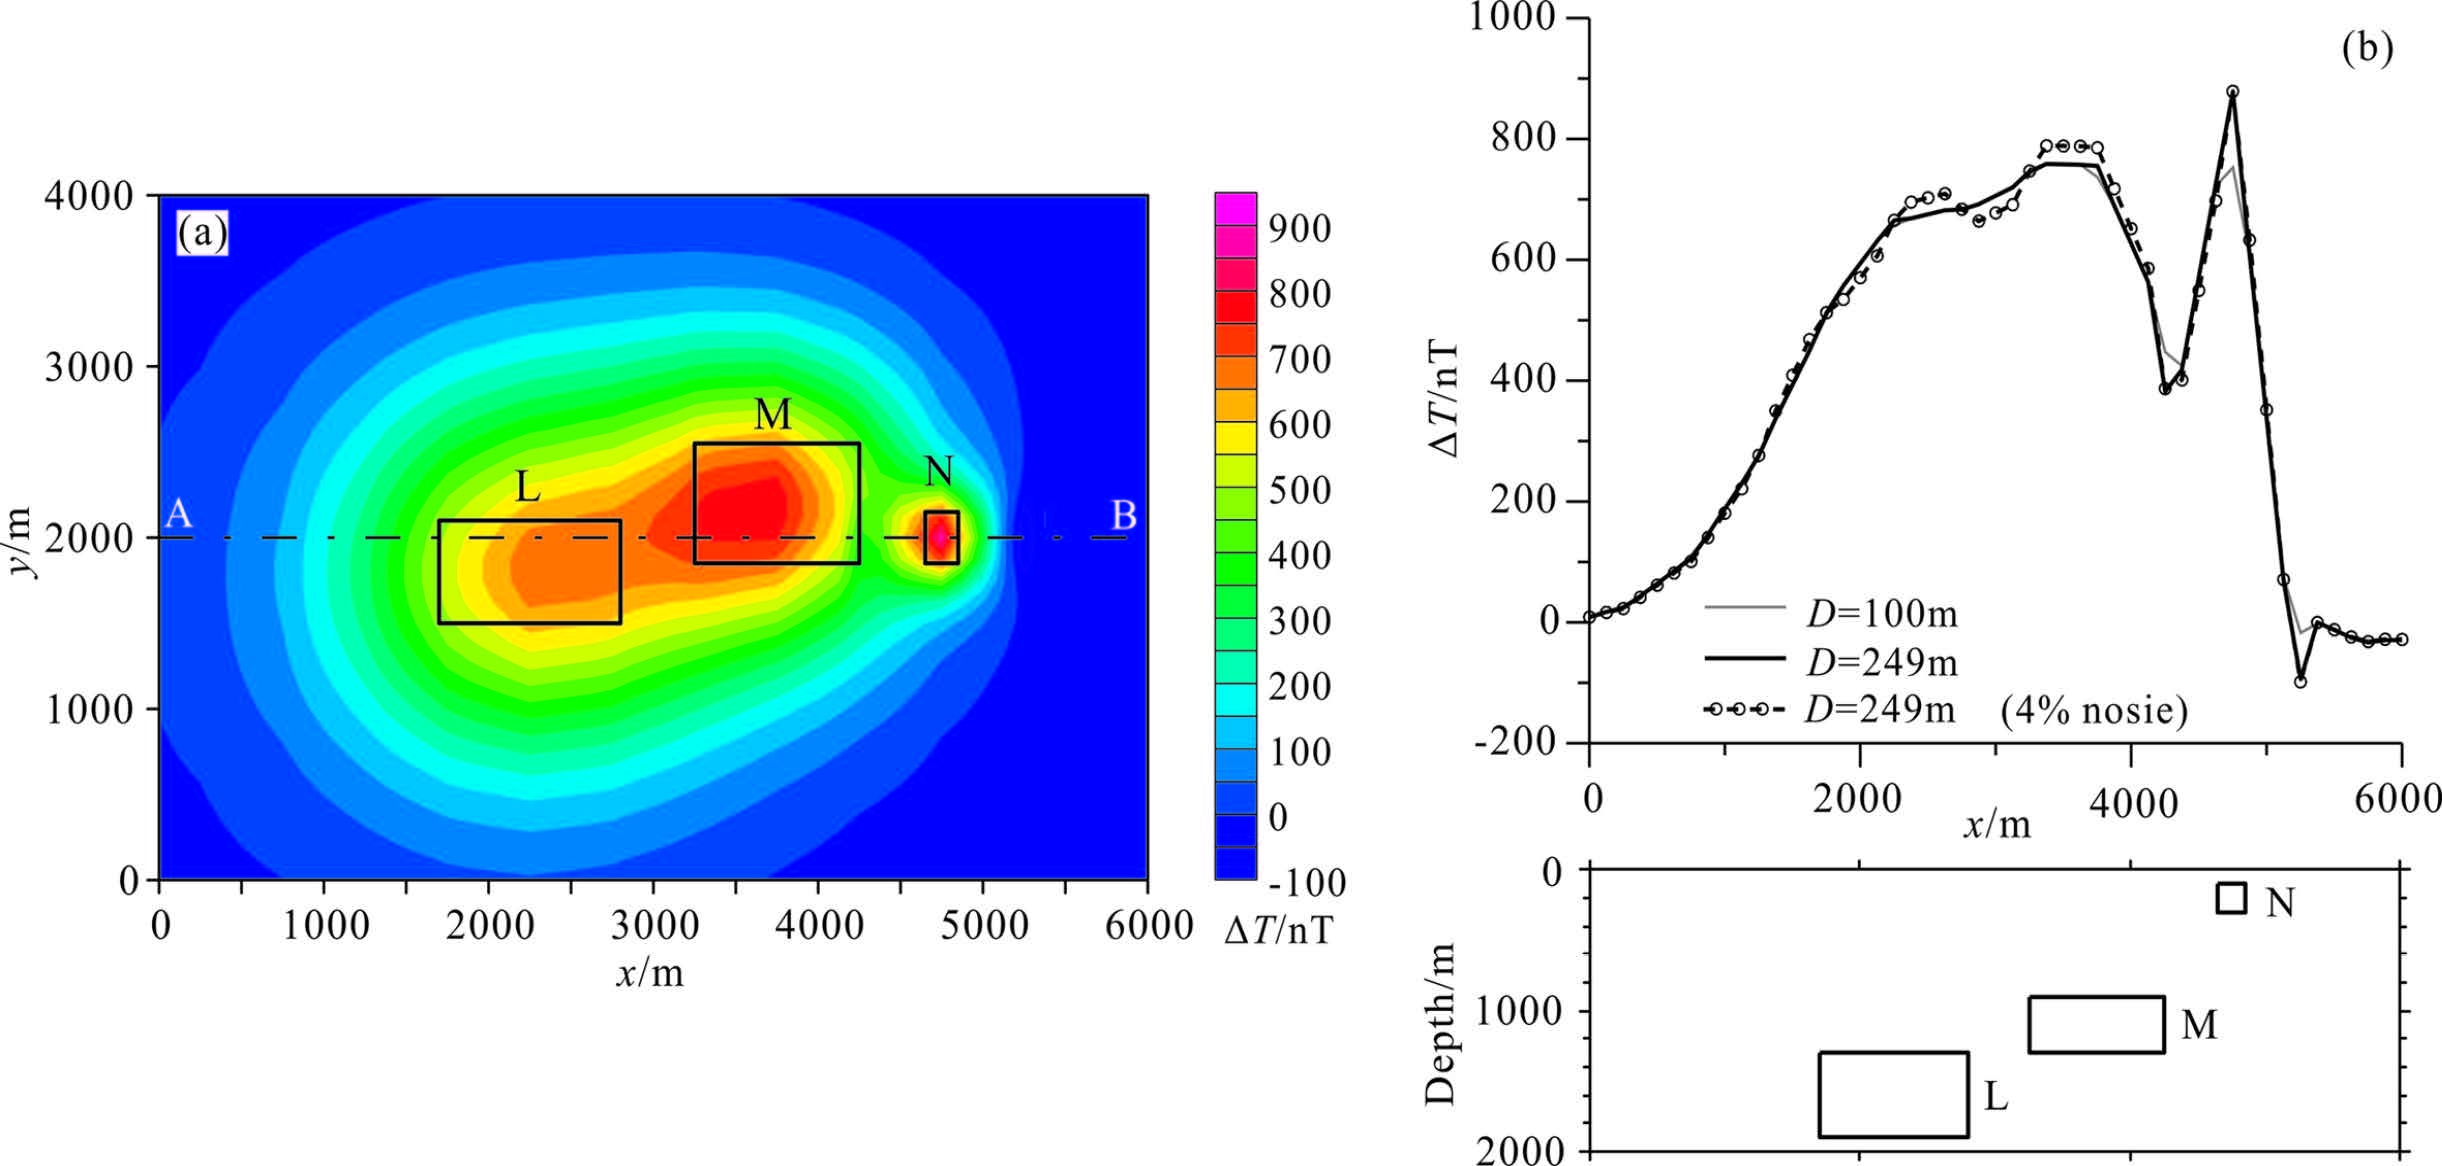
Figure2 shows the lateral gradients (Tx) of 500 m line spacing,the gradient anomalies is obvious,especially the model N. We use the data of Fig.1a and Fig.2 in enhanced gridding and the results are shown in Fig.3. Fig.3a shows the enhanced grid highlights model N. Fig.3b shows the gridding result by D=249 m (including the result by adding 4% random noise to the original data) is more obvious than the result by D=100 m.
|
Fig.2 Lateral gradients (line spacing: 500 m) |
|
Fig.3 Enhanced total field (line spacing: 500 m) (a) Total field,without noise and D=249 m; (b) Total field profile (A-B profile in Fig.3a). |
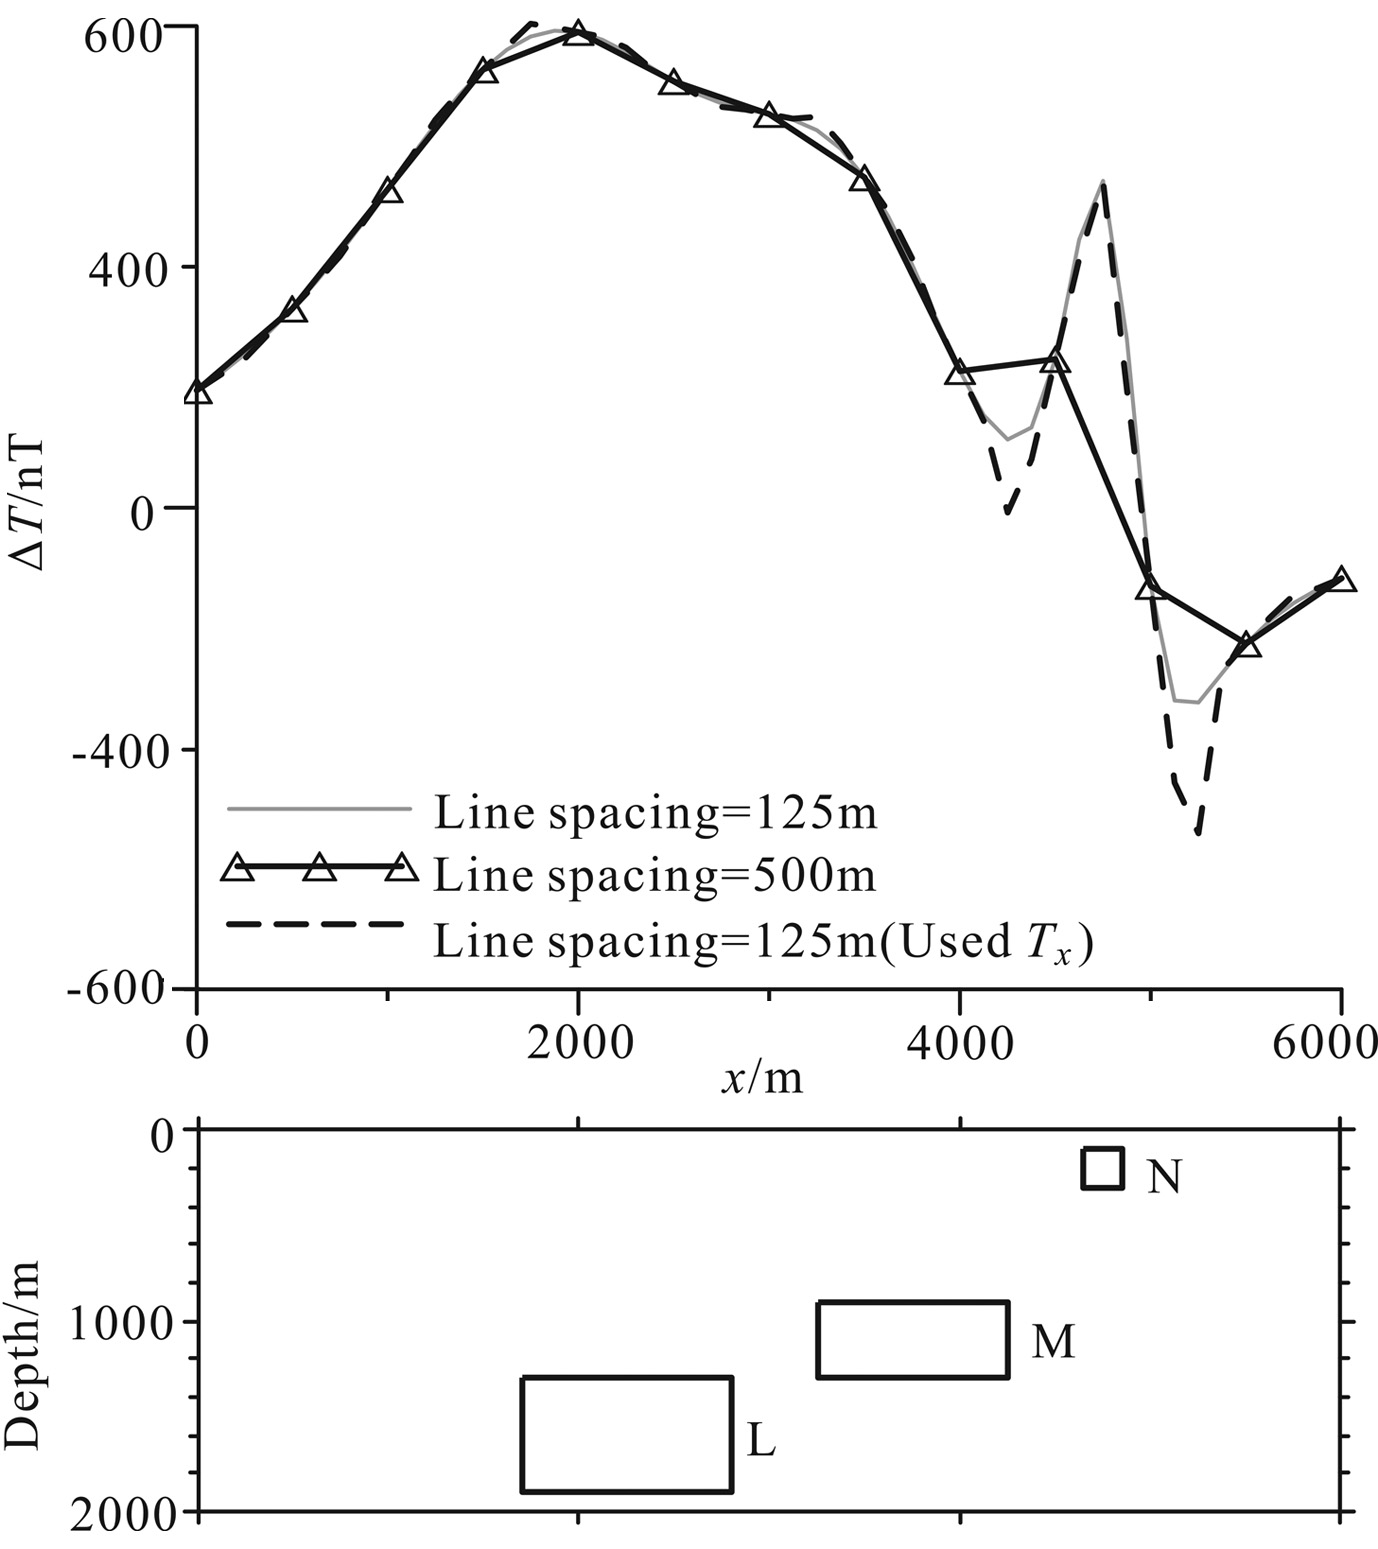
We also analyzed the enhanced gridding of oblique magnetization anomalies,the model parameters are the same with Table1 (the angle between the magnetization direction and the positive direction of X-axis is 60 degrees). Fig.4 shows that the enhanced grid (D=240 m) highlights model N. Its positive anomalies are close to the anomalies of 125 m line spacing,and its negative anomalies are strengthened.
|
Fig.4 Enhanced results of oblique magnetization anomalies (D=240 m) |
In test 2,we designed eleven rectangular models of vertical magnetization with 10 A/m. Model’s positions are shown in Fig.5 and Fig.6. The survey lines were flown at a height of 200 m. Fig.6a shows the enhanced results have a better continuity of the liner feature than before. The direction of the survey line is generally perpendicular to the main structures in the survey area,but partial structures will be substantially reflected along the line. Using enhanced gridding can highlight these structures better.

|
Models profile Fig.5 Total field after enhanced gridding (a) and before enhanced gridding (b) (D=249 m) |

|
Fig.6 Total field after enhanced gridding (a) and before enhanced gridding (b) (D=249 m) |
Part of test flight data by AGS-863 Tri-axial Aeromagnetic Gradiometer in Hebei,China,2011 was used for enhanced gridding. The data was not reduced to the pole and has been leveled[19]. The survey lines were flown 250 m apart and at a mean terrain clearance of 200 m.
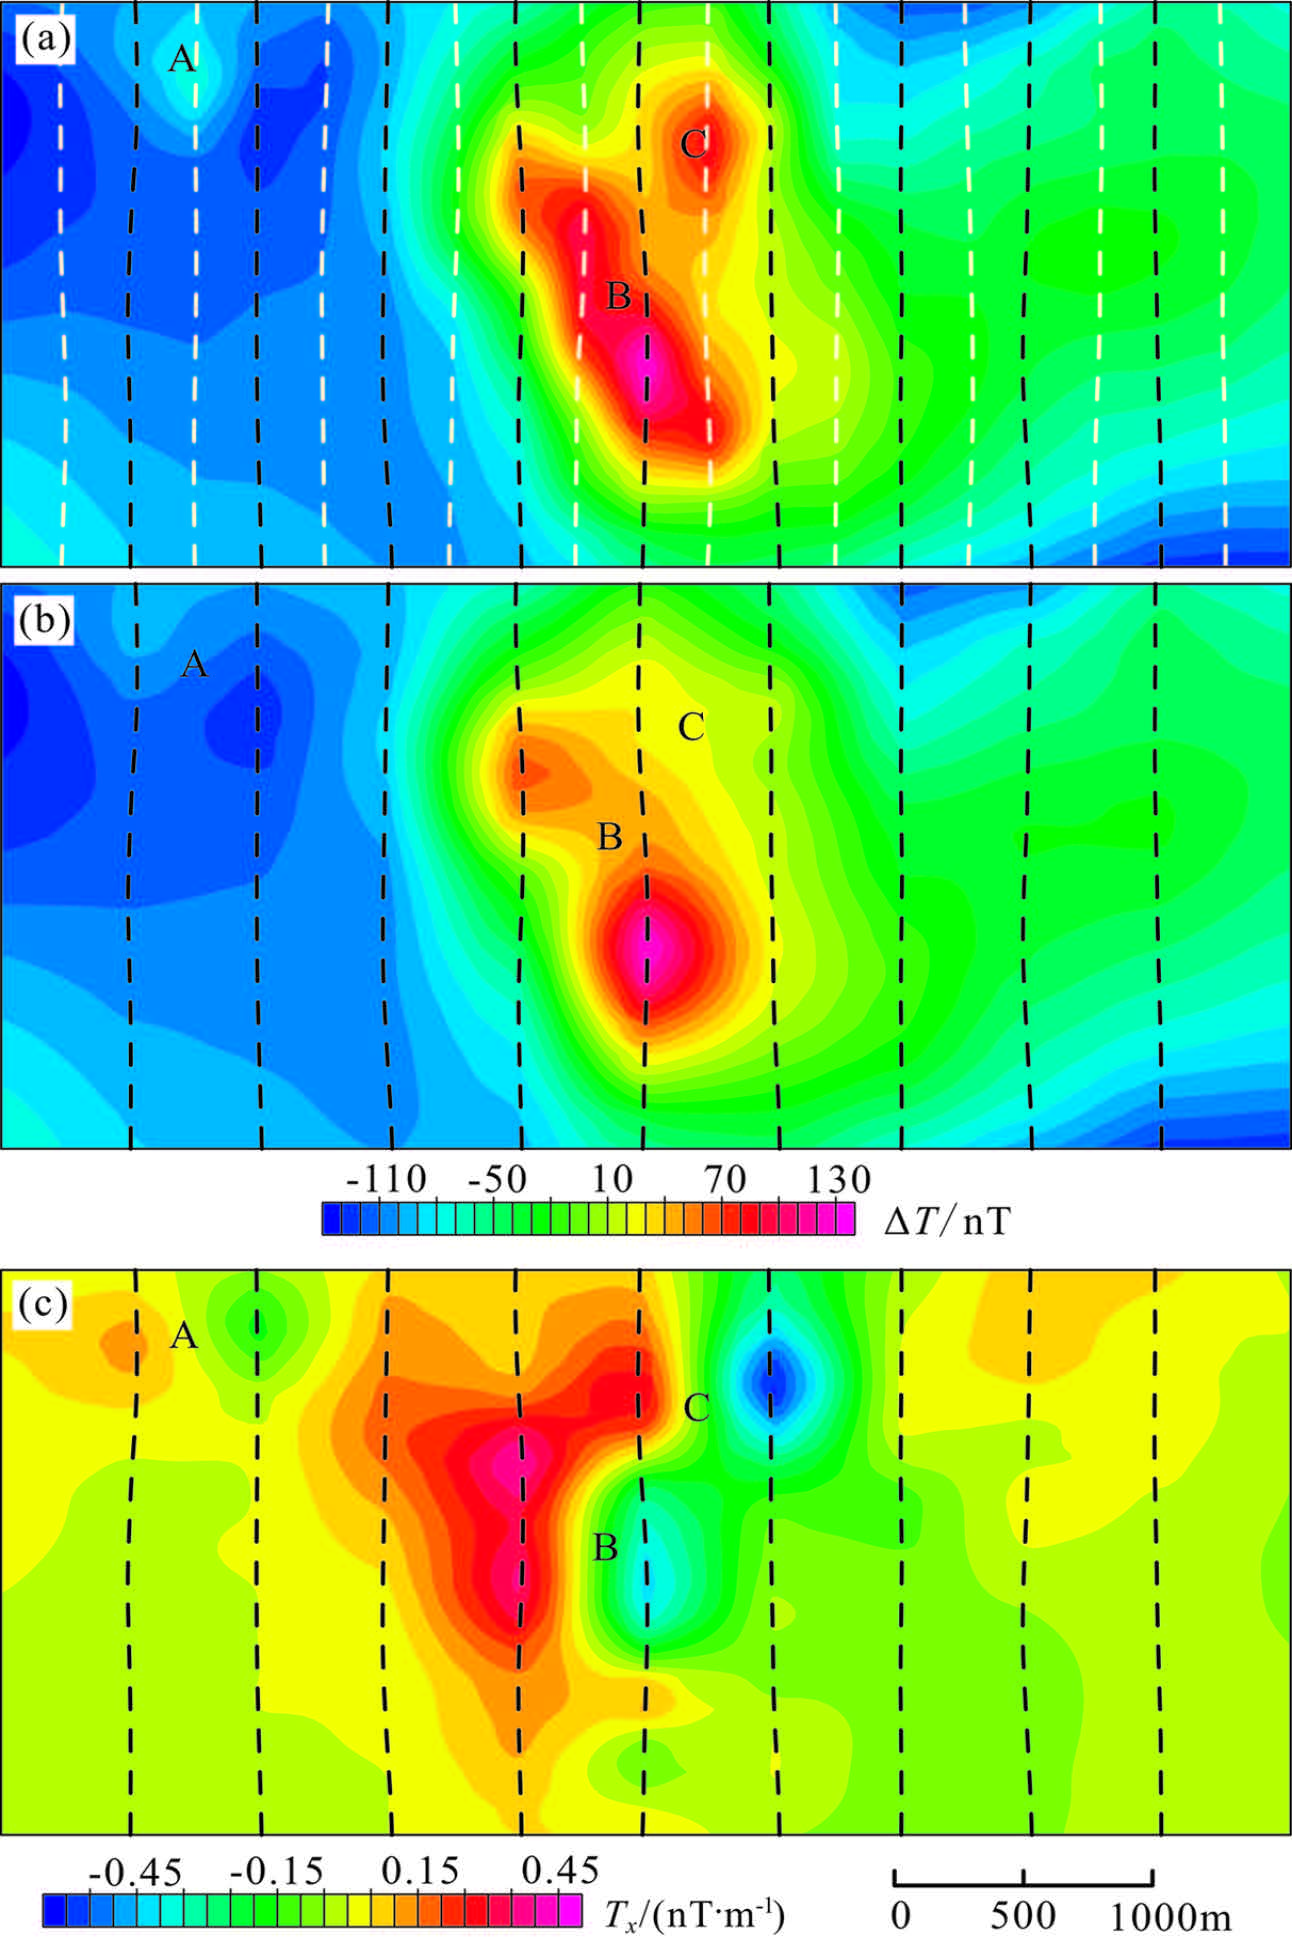
Figure7a shows the original total field data,Anomalies A and C lie between two black dashed lines,anomaly B is across two black dashed lines. In order to verify the effect of enhanced gridding,we removed the white dashed lines,so the line spacing became 500 m. We used the data on black dashed lines to enhanced grid. Fig.7b shows the total field after removal. Anomalies A and C are not obvious,and anomaly B’s continuity is weakened. Fig.7c shows the lateral gradient data after removal.
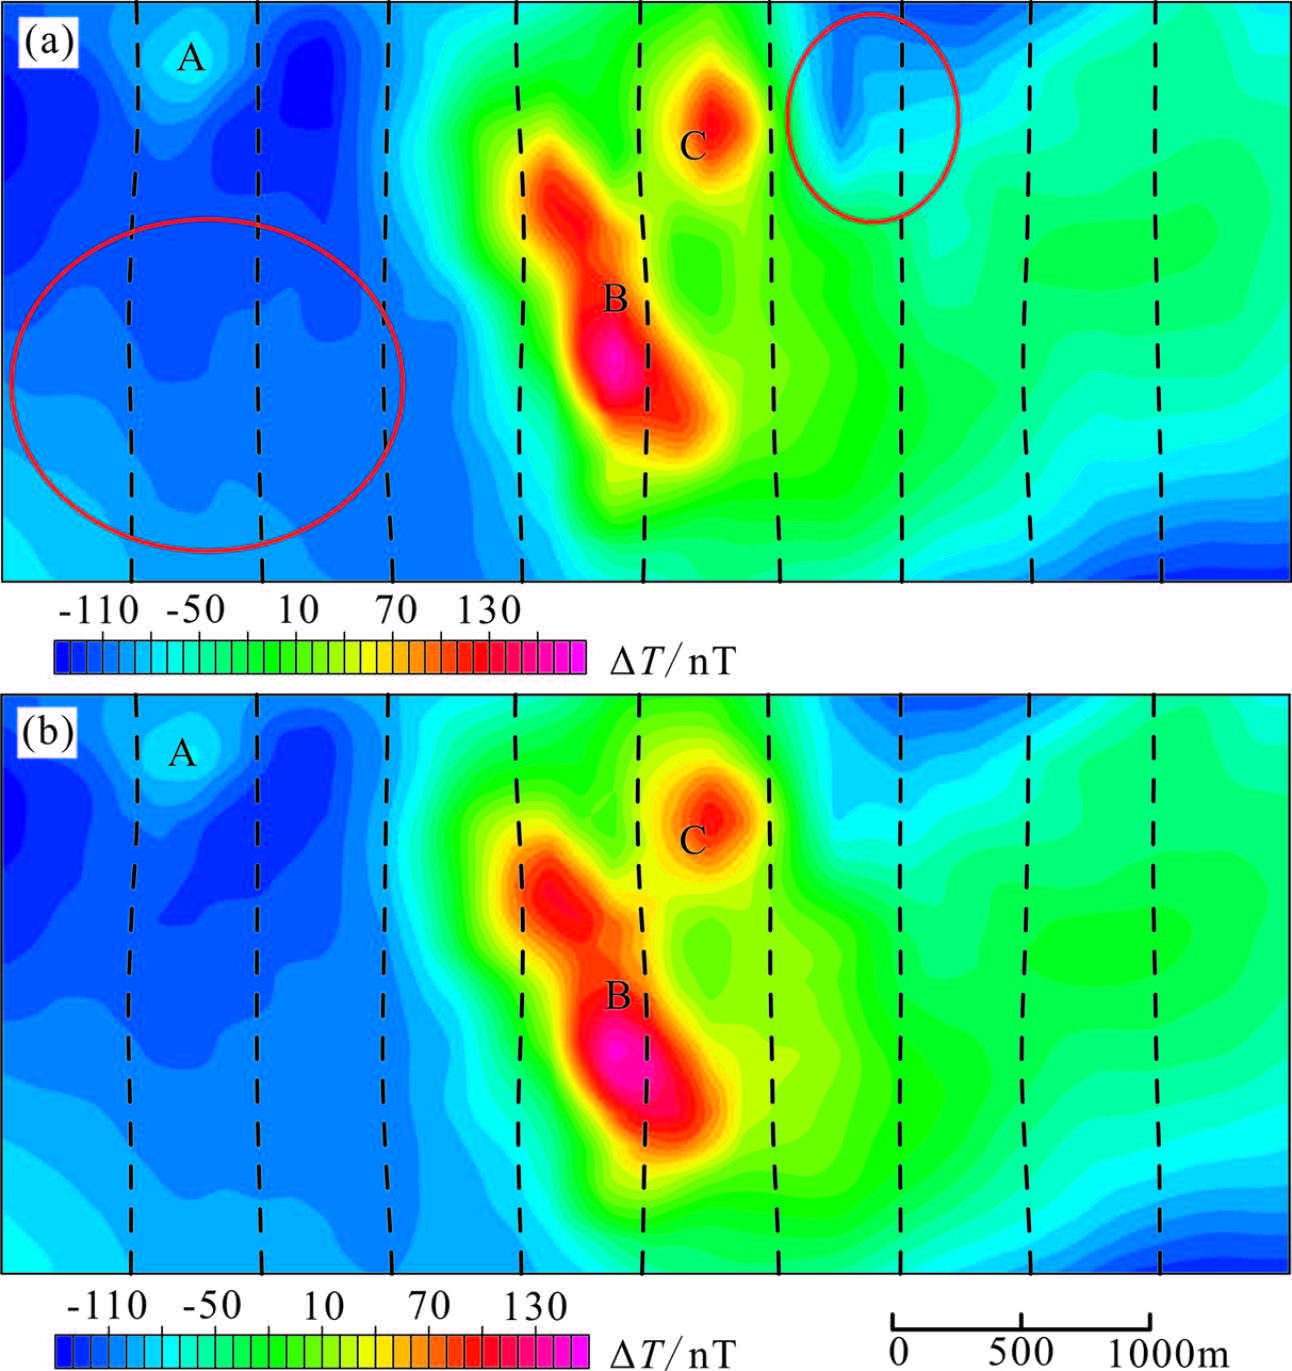
We used the data of Fig.7b and 7c for enhanced gridding processing. Enhanced results (Fig.8a) show the anomalies A and C have been enhanced,anomaly B’s continuity is better recovered,but level noise is introduced in low-gradient areas (in the red circle in Fig.8a). Reford et al.[14] pointed out that the Hardwick method is susceptible to residual line noise. Since the problem appears to be restricted to certain lines only,more careful leveling of the lateral gradients prior to gridding would minimize the problem. But the leveling results will still contain level residual noise. We could use a filter method to remove level noise in enhanced results. There are many methods[20, 21, 22] for removing level noise. In order to retain the original geological information,we used the difference values between Fig.7b and Fig.8a,which includes the level noise,to enhanced grid. We used the cosine direction filter method

|
Fig.7 Total field before and after rarefying and lateral gradients (a) Total field,line spacing: 250 m; (b) Total field,line spacing: 500 m; (c) Lateral gradient,line spacing: 500 m. |
|
Fig.8 Enhanced gridding results (D=240m) (a) Before filtering; (b) After filtering. |
Based on the Hardwick method,Akima interpolation and bi-directional line gridding,we realized gradient-enhanced gridding. We also employed an effective filter method to remove level noise. Finally,we draw the following conclusions:
(1) Tests on theoretical models and measured data show that this method can enhance the magnetic details between survey lines,highlight the anomalies over linear sources that strike obliquely to the survey lines and improve the accuracy and resolution of grid maps.
(2) This enhance-gradient gridding method is susceptible to residual line noise,and careful leveling and effective filtering can minimize the problem.
(3) The enhanced gridding is less useful for the obvious anomalies reflected by survey lines. Since the wingtip sensor separation is limited,the effect of gradient-enhanced gridding can be weakened with the wider line spacing.
(4) The gradient-enhanced result is useful for the magnetic data interpretation,but we must take attention to the random noise existing in the gradient data,which may be introduced into the gridding result. The level noise affects the results of enhanced gridding,and it should be possible to eliminate the noise through more careful leveling,microleveling and other effective filter methods.
This work was supported by the National High Technology Research and Development Program of China (2006AA06A201) and the Geological Survey Project of China Geological Survey (1212011120901). The authors are grateful to the colleagues of AGRS for helpful discussions. The authors are also indebted to unknown referees for their constructive suggestions for improving and completing this paper.
| [1] Xiong S Q.The present situation and development of airborne gravity and magnetic survey techniques in China.Progress in Geophys.(in Chinese),2009,24(1):113-117. |
| [2] Luo Y,Duan S L,Wang J L,et al.Key indicators testing for AGS-863 three axis airborne magnetic gradiometer.Geophysical & Geochemical Exploration(in Chinese),2011,35(5):620-625. |
| [3] Cowan D R,Baigent M,Cowan S.Aeromagnetic gradiometers-a perspective.Exploration Geophysics,1995,26(3):241-246. |
| [4] Hardwick C D.Gradient-enhanced total field gridding.//69th Annual International Meeting:SEG Expanded Abstracts,1999,18:381-385. |
| [5] Hardwick C D.Two methods of gradient-enhanced gridding-A discussion.2004 SEG Expanded Abstracts,Workshop on Magnetic Gradiometry,2004. |
| [6] O'Connell M D,Smith R S,Vallee M A.Gridding aeromagnetic data using longitudinal and lateral horizontal gradients with the minimum curvature operator.The Leading Edge,2005,24(2):142-145. |
| [7] Briggs I C.Machine contouring using minimum curvature.Geophysics,1974,39(1),39-48. |
| [8] Wang W Y,Qiu Z Y.The research to a stable minimum curvature gridding method in potential data processing.Progress in Geophys.(in Chinese),2011,26(6):2003-2010. |
| [9] Guo L H,Meng X H,Guo Z H.Inverse interpolation for gridding of potential field data.Chinese J.Geophys.(in Chinese),2006,49(4):1183-1190. |
| [10] Guo L H,Meng X H,Guo Z H,et al.Fast gridding of geophysical data with inverse interpolation.Progress in Geophys.(in Chinese),2005,20(3):671-676. |
| [11] Smith R S,O'Connell M D.Interpolation and gridding of aliased geophysical data using constrained anisotropic diffusion to enhance trends.Geophysics,2005,70(5):121-127. |
| [12] Bhattacharyya B K.Bicubic spline interpolation as a method for treatment of potential field data.Geophysics,1969,34(4):402-423. |
| [13] Smith R S,O'Connell M D.An improved method for trending of features on aeromagnetic maps.Proceedings of Exploration 07:Fifth Decennial International Conference on Mineral Exploration,2007:853-861. |
| [14] Reford S.Gradient enhancement of the total magnetic field.The Leading Edge,2006,25(1):59-66. |
| [15] Reford S.Gradient enhancement of the total magnetic field.SEG International Exposition and 74th Annual Meeting,2004. |
| [16] Akima H.A new method of interpolation and smooth curve fitting based on local procedures.Journal of the Association for Computing Machinery,1970,17(4):589-602. |
| [17] Guo Z H.A practical contour type data gridding technique.Geophysical & Geochemical Exploration(in Chinese),2001,25(3):203-208. |
| [18] Guo Z H.The development and application of the software of the double cubic spline interpolated gridding technique.//Xiong S Q,Tang W Z,Yao Z X eds.Papers of aero geophysical survey and remote sensing(in Chinese).Beijing:Geological Publishing House,1999:27-33. |
| [19] Luyendyk A P J.Processing of airborne magnetic data.AGSO Journal of Australian Geology and Geophysics,1997,17(2):31-38. |
| [20] Minty B R S.Simple micro-levelling for aeromagnetic data.Exploration Geophysics,1991,22(4):591-592. |
| [21] Fedi M,Florio G.Decorrugation and removal of directional trends of magnetic fields by the wavelet transform:Application to archaeological areas.Geophysical Prospecting,2003,51(4):261-272. |
| [22] Pilkington M,Roest W R.Removing varying directional trends in aeromagnetic data.Geophysics,1998,63(2):446-453. |
 2013, Vol. 56


