2 中国气象局国家气候中心, 气候研究开放实验室, 北京 100081;
3 中国科学院大气物理研究所, 北京 100029)
古气候与现代气候变化研究如何有效结合,是古气候学者和气候学者共同关注的重要问题。“过去全球变化”(Past Global Changes,简称PAGES)和国家重点研发计划专项“全球变化及应对”等国内外科学计划,对于促进这种结合,发挥了一定作用。但是,迄今古气候与现代气候变化研究之间仍然存在鸿沟,两个领域在研究尺度、研究范式和学术语言上存在明显差异。加强古气候学者与现代气候变化研究者之间的对话,对于增进彼此间了解、促进两个学科领域的交叉研究和共同进步,具有积极作用。
2018年8月26日,在银川举行了“气候系统变化的尺度、驱动与反馈:架起古气候与现代气候的桥梁”学术论坛。此次论坛的目的是为古气候和现代气候变化研究者提供一个对话交流的平台。本文第一作者在论坛引导报告中提出并初步阐述了涉及不同时间尺度气候演化的若干科学问题,主题报告人和参会者围绕这些问题展开了深入讨论。关注的时间尺度包括:现代仪器观测时期年代到多年代尺度、人类历史时期多年代到世纪尺度、全新世世纪尺度到千年尺度、晚第四纪千年到万年尺度(轨道尺度)以及新生代万年到百万年尺度(构造尺度)。现代时期重点关注年代到多年代尺度气候自然变率,以及现代气候变化的时空依赖性;古气候(包括历史气候)时期每个时间尺度上关注的问题包括气候变化(变率)的观测(重建)事实、特征规律、驱动机制和反馈过程及其对现代气候变化研究的启示意义。
本文是在该论坛引导报告内容基础上,部分吸收了主题报告和讨论阶段相关评述内容,以及近些年气候系统变化有关领域最新研究成果后完成的。这里试图回答的问题是:现有的古气候研究成果及其所获得的科学认识,如何有效地与现代气候变化研究融合起来,为理解现代气候变化中一些关键问题提供帮助。文章内容按照时间由近及远、将古论今的方式展开,重点放在从近现代到新生代不同时间尺度全球平均温度演化上,希望对感兴趣的读者有一定借鉴意义。
1 现代气候变化19世纪中或20世纪初以来,全球、亚洲和中国温度(指陆地地表 2m气温或海洋表层温度,下同)有明显上升,并得到众多观测研究的证实[1~3]。这个现象就是所谓“全球变暖”,是全球气候变化或气候变化问题的由来,也是全球变化研究的核心问题。
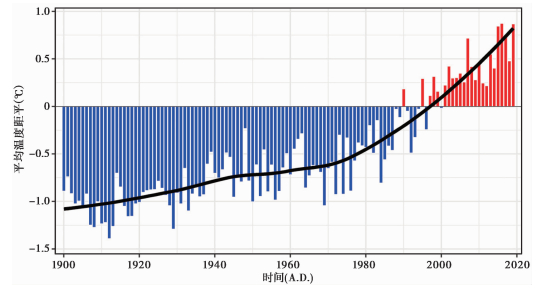
根据政府间气候变化专门委员会(Intergovernmental Panel on Climate Change,简称IPCC)第五次评估报告,1880~2012年期间,全球年平均温度上升幅度为0.85℃(介于0.65~1.06℃之间)[1]。图 1表示现代时期(1900~2019年)亚洲大陆年平均温度变化情况。亚洲地区气候变暖与全球或北半球平均情况大体相似,平均增温速率达到0.13℃/10a,比全球同期增温速率略高,20世纪70年代末以来变暖尤为明显[4]。亚洲大陆变暖趋势在中高纬度地带更为显著[2]。需要说明的是,包括这条序列在内的几乎所有全球陆地和区域平均温度序列,均未排除城市化因素造成的温度观测资料系统偏差。消除城市化影响后,东亚或中国的年平均变暖速率与全球、北半球平均基本一致[5]。根据最新的研究,近60年来的全球陆地年平均温度上升趋势中,城市化影响占13 %的比例[6],即近半个多世纪全球陆地年平均变暖趋势被高估至少为13 %。
现代气候变化已经成为学术界、政府部门和公众广泛关注的重要问题,地球科学和环境科学相关领域开展了大量研究[1]。IPCC定期对气候变化研究进行科学评估,其中与本文相关的评估内容主要涉及地表和高空观测到的气候变化事实、气候变化的自然和人为驱动因素、气候系统敏感性和反馈、古气候重建及其在理解现代气候变化上的意义、区域气候变化特点等。就现代气候变化的原因来看,IPCC第五次评估报告指出,自从1951年以来,观测到的全球平均温度上升,自然强迫的贡献很小,大约一半以上的全球变暖极有可能是人为大气温室气体浓度增加及其他人为强迫共同作用引起的[1]。尽管如此,现代气候变化研究仍然存在大量不确定性。对许多科学问题,例如过去一百多年地面和高空气温等观测资料序列的完整性和代表性[1~2],城市化对温度等要素观测序列和趋势估计的影响程度[7],温度和降水以及极端气候长期变化的主要影响因子[8],多年代以上尺度气候自然变率及其在现代温度、降水变化趋势中的作用[9],20世纪80年代以来“北极放大”(Arctic Amplification)现象及其机理[10],地球气候系统内部分量相互作用与反馈及对外部强迫的敏感性[11],以及气候或地球系统模式对多年代到世纪尺度自然气候变率模拟能力低下的原因[12]等,当前的理解尚不完整。古气候研究可以为回答这些问题提供独特的视角、背景和启示。
|
图 1 1900~2019年亚洲大陆年平均温度距平变化(据文献[4]改绘) 距平是相对1981~2010年平均值的差值;粗黑线表示局部加权回归散点平滑(LOWESS)曲线 Fig. 1 Change in annual mean surface air temperature anomalies of Asian continent from 1900 to 2019. Anomaly is the departure from the 30-year mean of 1981~2010A.D. Black line indicates the locally weighted scatterplot smoothing(LOWESS)values(redrawn from the Blue Book on Climate Change in China 2019[4]) |
从过去1000~2000年来看,目前没有足够长的器测资料可用,最长的站点观测数据是4个欧洲地点(Central England、De Bilt、Berlin和Uppsala)工业革命前(1721年)以来的年平均温度序列[13]。尽管早期观测数据误差较大、年际变率更高、区域代表性偏低,但从这些资料序列仍可以看出,工业革命以后的欧洲地区,特别是19世纪之后,温度较早期明显地上升了。
近数十年来,利用高分辨率代用指标(如树轮、历史文献、冰芯等)重建北半球过去千年温度变化研究取得了一系列成果[14~21]。代用指标、重建方法、目标区域的不同,造成北半球千年温度重建具有一定的不确定性和空间差异[21],但经典古气候学研究提出的“中世纪暖期”(Medieval Warm Period,简称MWP;又称“中世纪气候异常期”,Medieval Climate Anomaly,简称MCA,大致在1.0~1.2kaB.P.),以及15~19世纪的“小冰期”(Little Ice Age,简称LIA),在这些重建序列上有所体现[15]。总体上,已有的重建结果一般表明,从1000年左右历史时期看,20世纪增暖比较异常,但MWP存在较暖阶段,LIA相对低温在北半球各地均有所反映[15, 18~19]。20世纪的明显变暖,实际上是发生在LIA偏冷阶段结束以后的总体升温气候背景下。
根据Mann等[17~18]的研究,MWP并不是每个地区都偏暖,大西洋、欧洲、北美比较暖,而南大洋多数区域是偏冷的,所以全球平均或许也不是明显偏暖。但在LIA阶段,全球陆地多数地区温度为负距平,偏暖的地区较少。因此,LIA的偏冷总体上比MWP的偏暖具有更高的全球一致性。
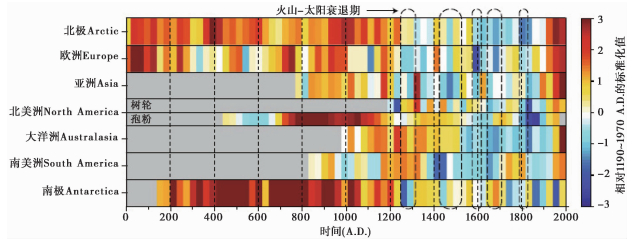
McGregor[22]给出了PAGES 2K合作联盟针对全球各地过去2000年温度的综合重建结果(图 2)。在北极地区,最近2000年的前1000年是偏暖的,13世纪以后则偏冷,20世纪明显增暖;欧洲与北极的变化相似;亚洲早期缺乏代用资料,但MWP相对偏暖的特点仍然存在。19世纪、20世纪亚洲异常变暖,但前期的LIA偏冷阶段同样明显;北美的树轮和花粉重建结果表明,温度变化大体与欧亚大陆相似;在南极,最近2000年的前几百年是明显偏暖的,与北半球不同,在相当于北半球的LIA阶段,南极温度尽管也较低,但19和20世纪的增暖却明显缺失,工业革命以来似乎是近2000年中最冷的一段时期。除了澳大利亚,南半球最近100多年的温度与此前比较并非异常偏高[22]。
|
图 2 全球不同区域过去两千年年平均温度重建的标准化值(据文献[22]改绘) Fig. 2 Standardized annual mean surface air temperature of various regions over the past 2000 years(modified from McGregor, 2018[22]) |
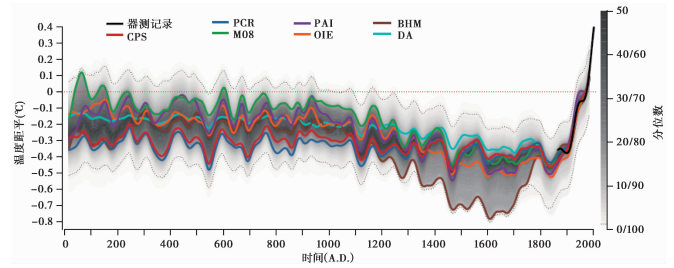
因此,PAGES 2K的综合工作反映出,LIA以来的显著气候变暖,可能主要发生在北极、亚洲和欧洲[22]。就全球或北半球整体来看(图 3),根据PAGES 2K合作联盟古气候代用数据综合研究给出的近2000年平均温度序列[23],突出的变化特征是前1000年偏高,后1000年总体偏低,相当于LIA阶段温度最低,19世纪中期以后快速变暖;最有可能的温度变化介于-0.7℃到0.2℃之间,LIA阶段平均温度比现代低约0.4℃。目前的温暖程度,仅从代用资料序列看,接近但尚未显著超过前1000年平均温度的误差界限[23]。从代用资料和器测资料序列结合来看,1950年以后的全球升温已明显超出过去2000年任何时期(见图 3),但由于两类数据性质差别颇大,这种直接比较尚需慎重。
|
图 3 基于代用数据重建的全球年平均温度距平时间序列(引自文献[23]) 彩色线代表不同重建方法30年低通滤波集成的中值(重建方法包括:PCR:主成分回归,principal component regression;PAI:配对比较,pairwise comparison;BHM:贝叶斯多层模型,Bayesian hierarchical model;CPS:合成与尺度变换,composite-plus-scaling;M08:变量正则化误差,regularized errors in variables;OIE:最优信息提取,optimal information extraction;DA:离线资料同化,offline data assimilation)灰色点线代表所有重建方法集成成员的第2.5和97.5分位值;黑色曲线代表1850~2017年器测温度距平序列,距平是相对1961~1990年平均的差值;红色点线是温度距平0值线 Fig. 3 Global mean surface air temperature anomalies reconstructed based on proxy data(from PAGES 2K Consortium 2019[23]). Color lines indicate the mediums of 30-year low-pass filtering values(PCR:principal component regression; PAI:pairwise comparison; BHM:Bayesian hierarchical model; CPS:composite-plus-scaling; M08:regularized errors in variables; OIE:optimal information extraction; DA:offline data assimilation). Grey lines represent the 2.5th and 97.5th percentiles of all the assembles of different reconstructing methods; Black curve indicates the instrument-based global mean temperature anomalies of 1850~2017, and anomaly is the departure from 1961~1990 average; Red dotted line indicates 0 line of the temperature anomaly |
中国东部地区过去千年温度变化与北半球基本一致,MWP较明显,温暖程度可能与20世纪平均水平相当,但MWP开始时间似乎略早,比欧洲持续了更长时间,从9世纪开始,一直到13世纪后期;LIA偏冷特点在中国东部亦很明显[24~35]。但是,中国西部(特别青藏高原)树轮资料在一定程度上反映出,20世纪的快速气候变暖,以及LIA阶段的温度降幅,相对中国东部的变化较小,MWP温度异常偏高现象也不突出[36~40]。全国平均温度变化综合了东部和西部的特征,大致表现出10~13世纪略偏暖,15~19世纪偏冷,20世纪增暖速率和幅度与MWP比较差异不显著[26, 41~44]。
关于过去1~2ka全球温度变化的成因机制,目前有多种看法,其中两种涉及太阳辐射和火山喷发的影响[15, 45~46]。地球轨道参数的变化在近1~2ka里是很弱的[47]。9ka来地球轨道参数的变化主要导致北半球夏季太阳辐射不断减少,最近5ka来,北半球中高纬度夏季的太阳辐射仍在持续缓慢下降,冬季太阳辐射则不断上升;但是,全新世北半球年总太阳辐射变化很小[15, 47]。所以,轨道参数变化对北半球近2ka年平均温度趋势的影响应该不大。
就太阳黑子变化来看,17世纪后期到18世纪初的“孟德尔极小期”(Maunder Minimum),太阳黑子数量极少,再早阶段及19世纪初以来黑子数量较多[48]。一般认为太阳黑子活动指示太阳输出辐射量的多少,而太阳输出辐射变化可能是MWP气候较暖和LIA气候偏冷的主要原因之一[45, 49]。比较太阳黑子数量变化和1654~1800年中英格兰地区器测温度资料[50],可以发现温度没有明显的趋势性变化,但其多年代尺度波动性与太阳黑子数有较好对应关系,在“孟德尔极小期”,中英格兰的年平均温度偏低。根据极地冰芯中气泡气体组成重建的过去1ka大气中CO2浓度变化显示,MWP时CO2浓度略有升高,LIA阶段则较低,工业革命以来明显升高[51]。因此,大气中CO2浓度变化对近1ka工业革命前时期温度变化或许也有一定影响,但其影响程度多大,是需要解决的问题。
近些年来,已有许多研究利用气候模式模拟近1~2ka火山喷发、太阳辐射以及人类活动对全球平均温度变化的影响[52~57]。数值模拟研究表明,人类活动对近200年长期温度趋势影响较大,但太阳辐射变化对早期温度的影响更为明显;在LIA阶段,太阳辐射减弱和频繁的强火山活动对多年代到世纪尺度温度变化有重要影响[52, 56, 58]。从现有研究看,模式气候对历史上重大火山喷发的响应常常过于敏感,高估了喷发后北半球或全球的降温幅度[1, 59]。这可能表明,当前的全球气候模式敏感度确有偏高。此外,气候模式在模拟年代到多年代尺度气候变率上也存在较大不确定性[51, 55]。历史时期气候变化和变率的原因有待开展进一步研究。
3 全新世全新世持续时间约从11kaB.P.至今。根据冰川进退、植物花粉、湖泊沉积等多种代用记录重建结果,一般认为全新世早中期温度上升或偏暖,中晚期逐渐转冷,全新世中期温度明显高于20世纪,即存在所谓“全新世大暖期”[60~62]。IPCC第五次评估报告(AR5)评估了全球各个纬度带的全新世年平均温度变化,指出全新世早中期北半球中高纬度普遍存在一个偏暖时期,热带印度洋和热带太平洋全新世早中期温度偏低[1]。但总体来看,全新世大尺度温度和干湿变化重建,困难很大,其中涉及到代用资料分辨率和连续性低、气候指示意义含糊、空间代表性差等一系列问题,迄今研究和评估结果的可信度还不高。
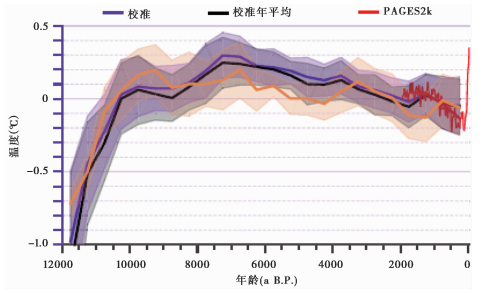
Kaufman等[63]收集整理了679个具有至少4ka长的各类代用数据,包括湖泊沉积、海洋沉积、泥炭、冰川等自然代用记录,重建了全新世全球平均温度时间序列(图 4)。这个序列颠覆了古气候学经典学说,表明全新世全球年平均温度变化幅度比过去推测的小得多,大约7kaB.P.以来温度持续缓慢降低,与早期报道的格陵兰冰芯氧同位素资料较为相近[63]。这种小幅变化推测可能主要与地球轨道参数导致的冬、夏季温度异相变化相互抵消有关,也应该与代用数据地点大幅度增多以后不同区域相反的变化趋势相互抵消作用有关。根据这个低分辨率、多地点集成年平均温度序列,结合PAGES 2K Consortium的近2ka温度重建[23],近现代的全球变暖已比较异常,接近早中全新世温度中值的95 %置信区间;如果叠加器测资料序列,则近现代平均温度距平已明显超出早中全新世温度距平中值的95 %置信区间,气候变暖十分异常(图 4)。但是,如前所述,简单地比较器测温度序列和基于代用数据重建的温度序列需要慎重。
|
图 4 全新世全球年平均温度距平变化(据文献[63]中图 8改绘)阴影区表示95 %置信区间;红色曲线表示PAGES 2K Consortium(即本文的图 3) 多方法集成(平均)序列30年滑动平均值;黄色线表示未校准温度值 Fig. 4 Global annual mean temperature anomalies during the Holocene(redrawn from Fig. 8 of Kaufman et al. 2020[63]). Shade area indicates the 95 % confidence level. Red curve represents the PAGES 2K Consortium 30-year moving average of the temperature anomalies reconstructed (as shown in Fig. 3 of this paper); Yellow line indicates the uncalibrated temperature |
Bova等[64]认为,原有全新世温度重建主要反映了季节性平均温度,包括Kaufman等[63]重建的温度序列,均存在北半球夏秋季偏差。他们发展了一个将季节平均温度转换为年平均温度方法,并利用海洋沉积物有孔虫介壳钙/镁比(Mg/Ca)或长链烯酮(Alkenone)等指示海表温度(SST)的代用资料,对全球中低纬度地带年平均SST进行重建,得出自全新世初到现代温度持续上升的结论[64]。这个结果与Kaufman等[63]重建序列存在较大差异,但与基于早期冰芯资料重建的格陵兰地区年平均温度变化[65]和模式模拟的区域、全球年平均温度变化[66~67]基本一致。然而,两项研究均表明,最近1万年全球年平均温度变化幅度很小,可能不超过0.5℃。由于过去一百多年全球年平均温度上升幅度接近1.0℃[1, 3, 8],这两项最新研究也就暗示,近百年的全球气候变暖在过去1万年里可能是十分异常的;如果模式预估的未来百年全球温度变化趋势(到本世纪末高于2.0℃)[1]是正确的,其升温速率和幅度很可能将显著超出其上边界。
显然,这些最近全新世温度重建序列的可靠性,还需要更多证据支持。假设Kaufman等[63]或Bova等[64]序列是经得起检验的,整个全新世和近2000年代用资料序列的对接和比较也需要慎重对待。近2000年代用资料的晚近部分包含大量树轮年表数据[22~23, 27~28, 68~69],后者在重建多年代以上尺度年平均温度序列方面存在若干不确定性,包括去生长趋势拟合函数选取、树轮指标常常仅对某个季节温度敏感以及现代大气中CO2浓度肥力效应难以分离等问题,仍需要在今后研究中加以解决。
全新世大气温室气体浓度发生了一定变化[70~72]。大气中CO2浓度在早中全新世较低,从6kaB.P.到现在有一个增加的趋势,增加约20~30 ppmv;工业革命以后快速上升,至今已超过415 ppmv,比工业革命前平均水平增加约45 % [73]。这个长期增加趋势,是当前气候模式模拟获得全新世年平均温度持续小幅增加的主要驱动因素[66~67, 70]。中晚全新世以来大气中CO2浓度增加的原因,可能与旧大陆农业开发及其相伴随的土地覆盖变化有关[70, 72]。例如,在中国长江以北,近5ka以来森林植被呈现持续衰退趋势,主要是仰韶文化以后农业活动不断加强和扩张的结果[72];在西亚、南欧和北非,乔木植被经历了同样的衰退过程,陆地生态系统的碳汇作用逐渐减弱[70]。全新世大气中CH4含量具有与CO2相似的变化,最近5ka也有缓慢的增加现象,主要增加发生在近3ka[70~71]。
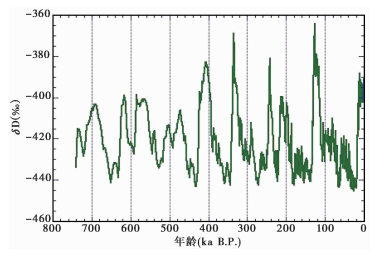
4 晚第四纪在轨道到亚轨道时间尺度上,来自南极和格陵兰冰盖的冰芯记录提供了最有价值的古气候信息[74~82]。在过去75万年,南极冰芯资料表明[75],最近的40万年地球冷暖波动具有10万年左右周期,即冰期-间冰期循环;而早期的气候波动以4万年左右周期为主(图 5)。但不管长周期还是短周期,一般认为它们都是地球轨道参数变化引发的,分别由地球公转轨道偏心率、黄赤交角和岁差周期共同调制产生[77, 83~84]。
|
图 5 过去75万年南极Dome C冰芯氘同位素记录(引自文献[82]) δD一般认为指示温度变化 Fig. 5 Antarctic Dome C ice-core δD records of the past 750ka(from EPICA Community Members 2004[82]). δD values indicate regional surface air temperature variation |
最近40万年内,全球大气中CO2和CH4浓度,以及全球平均海平面,均与南极或南半球平均温度之间具有非常好的对应关系,冰期阶段位于低谷,间冰期阶段处于巅峰,从轨道尺度上看几乎重叠[74~77];但是,在更细时间尺度上,例如在几十年到百年尺度上,他们之间的位相关系究竟如何,即温度(海平面)和温室气体浓度何者在先,何者在后,这个问题一直没有了解清楚[85]。一些研究[86~87]认为,南极或南半球的温度变化先于全球性温室气体浓度变化。然而,即使存在这样的位相关系,也不能说明大气温室气体浓度演变不是驱动全球或北半球温度变化的重要因素,因为也有研究[88~89]认为,北半球平均温度变化可能滞后于南半球。如果这是事实,而且滞后效应比较明显,仍不排除大气中温室气体浓度变化先于北半球或全球平均温度变化的可能性。
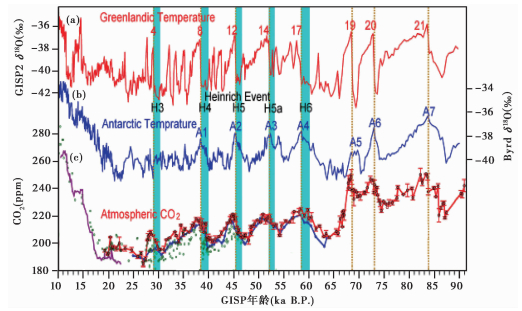
Ahn和Brook[90]的综合研究展示了南、北两半球温度变化之间,以及温度与温室气体浓度变化之间位相联系的复杂情景(图 6)。他们认为,末次冰期(Last Glacial)内,亚轨道尺度上的南极温度变化要提前于CO2约0~400年,也早于格陵兰冰芯重建的北半球温度变化,致使南极温度百年到千年尺度峰值一般对应北半球温度的谷值;这样南极温度波动的主要驱动因子应该不是CO2,而是其他因素或气候系统内部自然变率[90]。Beeman等[87]对南极冰芯的综合分析与之类似,在冰消期起始阶段,即在18kaB.P.附近,南极温度变化可能比CO2变化早570年左右,而在冰消期结束即11.5kaB.P.附近,南极温度变化比大气CO2浓度变化早532年左右,但在南极冷反转(Antarctic Cold Reversal,简称ACR)期间,当地温度与CO2浓度变化的关系不明显。这表明,在更长的轨道时间尺度上,北半球温度似乎仍然早于南极或南半球。因此,轨道尺度上的驱动和反馈过程,与亚轨道或更短时间尺度存在差异。
|
图 6 南极和格陵兰冰芯记录的大气中CO2浓度和温度(δ 18 O)变化情况(据文献[90]改绘) (a)格陵兰冰芯重建的温度;(b)南极Byrd站冰芯重建的温度;(c)多数据集成的全球大气CO2浓度 Fig. 6 Atmospheric CO2 concentration and temperature(δ 18 O)reconstructed from ice-core of Antarctic and Greenland(redrawn from Ahn and Brook[90]). (a)Greenland reconstructed temperature; (b)Antarctic Byrd Station reconstructed temperature; (c)Global atmospheric CO2 concentration from multi-result integration |
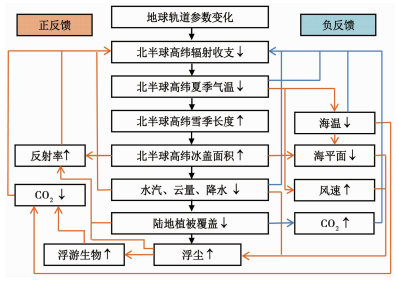
在轨道尺度上,地球轨道参数周期导致的北半球高纬度夏季太阳辐射变化应该是初始驱动[47, 77]。轨道参数变化改变高纬度夏季太阳辐射,进而引起北半球中高纬度温度变化,而后者再引起大陆冰雪覆盖、地表反照率、大气水汽含量、海洋环流、大气粉尘含量、大气中CO2浓度等系列变化[91~92];后几个因子的变化总体上起到正反馈效应,致使北半球温度进一步下降、冰盖持续扩大。我们总结了晚第四纪冰期-间冰期循环北半球冰盖扩张过程中的地球气候系统相互作用与反馈过程,见图 7。
|
图 7 晚第四纪冰期-间冰期循环北半球冰盖扩张过程的地球气候系统相互作用与反馈过程示意图 海温指海洋表层水温(SST),CO2升降指大气中CO2浓度变化,浮游生物指海洋中浮游动物和植物;黄色线指示正反馈环路,蓝色线指示负反馈环路 Fig. 7 Schematic diagram of interaction and feedbacks of the earth climate system's components in the northern hemispheric glaciation stage during the glacial-interglacial cycles. Ocean temperature indicates the sea surface temperature(SST); Rise and drop of CO2 indicate increase and decrease in atmospheric CO2 concentration; Plankton indicates the zooplankton and phytoplankton in ocean; Yellow and blue lines indicate positive and negative feedback rings, respectively |
通过图 7,我们解译冰期演进的具体过程可能是:在地球公转轨道偏心率变大,黄赤交角变小,同时春分点变动致使夏至日逐渐接近公转轨道远日点,北半球中高纬度夏季太阳辐射减弱,温度下降,积雪季节延长,暖季积雪增多,冰川发育并扩张,欧、美大陆逐渐形成冰盖;当地球公转轨道偏心率最大,黄赤交角较小,同时夏至日到达接近轨道远日点时,北半球中高纬度夏季太阳辐射很弱,大陆冰盖面积和厚度进一步增大;冰盖一旦形成并扩张,冰雪反射率反馈机制启动,导致温度进一步降低,冰盖继续扩大;温度下降致使海表、地表蒸发和蒸腾作用减弱,大气中水汽含量减少,作为主要温室气体的水汽含量下降导致全球温度进一步降低;由于大气中水汽含量减少,也使得全球降水量整体下降,同时全球海平面下降引起的大陆架出露,陆地面积扩张,各个大陆内部气候变得更干燥,沙漠范围扩大,加之近地表扰动和风速加大,沙尘暴频率和强度上升,大气中粉尘气溶胶含量剧烈增加。粉尘气溶胶含量剧增减弱了达到地表的太阳辐射,引起增强的降温作用;海洋表面温度下降和大气粉尘含量增多,有助于启动海洋碳循环中的“物理泵”和“生物泵”反馈机制,导致大气中CO2浓度下降,引起全球温度进一步下降。
在这个过程中,有若干负反馈机制同时发生作用。例如,由于陆地和海面温度下降,“普朗克反馈”(Planck feedback)出现,致使地面和大气向外长波辐射减少,抑制地面和大气的降温;伴随水汽含量减少的云量下降,特别是低云量下降,地球行星反射率减小,在一定程度上阻滞温度下降;陆地植被和生态系统退化,导致陆地碳储库的固碳能力减弱,有利于大气中CO2浓度上升,增强温室效应,减弱温度下降速度(图 7)。但是,这些负反馈作用的净效应仍然无法抵消全球地表和大气底层的降温趋势。
在冰期盛期以后,进入冰消期和间冰期阶段,上述地球气候系统分量对外部驱动的响应和影响方向是相反的,其净效应是驱使全球温度快速上升。气候变暖和冰消的启动机制是地球公转轨道偏心率达到下一轮最大,但黄赤交角也接近最大,同时春分点进动致使夏至日出现在公转轨道近日点附近;此时北半球中高纬度地区夏季太阳辐射接近最强,近地面辐射平衡出现较大正值,温度回升,并引发后续地球气候系统分量不同于冰川扩张阶段的快速连锁响应。
关于海洋碳循环的“物理泵”和“生物泵”作用,在轨道尺度上都是正反馈效应。所谓“物理泵”,就是指温度降低(升高)以后,海水更容易(不容易)溶解CO2,导致大气中CO2浓度降低(升高)。冰期海洋表面温度降低以后,CO2更容易溶解在海水里;所谓“生物泵”,是指由于大气粉尘气溶胶沉落在海洋上,特别是在南大洋和北太平洋地区,或其他有助于增加海洋表层营养盐的过程,形成更多的浮游生物,而浮游生物及其海洋生物链高位段生物,吸收固化大气中的CO2后,以碳酸钙形式沉积到海底,致使大气中CO2浓度下降[71, 75, 78]。
大气中水汽含量和粉尘气溶胶含量在冰期-间冰期循环中的作用,迄今可能被大大低估了。水汽是比CO2和CH2更为重要的温室气体,冰期阶段大气水汽含量和降水显著减少,气候干燥,这在各种陆地代用记录中都有反映[79]。大气中水汽含量的这种显著变化,无疑会对全球温度变化起到正反馈作用,促进大气降温或升温。与此同时,极地冰芯记录[79, 93]表明,冰期特别是末次盛冰期(Last Glacial Maximum,简称LGM),大气粉尘含量极高,比全新世高出十几到几十倍,格陵兰甚至高出60~70倍,说明第四纪冰期阶段,地球的大气是非常浑浊的,比间冰期浑浊得多。这一点长期以来被古气候研究者忽视了。冰期浓度极高的大气粉尘气溶胶,有可能主要发生在北半球春夏季,一方面起到阻挡到达地面太阳辐射的“阳伞效应”,另一方面又通过海洋“生物泵”作用影响全球碳循环,降低大气中温室气体浓度,使得全球温度进一步降低。
上述几个反馈机制在千年、万年尺度上都是重要的。在它们的共同作用下,地球轨道参数变化调制下的北半球中高纬度温度和冰川变化信号得以放大、传播,导致全球性的冰期-间冰期循环(图 7)。显然,上述各个分量之间相互作用和反馈的定量描述如何实现,每个分量通过反馈机制对地球气候整体演化趋势的贡献如何,以及各分量在亚轨道或更短时间尺度上是否具有同样的作用,这些问题都值得研究。
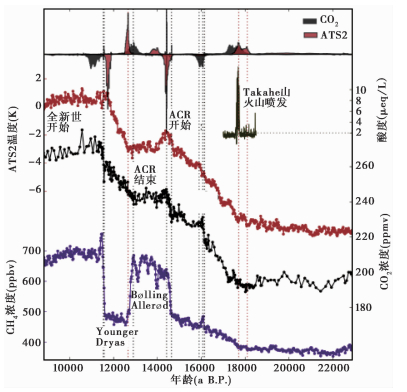
冰期和冰消期发生的系列气候突变也是被长期关注的重要问题,其主要与大陆冰盖(包括相关淡水事件)、海洋环流(包括北大西洋温盐环流)以及温室气体的变化密切相关[94~98]。这些显著气候突变的最后一幕就是所谓的“新仙女木”(Younger Dryas,简称YD)事件,在南极对应的是一个增暖期[87](图 8)。在北大西洋的偏暖时段,例如在Blling Allerd阶段,对应的是南极地区ACR,为南极气候变冷阶段[28]。“新仙女木”事件是指发生在距今1.29~1.16万年期间的北大西洋及其周边地区的冷事件,开始和结束都非常突然[89, 94]。对其解释,一般认为同冰消期北美大陆残留冰盖前端冰成湖动态及北大西洋温盐环流或深层水生成速率变化有关[96~98]。全新世8.2kaB.P.的弱突变,也最清楚地记录于北大西洋周边陆地[99~100],其原因可能同样与北美大陆冰盖消融过程中冰成湖溃决有关[101~103]。在中晚全新世,全球尺度上再无类似幅度的年代到百年尺度气候突变,末次间冰期(13.0~11.6万年前)也没有发现确凿的证据表明存在重大气候突变。因此,现有研究似乎表明,在最近的十几万年,北大西洋地区的气候突变均发生在冰期或冰消期北美、欧洲存有大陆冰盖的条件下。在没有大陆冰盖和残余冰体的间冰期和现代气候变暖期,发生类似YD事件的重大气候突变可能性应该很低[97]。
|
图 8 南极冰芯重建的大气CO2浓度和温度(南极合成温度2,Antarctic Temperature Stack 2,简称ATS2)突变点位置,以及酸度、温度、CO2和CH4序列(自上而下)曲线图(引自文献[87]) 垂直点线为选择的CO2和温度突变点位置,其中黑色代表CO2浓度,褐色代表温度 Fig. 8 Position of change points of CO2 concentration and temperature(Antarctic Temperature Stack 2, or ATS2), and the acidity, temperature, CO2, and CH4 time series(from top to bottom)reconstructed from Antarctic ice-core dada(from Beeman et al. 2019[87]). Vertical dotted lines indicate the positions of the change points for CO2 and temperature, with the black color representing CO2 concentration and brown color representing temperature |
图 8还表明,在亚轨道或更短时间尺度上,在YD事件阶段,以及末次冰期和冰消期其他快速气候变化时期,大气中CO2浓度变化与南极或南半球以及北大西洋地区温度变化并不耦合,但全球大气中CH4浓度仍同北大西洋地区温度变化保持同步[87]。这说明在全球偏冷背景下的百年到千年尺度上,CH4浓度变化与CO2浓度变化的影响因子可能完全不同,也说明YD等寒冷事件,包括格陵兰D-O(Dansgaard-Oeschger)事件的冷位相和北大西洋“海因里奇”(Heinrich)事件,尽管在全球各地皆有表现[104~109],但其显著影响范围可能主要集中于北半球,特别是北大西洋及其周边陆地[95~97]。在这种情况下,北大西洋以外的大部分海洋表面温度可能没有明显下降,或者大陆内部干燥程度和沙尘暴频率没有明显上升,因此海洋在全球碳循环中的“物理泵”和“生物泵”机制未曾开启。
对于亚轨道尺度上北大西洋和南极的冷暖变化反相位关系,以及一般意义上的所谓“双极振动”(Bipolar seesaw),目前有多种解释[110~113]。由于南北半球的反相位变化难以证实存在明显的时间滞迟现象,但对应北大西洋冷事件的南极变暖似乎更为和缓[87],用大西洋温盐环流影响假说来解释可能存在困难;大气环流变化影响或者大气与海洋环流联合作用下的热量全球再调整过程可能是更重要的。由于精确定年的高分辨率代用资料不足,“双极振动”清晰时空图式及其机制,仍有待深入探讨。
5 新生代新生代以来(约6600万年前至今),全球气候呈整体变冷趋势,大气CO2浓度从早始新世的>1000 ppmv下降到工业革命前的约280 ppmv,地球从两极无冰的暖室气候逐步过渡到两极有冰的冰室气候[114]。同时,新生代发生了一系列重大气候环境事件,例如古新世-始新世之交的“极热事件”、始新世-渐新世之交南极大陆冰盖建立、上新世-更新世之交北半球冰盖建立、渐新世-中新世之交亚洲季风气候建立等,现代气候格局逐步形成,这些事件发生可能主要与板块运动(大陆漂移)和温室气体变化密切相关。
发生于古新世-始新世之交(约5500万年前)的“极热事件”(Paleocene-Eocene Thermal Maximum,简称PETM)是一次更长时间尺度上的重大气候突变过程,受到古气候学界广泛关注[115~118]。这个事件持续时期只有20万年左右,发生原因可能是全球大陆坡天然气水合物(CH4)分解释放[119]。当时,海洋沉积物δ18 O比率偏低,指示全球温度异常偏高,可能比今天高6℃甚至更多;δ13 C比率也处于非常大的负值,表明大气中CH4或CO2浓度异常偏高,巨量碳释放到地球表层生态系统和大气中[115];碳酸钙含量很低,说明全球海水酸化严重[120]。因此,在万年到百万年时间尺度上,全球温度和大气中温室气体浓度之间可能也存在紧密耦合关系。由于代用资料分辨率很粗,无从判断该尺度上二者之间确切的位相联系,但一般认为这次事件的起因是某种突发机制导致碳被释放到大气层中,在尚不确定的反馈机制作用下,引起一场全球性异常升温。
在始新世-渐新世之交(约3400万年前的),南极大陆首次发育大规模冰盖,这标志着全球气候开始从暖室向冰室转变[114],南极冰盖的形成可能与德雷克海峡(Drake Passage)打开和大气CO2浓度降低有关[121~122]。一方面,在冈瓦纳古陆最终破碎之后,南塔斯马尼亚(Tasmania)隆起和德雷克海峡开启,导致环南极洋流形成,从而使南极大陆和低纬度隔离开来,来自低纬地带的热量难以输送到南极,加之环南极洋流导致南极周边涌升流形成和发展,南极大陆逐渐降温[122];另一方面,始新世-渐新世之交大气中CO2浓度开始下降,全球及南极高原温度下降,内陆高地形成冰帽,在冰盖-气候反馈机制作用和地球轨道参数变化背景下,冰帽扩张并最终形成大陆冰盖[121]。然而,构造运动和温室气体的相对贡献,以及冰盖-气候的反馈作用[123],仍有待进一步研究。
在北半球,高纬度冰盖起源于大约上新世-更新世之交(约270万年前),但不同区域(如北美和格陵兰)冰盖发展的时间有差异[124]。同时,北半球冰盖发展并进入冰期-间冰期循环模态的驱动机制或构造演化背景尚不完全明确。有研究认为,第四纪初以来大气中CO2浓度降低,可能是一个重要的背景驱动因子[125];上新世巴拿马地峡形成(海道闭合)引起的墨西哥湾暖流加强,可能是另一个地质构造因素[126]。
在新生代全球气候变冷的背景下,亚洲地区最重要的气候环境事件是亚洲季风形成、演化及内陆干旱化过程[127~133]。从始新世到渐新世,亚洲气候为“行星风系主控型”,干燥环境位于亚热带并呈现东西向带状分布,而季风环流(若存在)主要限于低纬地区;在渐新世-中新世之交,亚洲气候转变为“季风环流主控型”,表现为东亚南部和东部为季风湿润气候,而北部和西部为干燥气候,季风环流深入到东亚中高纬地区[134~141]。晚新生代东亚气候演变的驱动因子主要包括青藏高原隆升、特提斯海萎缩和全球气候变冷[137~142]。然而,上述因子并不能全面解释地质记录揭示的晚新生代东亚气候变化过程,并且不同因子的作用可能随时间和气候背景有所改变[142]。
6 总结与展望全新世是最近的1.1万年左右时期,与此前的几十万年比较,这段时间气候是相对稳定的。新的证据表明,全新世可能不存在一个温度高于当前1.0℃以上的持续高温期,但早中全新世是否暖于工业革命前的历史时期,尚无定论[62~64]。最近的2000年,北半球多数地区可能经历过小幅冷暖波动,出现所谓的“中世纪暖期”和“小冰期”[143~144],19世纪中叶以来的全球变暖是在“小冰期”结束过程背景下发生的。近现代全球平均温度明显上升,上升速率和幅度可能已接近过去2000年最大值,但是否超出全新世任何阶段多年代到世纪尺度自然气候变率的范围,仍不确定;然而,预估的人类活动影响下未来百余年升温速率和幅度,很可能将超出其上边界。
在过去的75万年,地球处于第四纪冰期-间冰期循环中,最近40万年的循环周期大约为10万年,此前为4万年左右,全新世间冰期是10万年左右循环的最新一幕。从间冰期末进入冰期盛期,全球温度缓慢下降;但从冰期盛期到间冰期,全球温度快速上升。末次盛冰期出现在大约2万年前,此后直至全新世初为冰消期,全球温度快速上升,冰川消融,北大西洋发生一系列几十年到千年尺度的冷暖事件,其中包括“新仙女木”事件。在大约13.0~11.6万年前的末次间冰期,全球温度可能比现代平均水平高0~2.0℃,是最近几十万年中最暖的间冰期[145~148]。再往前,在具有4万年左右周期的冰期-间冰期旋回中,地球温度波动幅度减小。
第四纪冰期-间冰期循环中,地球气候系统的主要分量发生了显著变化,除了大陆冰盖、陆地植被、海平面和海水酸度改变外,一个明显的演化特征是大气中温室气体浓度在轨道时间尺度上紧随全球温度上下波动[76~78]。CO2浓度在冰期最低,一般在190 ppmv;间冰期最高,可达280 ppmv[76~78]。在近几十万年内,在千年以上尺度上,大气中CO2浓度很可能不是气候演化的外部驱动因素,而是全球气候演化的产物,但可能作为一个重要的气候系统正反馈因子发挥作用。工业革命以来大气中CO2浓度急速上升,目前的平均水平为过去至少70万年内所未见,显然不可能是年代到世纪尺度自然气候变率的产物,而是人类活动影响造成的。冰期-间冰期循环中另一个明显变化特征是,全球大气中水汽含量和粉尘气溶胶含量伴随温度变化发生大幅波动。大气中粉尘含量在间冰期很低,空气洁净,冰期阶段则异常高,空气十分浑浊。水汽和粉尘含量也是千年以上时间尺度地球气候演化的重要正反馈因子,但没有引起足够重视。
在距今1亿年前到300万年前的漫长地质时期,地球温度明显高于第四纪任何千年以上尺度气候期,大部分时间高于今天4.0℃以上[126]。大陆板块的纬度位置和相对位置,以及大气中温室气体浓度变化,可能是导致全球陆地异常温暖以及整个第三纪气候持续变冷、南极大陆冰盖发展的主要驱动因素。
总体来看,在构造尺度上,气候演化可能主要是由于板块运动及与其相关的海陆位置改变、造山运动和碳循环作用产生的;在轨道尺度上,冰期-间冰期气候循环主要是由于地球轨道参数变化引起的,大陆冰盖、海平面、海洋环流、全球碳循环、全球水循环和大气中粉尘含量等气候系统内部反馈作用增大了气候演化趋势和波动幅度;在千年到世纪尺度上,大洋温盐环流、陆地植被、人类活动及其大气中CO2浓度变化可能是气候变化和变率的重要因素;在世纪到多年代时间尺度上,太阳活动、火山活动、海洋环流、人类活动、冰冻圈和陆地植被演化可能控制着全球气候变化和变率步调;工业革命以来的全球气候变暖则主要与人类活动引起的过量温室气体排放有关。在自然条件下,高频气候变率可以看作为低频气候变率背景上的扰动;在现代人为干预条件下,高频气候变率仍然可看作人为气候变化的噪声,但低频气候变率可能与人为气候变化存在复杂的位相锁定关系,在现代气候变化的检测与归因研究中需要给予足够关注。
纵观古今,过去地球气候演化呈现出不同时间尺度上气候系统各分量复杂相互作用的历史画面。以温度为代表的地球表面热力环境演化是近几千万年不同阶段气候变化的基本表现形式。全球温度变化受控于太阳输出辐射、地球轨道参数和地球构造运动(大陆漂移),同时也与地球气候系统内部分量(包括表层水圈中的海洋、冰冻圈中的大陆冰盖、生物圈中的海洋浮游生物和陆地植被,以及大气圈中的温室气体、粉尘气溶胶、水汽和云等活跃组分)的多尺度复杂反馈过程密切相关。在同一时间尺度上,气候系统各分量之间的互馈通路可能是同向的,他们之间的对应关系可能具有相似性、可比性,开展古气候与现代气候变化融合研究,能够做到以古鉴今,将今论古;但在不同时间尺度上,或者在不同边界条件下,气候系统各分量之间对应关系的一致性难以呈现,现在可能不是过去的钥匙,过去也很有可能不是今天的镜子。在不同的时期或不同的时间尺度上,地球气候系统的驱动力和内部相互作用机制可能是迥异的。即使这样,了解过去各种时间尺度和边界条件下的古气候演变特征规律,对于认识现代地球气候系统运行机制、预估未来气候变化趋势,仍具有重要科学意义。
显然,就古气候与现代气候变化融合研究来看,还存在大量未解决的问题,未来需要开展进一步工作。以下列出不同时间尺度上若干科学问题的例子:
历史时期:过去2000年全球平均温度序列重建及其不确定性;中世纪暖期、小冰期全球和中国温度变化幅度及其空间差异;工业革命前全球、北半球和中国本底温度值;近2000年温度变化的驱动机制;树轮、历史文献、石笋等代用资料在重建过去大尺度年平均温度序列上的优势和限制。
全新世:全新世全球平均温度序列重建及其不确定性;过去1万年内任何百年全球和区域气候变暖速率;全新世温度变化的驱动机制;近现代与全新世特征气候期温度时空特征差异;全新世东亚季风演变的特征规律及驱动机制;全新世ENSO(El Niño -Southern Oscillation)的多时间尺度变率及其影响。
轨道尺度:冰期-间冰期循环及轨道驱动理论;南北半球温度和全球大气中CO2的对应关系;末次间冰期以来全球温度、温室气体、冰川、粉尘、水汽、浮游生物、海平面、洋流的变化及其相位关系;冰期-间冰期地球气候系统内部关键反馈过程;冰消期多年代到世纪尺度气候变暖速率及机制;轨道尺度上青藏高原冰川和气候变化事实、机制。
新生代:古新世-始新世PETM大气中CO2浓度与温度的联系;大陆漂移关键节点及其全球气候效应;古特提斯海萎缩和青藏-伊朗高原隆起的大尺度气候效应;全新世和近现代气候变化在过去5500万年地球气候史上的地位。
在每一个时间尺度上,都需进一步提升过去气候演变与现代气候变化的跨尺度交叉融合水平。面向当今和未来地球环境发展趋势,结合现代气候变化关键科学问题,深入开展古气候重建和模拟研究,探索过去地球气候系统多时间尺度运行规律,丰富地球系统科学理论,解决人类面临的地球气候环境难题,为古气候学发展提供了难得的机遇,也是古气候和现代气候学者义不容辞的使命。
致谢: 本文在“气候系统变化的尺度、驱动与反馈:架起古气候与现代气候的桥梁”论坛引导报告内容基础上完成。该论坛得到中国地质大学(武汉)、清华大学、中国科学院大气物理研究所、中国气象局国家气候中心和宁夏回族自治区气象局支持。论坛其他主题报告人和主要参加者包括:罗勇、周天军、郑景云、方修琦、张学斌、李双林、李世杰、陈正洪、陈丽娟、钱诚、陈峰、李跃凤、戴君虎、刘建宝、任宏利、封国林、唐学远、郎咸梅、张晓璐、吕俊梅、姚俊强、尹红、毛炜峄、娄德君、金巍、刘秋锋。张盼峰、温康民、冷杉、田雨润、秦云、任玉玉、毛嬿琳和农丽娟参与论坛组织、会后材料和文献整理。
| [1] |
IPCC. Climate Change 2013:The Physical Science Basis[M]//Stocker T F, Qin D, Plattner G-K, et al. eds. Working Group Ⅰ Contribution to the Fifth Assessment Report of the Intergovernmental Panel on Climate Change. Geneva, Switzerland:World Meteorological Organization, 2013.
|
| [2] |
Sun Xiubao, Ren Guoyu, Xu Wenhui, et al. Global land-surface air temperature change based on the new CMA GLSAT data set[J]. Chinese Science Bulletin, 2017, 62(4): 236-238. |
| [3] |
Li Qingxiang, Sun Wenbin, Huang Baoyin, et al. Consistency of global warming trends strengthened since 1880s[J]. Chinese Science Bulletin, 2020, 65(20): 1709-1712. |
| [4] |
中国气象局气候变化中心. 中国气候变化蓝皮书2019[M]. 北京: 科学出版社, 2020: 100. Center of Climate Change of China Meteorological Administration. Blue Book on Climate Change in China 2019[M]. Beijing: Science Press, 2020: 100. |
| [5] |
Wen Kangmin, Ren Guoyu, Li Jiao, et al. Recent surface air temperature change over mainland China based on an urbanization-bias adjusted dataset[J]. Journal of Climate, 2019, 32: 2691-2705. DOI:10.1175/JCLI-D-18-0395 |
| [6] |
Zhang Panfeng, Ren Guoyu, Qin Yun, et al. Urbanization effect on estimate of global trends in mean and extreme air temperature[J]. Journal of Climate, 2020, 34(5): 1923-1945. DOI:10.1175/JCLI-D-20-0389.1 |
| [7] |
Ren Guoyu, Li Jiao, Ren Yuyu, et al. An integrated procedure to determine a reference station network for evaluating and adjusting urban bias in surface air temperature data[J]. Journal of Applied Meteorology and Climate, 2015, 54(6): 1248-1266. DOI:10.1175/JAMC-D-14-0295.1 |
| [8] |
任国玉, 任玉玉, 李庆祥, 等. 全球陆地表面气温变化研究现状、问题和展望[J]. 地球科学进展, 2014, 29(8): 934-946. Ren Guoyu, Ren Yuyu, Li Qingxiang, et al. An overview on global land surface air temperature change[J]. Advances in Earth Science, 2014, 29(8): 934-946. |
| [9] |
任国玉, 柳艳菊, 孙秀宝, 等. 中国大陆降水时空变异规律:Ⅲ趋势变化原因[J]. 水科学进展, 2016, 27(3): 327-347. Ren Guoyu, Liu Yanju, Sun Xiubao, et al. Spatial and temporal patterns of precipitation variability over mainland China Ⅲ:Causes for recent trends[J]. Advances in Water Science, 2016, 27(3): 327-347. |
| [10] |
Moritz R E, Bitz C M, Steig E J. Dynamics of recent climate change in the Arctic[J]. Science, 2008, 297(5586): 1497-502. |
| [11] |
Baker M B, Roe G H. The shape of things to come:Why is climate change so predictable?[J]. Journal of Climate, 2009, 22(17): 4574-4589. DOI:10.1175/2009JCLI2647.1 |
| [12] |
Flato G, Marotzke J, Abiodun B, et al. Evaluation of climate models[M]//Stocker T F, Qin D, Plattner G-K, et al. eds. Working Group Ⅰ Contribution to the Fifth Assessment Report of the Intergovernmental Panel on Climate Change. Geneva, Switzerland:World Meteorological Organization. 2013.
|
| [13] |
Jones P D, Briffa K R, Osborn T J. Changes in the Northern Hemisphere annual cycle:Implications for paleoclimatology?[J]. Journal of Geophysical Research, 2003, 108(D18): 4588. DOI:10.1029/2003JD003695 |
| [14] |
史锋, 杨保, 冯娟, 等. 利用树轮资料集成重建的过去2000年北半球年平均温度变化[J]. 第四纪研究, 2015, 35(5): 1051-1063. Shi Feng, Yang Bao, Feng Juan, et al. An integrated reconstruction of annual mean temperature variations in the Northern Hemisphere over the past 2000 years using tree-ring data[J]. Quaternary Sciences, 2015, 35(5): 1051-1063. |
| [15] |
PAGES 2k Consortium. Continental-scale temperature variability during the past two millennia[J]. Nature Geoscience, 2013, 6(6): 339-346. |
| [16] |
Moberg A, Sonechkin D M, Holmgren K, et al. Highly variable Northern Hemisphere temperatures reconstructed from low-and high-resolution proxy data[J]. Nature, 2005, 433(7026): 613-617. DOI:10.1038/nature03265 |
| [17] |
Mann M E, Zhang Z, Hughes M K, et al. Proxy-based reconstructions of hemispheric and global surface temperature variations over the past two millennia[J]. Proceedings of the National Academy of Sciences of the United States of America, 2008, 105(36): 13252-13257. DOI:10.1073/pnas.0805721105 |
| [18] |
Mann M E, Zhang Z, Rutherford S, et al. Global signatures and dynamical origins of the Little Ice Age and Medieval Climate Anomaly[J]. Science, 2009, 326(5957): 1256-1260. DOI:10.1126/science.1177303 |
| [19] |
Shi F, Yang B, Mairesse A, et al. Northern Hemisphere temperature reconstruction during the last millennium using multiple annual proxies[J]. Climate Research, 2013, 56(3): 231-244. DOI:10.3354/cr01156 |
| [20] |
Wilson R, Anchukaitis K, Briffa K R, et al. Last millennium Northern Hemisphere summer temperatures from tree rings:Part Ⅰ:The long term context[J]. Quaternary Science Reviews, 2016, 134: 1-18. DOI:10.1016/j.quascirev.2015.12.005 |
| [21] |
杨保, 王鑫, 宋苗, 等. 过去2000年温度集成重建研究:进展与展望[J]. 第四纪研究, 2017, 37(5): 945-962. Yang Bao, Wang Xin, Song Miao, et al. An integrated temperature reconstruction for the past 2000 years:Progress and prospects[J]. Quaternary Sciences, 2017, 37(5): 945-962. |
| [22] |
McGregor H. Regional climate goes global[J]. Nature Geoscience, 2018, 11(1): 18-19. DOI:10.1038/s41561-017-0046-8 |
| [23] |
PAGES 2K Consortium, Neukom R, Barboza L A, et al. Consistent multidecadal variability in global temperature reconstructions and simulations over the Common Era[J]. Nature Geoscience, 2019, 12(8): 643-649. DOI:10.1038/s41561-019-0400-0 |
| [24] |
Ge Q S, Zheng J Y, Fang X Q, et al. Winter half-year temperature reconstruction for the middle and lower reaches of the Yellow River and Yangtze River, China, during the past 2000 years[J]. The Holocene, 2003, 13(6): 933-940. |
| [25] |
郑景云, 葛全胜, 郝志新, 等. 历史文献中的气象记录与气候变化定量重建方法[J]. 第四纪研究, 2014, 34(6): 1186-1196. Zheng Jingyun, Ge Quansheng, Hao Zhixin, et al. Paleoclimatology proxy recorded in historical documents and method for reconstruction on climate change[J]. Quaternary Sciences, 2014, 34(6): 1186-1196. |
| [26] |
Ge Q S, Hao Z X, Zheng J Y, et al. Temperature changes over the past 2000 yr in China and comparison with the Northern Hemisphere[J]. Climate of the Past, 2013, 9(3): 1153-1160. DOI:10.5194/cp-9-1153-2013 |
| [27] |
Shi F, Ge Q S, Yang B, et al. A multi-proxy reconstruction of spatial and temporal variations in Asian summer temperatures over the last millennium[J]. Climatic Change, 2015, 131(4): 663-667. DOI:10.1007/s10584-015-1413-3 |
| [28] |
Zhang H, Werner J P, García-Bustamante E, et al. East Asian warm season temperature variations over the past two millennia[J]. Scientific Reports, 2018, 8(1): 1-11. |
| [29] |
Ge Q S, Zheng J Y, Hao Z X, et al. Recent advances on reconstruction of climate and extreme events in China for the past 2000 years[J]. Journal of Geographical Sciences, 2016, 26(7): 827-854. DOI:10.1007/s11442-016-1301-4 |
| [30] |
Wang J L, Yang B, Osborn T J, et al. Causes of East Asian temperature multidecadal variability since 850 CE[J]. Geophysical Research Letters, 2018, 45(24): 13485-13494. |
| [31] |
Hao Z X, Wu M W, Liu Y, et al. Multi-scale temperature variations and their regional differences in China during the Medieval Climate Anomaly[J]. Journal of Geographical Sciences, 2020, 30(1): 119-130. DOI:10.1007/s11442-020-1718-7 |
| [32] |
Zheng J Y, Liu Y, Hao Z X, et al. Winter temperatures of Southern China reconstructed from phenological cold/warm events recorded in historical documents over the past 500 years[J]. Quaternary International, 2018, 479: 42-47. DOI:10.1016/j.quaint.2017.08.033 |
| [33] |
陈思颖, 苏筠. 《云山日记》记录的太湖流域1308~1309年寒冬[J]. 第四纪研究, 2020, 40(5): 1193-1202. Chen Siying, Su Yun. The severe winter of 1308/1309 in the Taihu Lake Basin recorded in Yunshan Diary[J]. Quaternary Sciences, 2020, 40(5): 1193-1202. |
| [34] |
薛莲花, 赵侃, 崔英方, 等. 近2000年来东亚夏季风突变的落水洞高分辨率石笋记录[J]. 第四纪研究, 2020, 40(4): 973-984. Xue Lianhua, Zhao Kan, Cui Yingfang, et al. Abrupt changes of East Asian summer monsoon over the past two millennia from stalagmite record in Luoshui Cave, Hubei Province[J]. Quaternary Sciences, 2020, 40(4): 973-984. |
| [35] |
范保硕, 张文胜, 张茹春, 等. 华北平原小冰期以来干湿变化与人类活动特征[J]. 第四纪研究, 2019, 39(2): 483-496. Fan Baoshuo, Zhang Wensheng, Zhang Ruchun, et al. Characteristics of dry-wet changes and human activities in the North China Plain since the Little Ice Age[J]. Quaternary Sciences, 2019, 39(2): 483-496. |
| [36] |
Liu X H, Qin D H, Shao X M, et al. Tree-ring based reconstruction of the past 1000 year temperature change over the Qilian Mountains[J]. Science in China (Series D), 2004, 34(1): 89-95. |
| [37] |
Wang J L, Yang B, Qin C, et al. Tree-ring inferred annual mean temperature variations on the southeastern Tibetan Plateau during the last millennium and their relationships with the Atlantic Multidecadal Oscillation[J]. Climate Dynamics, 2014, 43(3): 627-640. DOI:10.1007/s00382-013-1802-0 |
| [38] |
Wang J L, Yang B, Ljungqvist F C. A millennial summer temperature reconstruction for the eastern Tibetan Plateau from tree-ring width[J]. Journal of Climate, 2015, 28(13): 5289-5304. DOI:10.1175/JCLI-D-14-00738.1 |
| [39] |
Huang R, Zhu H F, Liang E Y, et al. A tree ring-based winter temperature reconstruction for the southeastern Tibetan Plateau since 1340 CE[J]. Climate Dynamics, 2019, 53(5): 3221-3233. DOI:10.1007/s00382-019-04695-3 |
| [40] |
Keyimu M, Li Z S, Liu G H, et al. Tree-ring based minimum temperature reconstruction on the southeastern Tibetan Plateau[J]. Quaternary Science Reviews, 2021, 251. DOI:10.1016/j.quascirev.2020.106712 |
| [41] |
初子莹, 任国玉, 邵雪梅, 等. 我国过去近千年地表温度序列的初步重建[J]. 气候与环境研究, 2005, 10(4): 826-836. Chu Ziying, Ren Guoyu, Shao Xuemei, et al. A preliminary reconstruction of mean surface air temperature over the past 1000 years in China[J]. Climatic and Environmental Research, 2005, 10(4): 826-836. |
| [42] |
Wang S W, Wen X Y, Luo Y, et al. Reconstruction of temperature series of China for the last 1000 years[J]. Chinese Science Bulletin, 2007, 52(23): 3272-3280. DOI:10.1007/s11434-007-0425-4 |
| [43] |
Yang B, Braeuning A, Johnson K R, et al. General characteristics of temperature variation in China during the last two millennia[J]. Geophysical Research Letters, 2002, 29(9): 1324. DOI:10.1029/2001GL014485 |
| [44] |
Shi F, Yang B, Von Gunten L. Preliminary multiproxy surface air temperature field reconstruction for China over the past millennium[J]. Science China:Earth Sciences, 2012, 55(12): 2058-2067. DOI:10.1007/s11430-012-4374-7 |
| [45] |
Crowley T J. Causes of climate change over the past 1000 years[J]. Science, 2000, 289(5477): 270-277. DOI:10.1126/science.289.5477.270 |
| [46] |
Miller G H, Geirsdóttir Á, Zhong Y F, et al. Abrupt onset of the Little Ice Age triggered by volcanism and sustained by sea-ice/ocean feedbacks[J]. Geophysical Research Letters, 2012, 39(2): 1-5. |
| [47] |
Berger A L. Long-term variation of daily insolation and Quaternary climatic change[J]. Journal of Atmospheric Science, 1978, 35(12): 2362-2367. DOI:10.1175/1520-0469(1978)035<2362:LTVODI>2.0.CO;2 |
| [48] |
Schmidt G A, Jungclaus J H, Ammann C M, et al. Climate forcing reconstructions for use in PMIP simulations of the last millennium(v1.0)[J]. Geoscientific Model Development, 2011, 4(1): 33-45. DOI:10.5194/gmd-4-33-2011 |
| [49] |
Goosse H, Crespin E, Dubinkina S, et al. The role of forcing and internal dynamics in explaining the Medieval Climate Anomaly[J]. Climate Dynamics, 2012, 39(12): 2847-2866. DOI:10.1007/s00382-012-1297-0 |
| [50] |
Lockwood M, Owens M J. Implications of the recent low solar minimum for the solar wind during the Maunder Minimum[J]. Astrophysical Journal, 2014, 781(1). DOI:10.1088/2041-8205/781/1/L7 |
| [51] |
Jansen E, Overpeck J, Briffa K R, et al. Palaeoclimate[M]//Solomon S, Qin D, Manning M, et al. eds. Climate Change 2007:The Physical Science Basis. Contribution of Working Group Ⅰ to the Fourth Assessment Report of the Intergovernmental Panel on Climate Change. Cambridge, United Kingdom and New York, NY, USA:Cambridge University Press, 2007.
|
| [52] |
王志远, 刘健. 过去2000年全球典型暖期特征与机制的模拟研究[J]. 第四纪研究, 2014, 34(6): 1136-1145. Wang Zhiyuan, Liu Jian. Modeling study on the characteristics and mechanisms of global typical warm periods over the past 2000 years[J]. Quaternary Sciences, 2014, 34(6): 1136-1145. |
| [53] |
Bothe O, Jungclaus J H, Zanchettin D. Consistency of the multi-model CMIP5/PMIP3-past 1000 ensemble[J]. Climate of the Past, 2013, 9(6): 2471-2487. DOI:10.5194/cp-9-2471-2013 |
| [54] |
Yan Q, Zhang Z S, Wang H J, et al. Simulated warm periods of climate over China during the last two millennia:The Sui-Tang warm period versus the Song-Yuan warm period[J]. Journal of Geophysical Research, 2015, 120(6): 2229-2241. |
| [55] |
Zhou X C, Jiang D B, Lang X M. A multi-model analysis of 'Little Ice Age' climate over China[J]. The Holocene, 2019, 29(4): 592-605. DOI:10.1177/0959683618824761 |
| [56] |
Otto-Bliesner B L, Brady E C, Fasullo J, et al. Climate variability and change since 850 CE:An ensemble approach with the Community Earth System Model[J]. Bulletin of the American Meteorological Society, 2016, 97(5): 735-754. DOI:10.1175/BAMS-D-14-00233.1 |
| [57] |
万凌峰, 刘健, 高超超, 等. 全新世火山喷发对温度变化趋势影响的模拟研究[J]. 第四纪研究, 2020, 40(6): 1597-1610. Wan Lingfeng, Liu Jian, Gao Chaochao, et al. Study about influence of the Holocene volcanic eruptions on temperature variation trend by simulation[J]. Quaternary Sciences, 2020, 40(6): 1597-1610. |
| [58] |
Liu J, Wang B, Cane M A, et al. Divergent global precipitation changes induced by natural versus anthropogenic forcing[J]. Nature, 2013, 493(7434): 656-659. DOI:10.1038/nature11784 |
| [59] |
Harvey L D D, Kaufmann R K. Simultaneously constraining climate sensitivity and aerosol radiative forcing[J]. Journal of Climate, 2002, 15(20): 2837-2861. DOI:10.1175/1520-0442(2002)015<2837:SCCSAA>2.0.CO;2 |
| [60] |
方修琦, 侯光良. 中国全新世气温序列的集成重建[J]. 地理科学, 2011, 31(4): 385-393. Fang Xiuqi, Hou Guangliang. Synthetical reconstruction of temperature series of the Holocene in China[J]. Scientia Geographica Sinica, 2011, 31(4): 385-393. |
| [61] |
施雅风, 孔昭宸, 王苏民, 等. 中国全新世大暖期鼎盛阶段的气候与环境[J]. 中国科学(B辑), 1993, 23(8): 865-873. Shi Yafeng, Kong Zhaochen, Wang Sumin. Climate and environment during the maximum of the Holocene Megathermal in China[J]. Science in China(Series B), 1993, 23(8): 865-873. |
| [62] |
Marcott S A, Shakun J D, Clark P U, et al. A reconstruction of regional and global temperature for the past 11, 300 years[J]. Science, 2013, 339(6124): 1198-1201. DOI:10.1126/science.1228026 |
| [63] |
Kaufman D, McKay N, Routson C, et al. A global database of Holocene paleotemperature records[J]. Scientific Data, 2020, 7(1): 183. DOI:10.1038/s41597-020-0515-6 |
| [64] |
Bova S, Rosenthal Y, Liu Z, et al. Seasonal origin of the thermal maxima at the Holocene and the last interglacial[J]. Nature, 2021, 589(7843): 548. DOI:10.1038/s41586-020-03155-x |
| [65] |
Dansgaard W, Johnsen S J, Clausen H B, et al. Evidence for general instability of past climate from a 250-kyr ice-core record[J]. Nature, 1993, 364(6434): 218-220. DOI:10.1038/364218a0 |
| [66] |
Jiang D, Lang X, Tian Z, et al. Considerable model-data mismatch in temperature over China during the mid-Holocene:Results of PMIP simulations[J]. Journal of Climate, 2012, 25(12): 4135-4153. DOI:10.1175/JCLI-D-11-00231.1 |
| [67] |
Liu Z Y, Zhu J, Rosenthal Y, et al. The Holocene temperature conundrum[J]. Proceedings of the National Academy of Sciences of the United States of America, 2014, 111(34): 12280-12281. DOI:10.1073/pnas.ss11134 |
| [68] |
谢成晟, 李景吉, 高苑苑, 等. 基于树轮宽度重建川西南137年秋冬季平均气温变化[J]. 第四纪研究, 2020, 40(1): 252-263. Xie Chengsheng, Li Jingji, Gao Yuanyuan, et al. Tree-ring width based autumn and winter mean temperature reconstruction and its variation over the past 137 years in southwestern Sichuan Province[J]. Quaternary Sciences, 2020, 40(1): 252-263. |
| [69] |
于健, 林万众, 闫伯前, 等. 基于树木年轮重建秦岭太白山1872年以来6-8月最低温度变化[J]. 第四纪研究, 2018, 38(4): 971-980. Yu Jian, Lin Wanzhong, Yan Boqian, et al. Tree-ring reconstruction of June-August mean minimum temperature back to 1872 A.D. in the Qinling Mountains, Northwest China[J]. Quaternary Sciences, 2018, 38(4): 971-980. |
| [70] |
Ruddiman W F. The anthropogenic greenhouse era began thousands of years ago[J]. Climatic Change, 2003, 61(3): 261-293. DOI:10.1023/B:CLIM.0000004577.17928.fa |
| [71] |
Køhler P, Nehrbass-Ahles C, Schmitt J, et al. A 156 kyr smoothed history of the atmospheric greenhouse gases CO2, CH4, and N2O and their radiative forcing[J]. Earth System Science Data, 2017, 9(1): 363-387. DOI:10.5194/essd-9-363-2017 |
| [72] |
Ren G Y. Decline of the mid-to Late Holocene forests in China:Climatic change or human impact?[J]. Journal of Quaternary Science, 2000, 15(3): 273-281. DOI:10.1002/(SICI)1099-1417(200003)15:3<273::AID-JQS504>3.0.CO;2-2 |
| [73] |
NOAA and NASA, 2021. Carbon dioxide latest measurement: January 2021[DB]. https://climate.nasa.gov/vital-signs/carbon-dioxide/.
|
| [74] |
Watanabe O, Jouzel J, Johnsen S J, et al. Homogeneous climate variability across East Antarctica over the past three glacial cycles[J]. Nature, 2003, 422(6931): 509-512. DOI:10.1038/nature01525 |
| [75] |
EPICA Community Members. Augustin L, Barbante C, Barnes P R F. Eight glacial cycles from an Antarctic ice core[J]. Nature, 2004, 429(6992): 623-628. DOI:10.1038/nature02599 |
| [76] |
Jouzel J, Masson-Delmotte V, Cattani O, et al. Orbital and millennial Antarctic climate variability over the past 800, 000 years[J]. Science, 2007, 317(5839): 793-796. DOI:10.1126/science.1141038 |
| [77] |
Wolff E W, Barbante C, Becagli S, et al. Changes in environment over the last 800, 000 years from chemical analysis of the EPICA Dome C ice core[J]. Quaternary Science Reviews, 2010, 29(1): 285-295. |
| [78] |
Lüthi D, Floch M L, Bereiter B, et al. High-resolution carbon dioxide concentration record 650, 000-800, 000 years before present[J]. Nature, 453(7193): 379-382. DOI:10.1038/nature06949 |
| [79] |
Lambert F, Delmonte B, Petit J R, et al. Dust-climate couplings over the past 800, 000 years from the EPICA Dome C ice core[J]. Nature, 2008, 452(7187): 616-619. DOI:10.1038/nature06763 |
| [80] |
Blunier T, Brook E J. Timing of millennial-scale climate change in Antarctica and Greenland during the last glacial period[J]. Science, 2001, 291(5501): 109-112. DOI:10.1126/science.291.5501.109 |
| [81] |
Steffensen J P, Andersen K K, Bigler M, et al. High-resolution Greenland ice core data show abrupt climate change happens in few years[J]. Science, 2008, 321(5889): 680-684. DOI:10.1126/science.1157707 |
| [82] |
Augustin L, Barbante C, Barnes P R F, et al. Eight glacial cycles from an Antarctic ice core[J]. Nature, 2004, 429(6992): 623-628. DOI:10.1038/nature02599 |
| [83] |
Abe-Ouchi A, Saito F, Kawamura K, et al. Insolation-driven 100, 000-year glacial cycles and hysteresis of ice-sheet volume[J]. Nature, 2013, 500(7461): 190-193. DOI:10.1038/nature12374 |
| [84] |
Huybers P. Early Pleistocene glacial cycles and the integrated summer insolation forcing[J]. Science, 2006, 313: 508-511. DOI:10.1126/science.1125249 |
| [85] |
刘植, 黄少鹏. 不同时间尺度下的大气CO2浓度与气候变化[J]. 第四纪研究, 2015, 35(6): 1458-1470. Liu Zhi, Huang Shaopeng. Multiple time scales of variations of atmospheric CO2 concentration and global climate[J]. Quaternary Sciences, 2015, 35(6): 1458-1470. |
| [86] |
Pedro J B, Rasmussen S O, van Ommen T D. Tightened constraints on the timelag between Antarctic temperature and CO2 during the last deglaciation[J]. Climate of the Past, 2012, 8: 1213-1221. DOI:10.5194/cp-8-1213-2012 |
| [87] |
Beeman C, Gest J L, Parrenin F, et al. Antarctic temperature and CO2:Near-synchrony yet variable phasing during the last deglaciation[J]. Climate of the Past, 2019, 15(3): 913-926. DOI:10.5194/cp-15-913-2019 |
| [88] |
Ganopolski A, Roche D M. On the nature of lead-lag relationships during glacial-interglacial climate transitions[J]. Quaternary Science Reviews, 2009, 28(27-28): 3361-3378. DOI:10.1016/j.quascirev.2009.09.019 |
| [89] |
Marcott S A, Bauska T K, Buizert C, et al. Centennial-scale changes in the global carbon cycle during the last deglaciation[J]. Nature, 2014, 514(7524): 616-619. DOI:10.1038/nature13799 |
| [90] |
Ahn J, Brook E J. Atmospheric CO2 and climate on millennial time scales during the last glacial period[J]. Science, 2008, 322(5898): 83-85. DOI:10.1126/science.1160832 |
| [91] |
Berger A. Milankovitch Theory and climate[J]. Reviews of Geophysics, 1988, 26(4): 624-657. DOI:10.1029/rg026i004p00624 |
| [92] |
石正国, 雷婧, 周朋, 等. 轨道尺度亚洲气候演化机理的数值模拟:历史与展望[J]. 第四纪研究, 2020, 40(1): 8-17. Shi Zhengguo, Lei Jing, Zhou Peng, et al. Numerical simulation researches on orbital-scale Asian climate dynamics:History and perspective[J]. Quaternary Sciences, 2020, 40(1): 8-17. |
| [93] |
Biscaye P E, Grousset F E, Revel M, et al. Asian provenance of glacial dust (Stage 2) in the GISP2 ice core, summit, Greenland[J]. Journal of Geophysical Research:Oceans, 1997, 102(C12): 26765-26781. DOI:10.1029/97JC01249 |
| [94] |
Zhang X, Lohmann G, Knorr G, et al. Abrupt glacial climate shifts controlled by ice sheet changes[J]. Nature, 2014, 512(7514): 290-294. DOI:10.1038/nature13592 |
| [95] |
Boers N, Ghil M, Rousseau D D. Ocean circulation, ice shelf, and sea ice interactions explain Dansgaard-Oeschger cycles[J]. Proceedings of the National Academy of Sciences of the United States of America, 115(47): E11005-E11014. DOI:10.1073/pnas.1802573115 |
| [96] |
Henry L G, McManus J F, Curry W B, et al. North Atlantic ocean circulation and abrupt climate change during the last glaciation[J]. Science, 2016, 353(6298): 470-474. DOI:10.1126/science.aaf5529 |
| [97] |
任国玉. 重大气候突变会不会发生?[J]. 气候变化研究进展, 2017, 13(2): 181-184. Ren Guoyu. Will major abrupt changes in climate occur?[J]. Advances in Climate Change Research, 2017, 13(2): 181-184. |
| [98] |
Renssen H, Mairesse A, Goosse H, et al. Multiple causes of the Younger Dryas cold period:New insights from coupled model experiments constrained by data assimilation[J]. Nature Geoscience, 2015, 8(12): 946-949. DOI:10.1038/ngeo2557 |
| [99] |
何鹏, 刘健, 刘斌, 等. 全新世两次典型突变事件下北半球季风降水的变化对比[J]. 第四纪研究, 2019, 39(6): 1372-1383. He Peng, Liu Jian, Liu Bin, et al. Comparison of changes of Northern Hemisphere monsoon precipitation between two typical abrupt climate events in Holocene[J]. Quaternary Sciences, 2019, 39(6): 1372-1383. |
| [100] |
朱少航, 朱立平, 王君波, 等. 西藏玛旁雍错沉积揭示的晚冰期以来环境变化[J]. 第四纪研究, 2019, 39(3): 602-614. Zhu Shaohang, Zhu Liping, Wang Junbo, et al. Environmental changes reflected by core sediments since Late Glacial in Mapam Yumco, southwest Tibet of China[J]. Quaternary Sciences, 2019, 39(3): 602-614. |
| [101] |
Hoffman J S, Carlson A E, Winsor K, et al. Linking the 8.2 ka event and its freshwater forcing in the Labrador Sea[J]. Geophysical Research Letters, 2012, 40(5): 971-971. |
| [102] |
Matero I S O, Gregoire L J, Ivanovic R F, et al. The 8.2 ka cooling event caused by Laurentide ice saddle collapse[J]. Earth and Planetary Science Letters, 2017, 473: 205-214. DOI:10.1016/j.epsl.2017.06.011 |
| [103] |
Wiersma A P, Jongma J I. A role for icebergs in the 8.2 ka climate event[J]. Climate Dynamics, 2010, 35(2): 535-549. |
| [104] |
Cheng H, Zhang H W, Spøtl C, et al. Timing and structure of the Younger Dryas event and its underlying climate dynamics[J]. Proceedings of the National Academy of Sciences of the United States of America, 2020, 117(38): 23408-23417. DOI:10.1073/pnas.2007869117 |
| [105] |
Lea D W, Pak D K, Peterson L C, et al. Synchroneity of tropical and high-latitude Atlantic temperatures over the last glacial termination[J]. Science, 2003, 301(5638): 1361-1364. DOI:10.1126/science.1088470 |
| [106] |
Bakke J, Lie Ø, Heegaard E, et al. Rapid oceanic and atmospheric changes during the Younger Dryas cold period[J]. Nature Geoscience, 2009, 2(3): 202-205. DOI:10.1038/ngeo439 |
| [107] |
蒋庆丰, 金典, 郑佳楠, 等. 末次冰消期以来赛里木湖沉积记录的气候突变[J]. 第四纪研究, 2019, 39(4): 952-963. Jiang Qingfeng, Jin Dian, Zheng Jianan, et al. Abrupt climate events recorded by Sayram Lake sediments since the last deglaciation[J]. Quaternary Sciences, 2019, 39(4): 952-963. |
| [108] |
豆汝席, 邹建军, 石学法, 等. 3万年以来日本海西部海冰活动变化[J]. 第四纪研究, 2020, 40(3): 690-703. Dou Ruxi, Zou Jianjun, Shi Xuefa, et al. Reconstructed changes in sea ice in the western Sea of Japan over the last 30000 years[J]. Quaternary Sciences, 2020, 40(3): 690-703. |
| [109] |
李明坤, 欧阳婷萍, 朱照宇, 等. 南海西北部陆坡H1事件的磁学记录[J]. 第四纪研究, 2019, 39(4): 927-937. Li Mingkun, Ouyang Tingping, Zhu Zhaoyu, et al. Magnetic records of the H1 event in the northwestern South China Sea continental slope[J]. Quaternary Sciences, 2019, 39(4): 927-937. |
| [110] |
Pedro J B, Jochum M, Buizert C, et al. Beyond the bipolar seesaw:Toward a process understanding of interhemispheric coupling[J]. Quaternary Science Reviews, 2018, 192: 27-46. DOI:10.1016/j.quascirev.2018.05.005 |
| [111] |
Stocker T F, Johnsen S J. A minimum thermodynamic model for the bipolar seesaw[J]. Paleoceanography, 2003, 18(4): 1087. DOI:10.1029/2004PA001108 |
| [112] |
Thompson A F, Hines S K, Adkins J F. A southern ocean mechanism for the interhemispheric coupling and phasing of the bipolar seesaw[J]. Journal of Climate, 2019, 32(14): 4347-4365. DOI:10.1175/JCLI-D-18-0621.1 |
| [113] |
Knutti R, Fluckiger J, Stocker T, et al. Strong hemispheric coupling of glacial climate through freshwater discharge and ocean circulation[J]. Nature, 2004, 430(7002): 851-856. DOI:10.1038/nature02786 |
| [114] |
Westerhold T, Marwan N, Drury A J, et al. An astronomically dated record of Earth's climate and its predictability over the last 66 million years[J]. Science, 2020, 369(6509): 1383-1387. DOI:10.1126/science.aba6853 |
| [115] |
McInerney F A, Wing S L. The Paleocene-Eocene Thermal Maximum:A perturbation of carbon cycle, climate, and biosphere with implications for the future[J]. Annual Review of Earth and Planetary Sciences, 2011, 39(1): 489-516. DOI:10.1146/annurev-earth-040610-133431 |
| [116] |
Chen Z L, Dong X X, Wang X, et al. Spatial change of precipitation in response to the Paleocene-Eocene Thermal Maximum warming in China[J]. Global and Planetary Change, 2020, 194. DOI:10.1016/j.gloplacha.2020.103313 |
| [117] |
Inglis G N, Rohrssen M, Kennedy E M, et al. Terrestrial methane cycle perturbations during the onset of the Paleocene-Eocene Thermal Maximum[J]. Geology, 2020. DOI:10.1130/G48110.1 |
| [118] |
Haynes L L, Hønisch B. The seawater carbon inventory at the Paleocene-Eocene Thermal Maximum[J]. Proceedings of the National Academy of Sciences of the United States of America, 2020, 117(39): 24088-24095. DOI:10.1073/pnas.2003197117 |
| [119] |
陈祚伶, 丁仲礼. 古新世"始新世极热"事件研究进展[J]. 第四纪研究, 2011, 31(6): 937-950. Chen Zuoling, Ding Zhongli. A review on the Paleocene-Eocene Thermal Maximum[J]. Quaternary Sciences, 2011, 31(6): 937-950. DOI:10.3969/j.issn.1001-7410.2011.06.01 |
| [120] |
Zachos J C, Røhl U, Schellenberg S A, et al. Rapid acidification of the ocean during the Paleocene-Eocene Thermal Maximum[J]. Science, 2005, 308(5728): 1611-1615. DOI:10.1126/science.1109004 |
| [121] |
DeConto R M, Pollard D. Rapid Cenozoic glaciation of Antarctica induced by declining atmospheric CO2[J]. Nature, 2003, 421(6920): 245-249. DOI:10.1038/nature01290 |
| [122] |
Katz M E, Cramer B S, Toggweiler J R, et al. Impact of Antarctic Circumpolar Current development on Late Paleogene ocean structure[J]. Science, 2011, 332(6033): 1076-1079. DOI:10.1126/science.1202122 |
| [123] |
Goldner A, Herold N, Huber M. Antarctic glaciation caused ocean circulation changes at the Eocene-Oligocene transition[J]. Nature, 2014, 511(7511): 574-577. DOI:10.1038/nature13597 |
| [124] |
Bailey I, Hole G M, Foster G L, et al. An alternative suggestion for the Pliocene onset of major Northern Hemisphere glaciation based on the geochemical provenance of North Atlantic Ocean ice-rafted debris[J]. Quaternary Science Reviews, 2013, 75: 181-194. DOI:10.1016/j.quascirev.2013.06.004 |
| [125] |
Lunt D J, Foster G L, Haywood A M, et al. Late Pliocene Greenland glaciation controlled by a decline in atmospheric CO2 levels[J]. Nature, 2008, 454(7208): 1102-1105. DOI:10.1038/nature07223 |
| [126] |
汪品先, 田军, 黄恩清, 等. 地球系统与演变[M]. 北京: 科学出版社, 2018: 565. Wang Pinxian, Tian Jun, Huang Enqing, et al. Earth System and Evolution[M]. Beijing: Science Press, 2018: 565. |
| [127] |
Guo Z T, Ruddiman W F, Hao Q Z, et al. Onset of Asian desertification by 22 Myr ago inferred from loess deposits in China[J]. Nature, 2002, 416(6877): 159-163. DOI:10.1038/416159a |
| [128] |
Sun X, Wang P. How old is the Asian monsoon system?-Palaeobotanical records from China[J]. Palaeogeography, Palaeoclimatology, Palaeoecology, 2005, 222(3): 181-222. |
| [129] |
Wang P, Clemens S, Beaufort L, et al. Evolution and variability of the Asian monsoon system:State of the art and outstanding issues[J]. Quaternary Science Reviews, 2005, 24(40669): 595-629. |
| [130] |
Guo Z T, Sun B, Zhang Z S, et al. A major reorganization of Asian climate by the Early Miocene[J]. Climate of the Past, 2008, 4(3): 153-174. DOI:10.5194/cp-4-153-2008 |
| [131] |
Ding Z L, Derbyshire E, Yang S L, et al. Stepwise expansion of desert environment across Northern China in the past 3.5 Ma and implications for monsoon evolution[J]. Earth and Planetary Science Letters, 2005, 237(1): 45-55. |
| [132] |
Licht A, van Cappelle M, Abels H A, et al. Asian monsoons in a Late Eocene greenhouse world[J]. Nature, 2014, 513(7519): 501-506. DOI:10.1038/nature13704 |
| [133] |
鹿化煜, 张瀚之, 王逸超, 等. 渭河盆地新生代沉积序列与亚洲季风气候起源演化[J]. 第四纪研究, 2018, 38(5): 1057-1067. Lu Huayu, Zhang Hanzhi, Wang Yichao, et al. Cenozoic sedimentary sequence of Weihe Basin and origin and evolution of Asian monsoon climate[J]. Quaternary Sciences, 2018, 38(5): 1057-1067. |
| [134] |
郭正堂. 22-8 Ma风尘沉积记录的季风演变历史[M]//丁仲礼, 等编著.中国西部环境演化集成研究.北京:气象出版社, 2010:1-19. Guo Zhengtang. Monsoon evolution history recorded in the eolian deposits of 22-8 Ma[M]//Ding Zhongli et al. eds. Study on Environmental Change of Western China. Beijing:China Meteorological Press, 2010:1-19. |
| [135] |
程海, 李瀚瑛, 张旭, 等. 欧-亚-非大陆季风:超级大陆与超级季风的雏形[J]. 第四纪研究, 2020, 40(6): 1381-1396. Cheng Hai, Li Hanying, Zhang Xu, et al. European-Asian-African continent:An early form of supercontinent and supermonsoon[J]. Quaternary Sciences, 2020, 40(6): 1381-1396. |
| [136] |
张肖剑, 靳立亚, Ganopolski Andrey, 等. 3 Ma以来轨道尺度东亚冬季风演化的模拟研究[J]. 第四纪研究, 2020, 40(6): 1406-1417. Zhang Xiaojian, Jin Liya, Ganopolski Andrey, et al. Orbital variations of the East Asian winter monsoon during the past 3 Ma from a transient simulation[J]. Quaternary Sciences, 2020, 40(6): 1406-1417. |
| [137] |
Li J X, Yue L P, Roberts A P, et al. Global cooling and enhanced Eocene Asian mid-latitude interior aridity[J]. Nature Communications, 2018, 9(1): 3026. DOI:10.1038/s41467-018-05415-x |
| [138] |
Lu Huayu, Guo Zhengtang. Evolution of the monsoon and dry climate in East Asia during Late Cenozoic:A review[J]. Science China:Earth Sciences, 2014, 57(1): 70-79. DOI:10.1007/s11430-013-4790-3 |
| [139] |
Zhang Ran, Jiang Dabang, Zhang Zhongshi, et al. The impact of regional uplift of the Tibetan Plateau on the Asian monsoon climate[J]. Palaeogeography, Palaeoclimatology, Palaeoecology, 2015, 417: 137-150. DOI:10.1016/j.palaeo.2014.10.030 |
| [140] |
Liu Xiaodong, Dong Buwen. Influence of the Tibetan Plateau uplift on the Asian monsoon-arid environment evolution[J]. Chinese Science Bulletin, 2013, 58(34): 4277-4291. DOI:10.1007/s11434-013-5987-8 |
| [141] |
An Z S, Kutzbach J E, Prell W L, et al. Evolution of Asian monsoons and phased uplift of the Himalaya-Tibetan Plateau since Late Miocene Times[J]. Nature, 2001, 411(6833): 62-66. DOI:10.1038/35075035 |
| [142] |
Zhang Z S, Wang H J, Guo Z T, et al. Impacts of tectonic changes on the reorganization of the Cenozoic paleoclimatic patterns in China[J]. Earth and Planetary Science Letters, 2007, 257(3): 622-634. |
| [143] |
李宜垠, 李博闻, 徐鑫. 大兴安岭北部满归泥炭孢粉重建的过去2100年古气候[J]. 第四纪研究, 2019, 39(4): 1034-1041. Li Yiyin, Li Bowen, Xu Xin. Pollen-based climate reconstruction during the past 2100 years from the MG peat profile in the northern Daxing'an Mountains[J]. Quaternary Sciences, 2019, 39(4): 1034-1041. |
| [144] |
李康康, 秦小光, 张磊, 等. 罗布泊(楼兰)地区1260-1450 A.期间的绿洲环境和人类活动[J]. 第四纪研究, 2018, 38(3): 720-731. Li Kangkang, Qin Xiaoguang, Zhang Lei, et al. The ancient oasis and human activity in Lop Nur (Loulan) region during 1260-1450 A.D.[J]. Quaternary Sciences, 2018, 38(3): 720-731. |
| [145] |
Turney C S M, Jones R T, McKay N P, et al. A global mean sea-surface temperature dataset for the Last Interglacial(129-116 kyr) and contribution of thermal expansion to sea-level change[J]. Earth System Science Data Discussions, 2020, 12(4): 1-21. |
| [146] |
Hoffman J S, Clark P U, Parnell A C, et al. Regional and global sea-surface temperatures during the last interglaciation[J]. Science, 2017, 355(6322): 276-279. DOI:10.1126/science.aai8464 |
| [147] |
Berger A, Crucifix M, Hodell D A, et al. Interglacials of the last 800, 000 years[J]. Reviews of Geophysics, 2016, 54(1): 162-219. DOI:10.1002/2015RG000482 |
| [148] |
Thomas Z A, Jones R T, Turney C S M, et al. Tipping elements and amplified polar warming during the Last Interglacial[J]. Quaternary Science Reviews, 2020, 233: 106222. DOI:10.1016/j.quascirev.2020.106222 |
2 Laboratory for Climate Studies, National Climate Center, China Meteorological Administration, Beijing 100081;
3 Institute of Atmospheric Physics, Chinese Academy of Sciences, Beijing 100029)
Abstract
How to reconcile the studies of paleo-climatology and modern climate change, and, in particular, how the studies of paleo-climatology contribute to the understanding of modern climate change, are worth thinking about. This review, which is completed based on the keynote speech of the academic forum on "Scales, drivers and feedbacks of climate system change:building bridge between paleoclimate and modern climate" held in Yinchuan, China, in August 2018, makes an attempt to summarize the latest research and thoughts in blending paleo-climatology and global climate change. Starting from the various timescales in the periods of the modern time, history, Holocene, Late Quaternary and Cenozoic, we discuss the facts, causes and mechanisms of the past climate change and variability, and their significances to modern climate change research, and also evaluates the uncertainty in the interdisciplinary study of paleo-climate and modern climate. We conclude that variations of various magnitudes and rates in earth climate occurred in the past, accompanied by the complex interactions among the various components of climate system. The global surface temperature was controlled not merely by the emitted solar radiation, the earth orbital parameters and the earth tectonic movement, but also by the complex interactions and feedbacks among the oceans of the hydrosphere, the ice sheets and snow cover of the cryosphere, the oceanic plankton and terrestrial vegetation of the biosphere, and the active constituents(such as CO2, dust aerosols, moisture and clouds) of the atmosphere. Under the same timescale and boundary condition, the interactions and feedbacks of the components may be similar in mechanism with the comparability of variability between any two variables; under the different timescales or the varied boundary conditions, however, the correspondence of the variabilities between any two components can hardly be found, and caution has to be taken when discussing the role paleoclimatology in understanding modern climate change. We hope that this review can provide some reference for in-depth research of the relative issues in the future. 2021, Vol.41
