2 北京师范大学, 地表过程与资源生态国家重点实验室, 北京 100875;
3 中国气象科学研究院, 青藏高原与极地气象科学研究所, 北京 100081)
北半球环状模(Northern Annular Mode,简称NAM,亦称“北极涛动”)是主导北半球热带外地区的主要大气环流模态,主要表现为北极地区与中纬度地区气压场呈现跷跷板式的变化特征,对北半球热带外地区的气候有十分重要的影响[1~3]。许多研究指出,北半球环状模对中国季风、气温以及西南地区降水有显著影响[4~7]。NAM正位相表现为北极地区低压异常,中纬度为高压异常,西风带向极区移动,而负位相反之。观测数据和模式结果均显示1950年以来NAM指数呈现显著的正位相发展趋势[8~9]。但这种趋势变化的物理机制还存在争议:一些学者认为其主要受人为温室气体排放增加的影响[10~12];也有研究指出这是气候系统的内部变率[13]。然而受限于观测资料的短缺和气候模式的不确定性,对长时间尺度NAM的变化特征和影响的物理机制仍不清楚[14],这对预测未来气候变化造成很大障碍。因此,有必要在更长时间尺度上研究NAM的变化趋势和年代际、多年代际变率,从而更加客观地评估当前NAM变化趋势在历史时期的地位。
基于树轮、冰芯、沉积物等气候代用指标的重建是研究过去千年大尺度气候环流变化的主要依据,目前许多研究多反演NAM的一种区域表现形式——北大西洋涛动(Nothern Atlantic Oscillation,简称NAO)的变化特征,年分辨率的树轮宽度、冰芯稳定同位素和积累率等代用指标已经广泛应用于NAO指数的重建研究中。Luterbacher等[15]首先使用主成分回归(Principle Composite Regression,简称PCR)方法[16]重建了1500年以来的季节NAO指数;另一项研究也使用PCR方法在欧洲重建了覆盖同一时间范围的海平面气压场[15],并发现与Luterbacher等[15]的结果具有较好的一致性;随后Cook等[17]提出了使用嵌套的PCR的方法将年分辨率的NAO指数追溯到公元1400年;D'Arrigo等[18]通过树轮代用指标重建了的1650~1975年的北极涛动指数。之后一段时间关于NAO指数和北极涛动指数的重建工作发展缓慢。直到最近几年,随着气候代用资料的不断增加、完善和数据共享,Ortega等[19]基于48组代用指标和PCR方法进行了从1073~1969年的NAO指数重建。以上研究均基于线性回归模型进行重建,这种古气候重建方法还被广泛应用于其他气候模态指数,例如厄尔尼诺-南方涛动指数[20~21]、北大西洋多年代际变率指数[22~23]和南半球环状模指数[24~25]。然而,由于气候系统是一个复杂的非线性系统,线性模型难以刻画气候要素相互影响的非线性关系,因而重建结果存在较大的不确定性[26]。随着近几年人工智能方法在气候预测研究领域的发展和应用,机器学习方法在计算效率和气候模拟中逐渐凸显优势,并且在重建观测资料缺失信息[27]和NAO指数[28]中也得到应用。如Michel等[28]运用随机森林和弹性网方法重建了过去1000年的NAO指数,并与传统线性模型进行了对比,认为随机森林方法在重建NAO指数的效果优于PCR方法。但是由于不同的机器学习模型对数据数量和质量的要求不同,且对不同问题的学习能力也具有较大差异,其研究结果仍然存在较大的不确定性。又由于机器学习新方法的发展速度又快,因而有必要对目前主流的机器学习模型在古气候重建领域的适用性进行全面的评估,从而为气候要素重建研究的方法选择提供更加科学的依据。本研究拟通过运用传统线性模型、非线性模型和集成学习模型重建过去1000年的NAM指数,研究机器学习方法在古气候重建研究中的适用性,并在此基础上研究千年尺度NAM的演变特征。
1 资料与方法 1.1 北半球环状模指数本文采用年平均的北半球环状模指数(NAMI)作为重建目标,其定义为:

|
(1) |
公式(1)中, 分别是35°N与65°N上标准化的纬向平均海平面气压[29],本研究选取1948~2000年作为重建结果与器测NAM指数对比的标定时段,NAM指数下载地址为http://ljp.gcess.cn/dct/page/65607.
本研究使用最新的PAGES2kv.2.0.0数据库[30] (http://www.ncdc.noaa.gov/paleo/study/21171),是由PAGES2k团队在2014~2017年整编的全球范围内对温度变化敏感的代用指标。包含有树轮、冰芯、湖泊沉积、珊瑚、洞穴石笋、历史文献等692条元数据,长度为52~2000年不等,时间分辨率从两周到百年不等[31~32]。由于全球/半球或区域的温度变化往往与大气环流异常相联系,大量研究发现对于温度敏感的代用指标如树轮宽度和冰芯记录的δ18O也可以很好的反应大尺度环流信息[33],因而也被广泛应用于大尺度环流模态的重建研究中[25, 28]。本研究基于高分辨率、数据连续、时间尺度长、指代意义明确的原则,分四步对代用资料进行筛选和质量控制。第一步,剔除低于年分辨率的代用指标。即使这些代用指标可以被插值到更精细的时间尺度并用于重建,但由于插值的时间序列将呈现高自相关系数,这可能会扩大与NAM的相关性,从而增加它们在最终重建中的权重,潜在地导致虚假结果[34],因此本研究中不使用插值的代用指标时间序列。第二步,检查代用资料,对年际变化很小,趋势很大的指标进行剔除,得到用于重建NAM指数的代用资料集。第三步,考虑到代用资料的定年偏差和周期特性,对代用资料进行特征工程,提取代用指标每一年数据相邻2年内和10年内的均值、方差和标准差特征,构建新的数据特征,这种方法可以最大化的提取代用资料的信息,经过特征工程后的代用资料有408组。第四步,对408组代用资料进行相关性分析,为了保证输入机器学习模型代用指标的数据量,在此我们保留显著性水平小于0.01的代用指标,最后选用的代用资料为54组,来源于22组原始代用资料(空间分布如图 1所示)。

|
图 1 代用指标类型及空间分布 Fig. 1 Map of the proxy records used for the NAM reconstruction |
本研究比较了8种统计模型,其中普通线性回归(Original Linear Regression,简称OR)和主成分回归(Principle Composite Regression,简称PCR)方法已被广泛应用于古气候研究中[15~17],我们增加了近些年在气候预测和环境预报等表现优异和未来极具潜力的机器学习算法模型(岭回归、支持向量回归、随机森林、极端随机树、轻量梯度提升机、CatBoost),旨在探索和优选近些年发展迅速的机器学习方法在古气候研究中的应用。
对于一般的线性回归模型,一方面会包含太多无关的特征导致过拟合,使得模型的复杂度提高,泛化能力较差;另一方面由于实际问题中自变量之间常存在多重共线性,也会导致线性模型产生过拟合的结果。PCR可以去除代用指标间的冗余信息,通过经验正交函数分解提取一组相互独立的主成分,从而建立回归方程,可以解决自变量之间存在多重共线性的问题[35]。岭回归(Ridge)[36~37]也是一种线性回归模型,相比于线性回归增加了正则项,是一种改良的最小二乘估计法,通过放弃最小二乘法的无偏性,以损失部分信息、降低精度为代价获得回归系数更为符合实际、更可靠的回归方法,对病态数据的拟合要强于最小二乘法,可以有效地控制过拟合。
支持向量回归(Support Vector Regression,简称SVR)[38]是支持向量机对回归问题的一种运用,通过最大化间隔带的宽度与最小化总损失来优化模型。在机器学习算法中,决策树由于其计算公式简单、效率高而受到广泛使用,但是单个决策树不稳定、容易产生过拟合的问题,随机森林(Random Forest,简称RF)[39~40]是通过自助采样每一棵决策树的训练样本,避免过拟合的问题,并且训练抽取的随机性增加了各个决策树之间的差异,最终将多个决策树通过集成的方法融合在一起,得到精度较高的综合结果。极端随机树(Extremely Randomized Trees,简称ET)[41]是随机森林算法的一个变种,基本原理与随机森林一样,区别在于ET模型的每个子决策树采用原始数据集训练,并随机选择一个特征值来划分决策树,因而泛化能力比RF更强。
轻量梯度提升机(Light Gradient Boosting Machine,简称LightGBM)[42]和CatBoost[43]都是基于梯度提升决策树(Gradient Boosting Decision Tree,简称GBDT)[44]的集成学习模型。这类模型具有预测精度高、训练速度快、占用内存少等优点。LightGBM是微软基于GBDT框架提出的改进模型,使用基于直方图的分割算法取代了传统的预排序遍历算法,不仅在训练速度和空间效率上均优于GBDT,还能有效防止过拟合,更加适用于训练海量高维数据,已成功运用到能见度预测模型中[45]。CatBoost可以有效处理类别特征,并将其转化为数值特征,该算法的另一优点是使用对称树作为基预测器,该种平衡树可以有效避免过拟合[43]。
1.4 校准和验证本研究采用分段交叉验证和留一交叉验证法对重建模型在统计学上的可靠性进行检验,分段交叉验证是将观测数据分为校准时段和验证时段,校准时段的数据集用来进行建模,验证时段的数据集用来测试模型的效果,在本研究中用1967~2000年作为校准时段,1949~1966年为验证时段。留一交叉验证法是对所有观测数据每次预留其中一个,用于验证基于剩余数据建立的模型的预测能力。在此用到的衡量模型重建效果的统计参数为:相关系数(Relative Coefficient,简称R),均方根误差(Root Mean Square Error,简称RMSE),平均绝对误差(Mean Absolute Error,简称MAE),误差缩减值(Reduction of Error,简称RE)以及纳什效率系数(Nash-Sutcliffe Coefficient of Efficiency,简称NSCE)[46],RMSE和MAE用于评估绝对误差,可以反映预测的极值效应和误差范围值。RE和NSCE是检验气候重建模型稳定性的统计量,其变化范围为(-∞,1),越接近1表示模型效果越好,模型可信度高;接近0时表示模拟结果接近观测值的平均值水平,即总体结果可信,但过程模拟误差大;如果远远小于0,则模型是不可信的[28]。用留一交叉验证法进行检验时,RE和NSCE相等。RMSE、MAE、RE和NSCE的计算公式如下[18~28]:

|
(2) |

|
(3) |

|
(4) |

|
(5) |
其中yi和ŷi是测试时段内的实测值和预测值,yc和yv分别为是校准时段和验证时段实测值的平均值。
1.5 集合经验模态分解本文采用集合经验模态分解法(EEMD)[47]对NAM序列进行时间尺度分解,用以研究NAM的多时间尺度变化特征。EEMD方法是在经验模态分解法(EMD)[48]的基础上加入了白噪声,由于白噪声具有零均值噪声的特性,在多次分解中会被抵消,从而可以克服模态混合的问题。EEMD是一种自适应的时间序列分析技术,在分解非线性、非平稳序列是具有更好的稳定性,适用于大气环流指数的多尺度分解[49~50]。
2 结果与讨论 2.1 不同模型重建结果的对比与评估本研究采用8种不同的统计模型重建了NAM指数过去1000年的时间序列,并对结果进行了比较和分析。我们分别使用留一交叉验证法和分段交叉验证法对各个模型进行统计学检验。结果发现两种验证方法间存在较大差异。具体表现在8种不同模型在留一交叉验证中都表现出较优异性能,但是在分段交叉验证中性能差异显著。因此我们同时考虑两种验证方法用于评估模型重建结果(表 1)。
| 表 1 不同重建方法的统计参数对比 Table 1 Comparison of statistical parameters for different reconstruction methods |
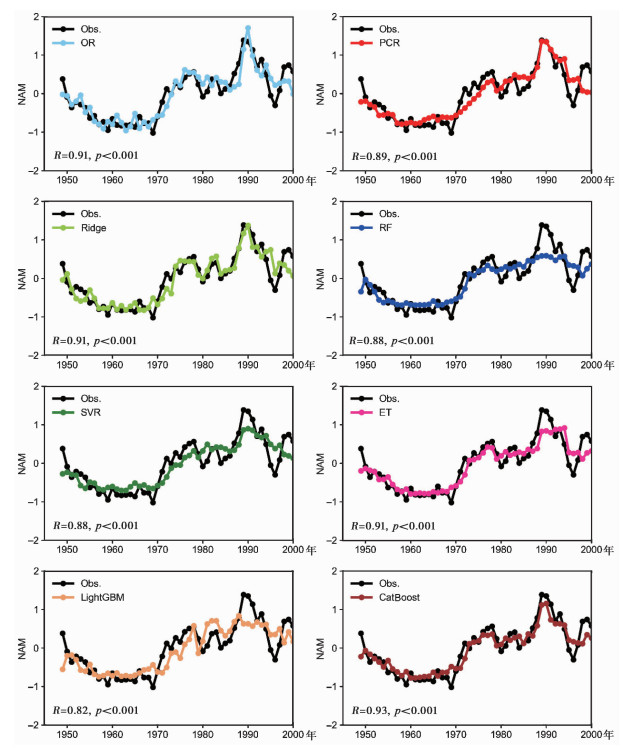
通过对比发现除了OR和RF模型外,其他几种方法均可在一定程度上重建出NAM的变化趋势,在标定时段各重建结果和观测资料的峰谷对应较好(图 2),重建序列与观测值的相关性较高(R≥0.59,p < 0.001),RE和NSCE值均为正,表明重建结果具有一定的可靠性,具有重建意义。所有模型中,CatBoost、ET、PCR这3种模型在两种交叉验证方法中都有很好的效果,在验证时段内R≥0.85、NSCE ≥0.28、RE≥0.9,表明这3种重建模型具有更好的精度,其中CatBoost模型的重建序列在标定时段(1948~2000年)与观测序列的契合度最高,相关系数高达0.93(p < 0.001)。Ridge、SVR、LightGBM这3种模型表现一般,在分段交叉验证中对应的NSCE值分别为0.13、0.07、0.03。OR和RF两种模型的重建效果最差,分段交叉验证中的NSCE值均为负数,表明重建结果较不可信。

|
图 2 不同模型的重建结果与观测序列在标定时间段(1948~2000年)内的比较 其中Obs. 为NAM指数的观测序列 Fig. 2 Comparison of the reconstruction from different models with the observed NAM index over 1948~2000A.D. Obs. is the observed NAM index |
尽管基于留一交叉验证法获得的OR和RF模型的结果在标定时段表现很好,但是由于普通线性回归分析要求各自变量之间相互独立,但实际自变量之间彼此相关,存在多重共线性问题,从而很有可能在回归模型中产生过度拟合的结果,泛化能力较差,因此在分段交叉验证时表现较差。从图 2可以看出,RF和LightGBM对于峰谷的拟合效果较差,CatBoost和Ridge模型对峰谷的拟合最接近于观测值。综合分析模型的可靠性和重建结果,表明CatBoost模型对NAM指数的重建效果最好。
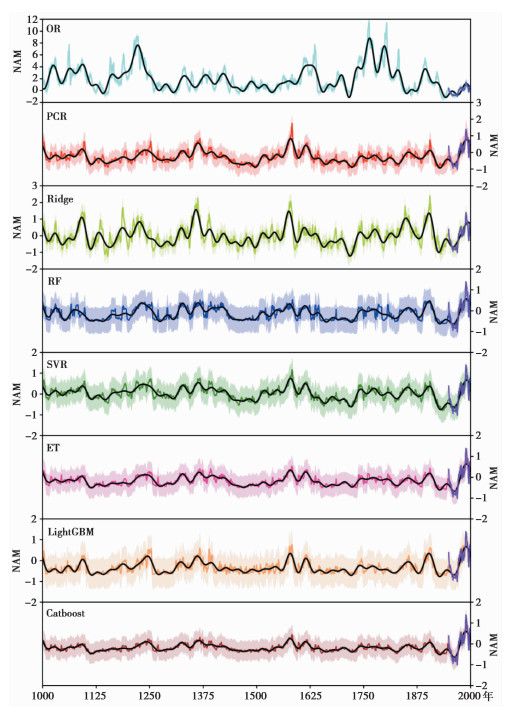
2.2 不同模型的重建结果图 3展示了8种模型重建的公元1000~2000年NAM指数,结果表明线性模型与非线性模型的结果存在明显的差异,表现在线性模型拟合的NAM指数量级比非线性模型高,其中OR模型的重建结果振幅变化非常大,是其他模型的2~3倍。3种线性模型的重建结果差异也较大,OR拟合结果显示NAM在1750~1850年和1200~1250年振幅很大,而PCR和Ridge模型中并未出现。PCR方法和Ridge方法的重建结果在标定时段(1948~2000年)的趋势变化和量级上具有较高的一致性,而在重建时段1000~1947年,Ridge方法比PCR方法重建结果的量级大,年际变化的幅度更大。Ridge模型结果显示,1093年、1187年、1356~1365年、1574~1582年、1847年、1901~1908年等多个时间段内NAM指数的量级均超过了观测数据1990年的峰值,而PCR结果只有在1583年超过了1990年的峰值,这很可能是模型对代用资料极值敏感性不同导致的重建结果差异。

|
图 3 不同模型重建的公元1000~2000年NAM时间序列(彩色实线),紫色实线为1948~2000年NAM观测序列,黑色实线为30年低通滤波序列,阴影为重建序列的不确定范围(±1.96RMSE) Fig. 3 NAM time series from 1000~2000 A.D. reconstructed by different models(coloured solid lines), the purple solid line is the observed series from 1948 A.D. to 2000 A.D. and the black solid lines are the 30-year low pass filtered series for each method. The shading is the uncertainty range(±1.96RMSE) |
其他非线性模型和集成学习模型重建结果的趋势变化与PCR模型具有较好的一致性,但是在峰值和谷值的拟合效果上存在差异。只有SVR模型的重建结果显示在1583年NAM指数的值超过了1990年。从图 2可以看出SVR和LightGBM重建结果的振幅也较大,1900年之前,SVR重建NAM指数的量级最大,LightGBM的量级最小,而RF、ET和CatBoost这3种模型的结果较为一致,重建结果的量级介于SVR和LightBGM之间。
由于不同模型结果之间的差异和不确定性,在后续的分析中,我们将效果最好的CatBoost、ET和PCR组模型的重建结果进行加权平均,以减小重建结果的不确定性,从而进一步分析NAM的演变特征。
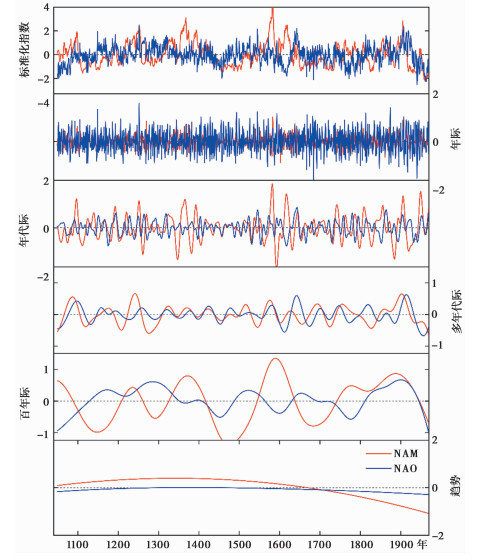
2.3 NAM的多尺度特征分析为进一步研究NAM在过去1000年的多时间尺度变化特征,我们利用EEMD方法对重建的NAM指数进行分解,分别获得9个本征模函数(IMF,见表 2),IMF各分量的振幅大小代表相应周期的强弱程度,IMF9为趋势项。同时,为了研究NAM在不同时间尺度上与NAO的异同,我们对NAO指数也进行了EEMD分解。需要说明的是由于目前还未有年平均的NAO指数重建结果可以与本研究重建的年平均NAM进行更好的对比,在此我们用Ortega等[19]重建的冬季指数作为代替。由于Ortega等[19]重建的NAO指数所涵盖的时间范围为1049~1969年,因而我们只对比这个时间段两者的关系。结果表明,NAM指数具有3.4年、7.3年、18.8年、32.3年、70.8年、167.5年、263.1年和614年的周期,其中167.5年周期方差贡献最大(31.3 %),而NAO指数具有3年、6.7年、13.5年、28.8年、57.6年、131.6年、230.3年和460.5年的周期,其中3年周期的方差贡献最大(34.3 %),这表明NAM和NAO的周期特征有明显的差异性。为进一步分析两个指数在典型时间尺度上的差异,对其各自的IMF分量进行合成重组,得到年际、年代际、多年代际、百年际分量和趋势项(图 4)。结果表明1049~1969年期间,NAM指数呈现先向正位相发展,在13世纪后期转向负位相发展的趋势,而NAO无显著变化趋势。NAM指数的年际变化振幅较NAO小,而年代际和百年际变化的振幅较NAO大,二者的多年代际变化振幅和周期比较一致,在大部分时间段呈现一致的位相转变。计算1049~1969年两个指数在不同时间尺度上的相关系数,只有多年代际分量具有显著相关性(R=0.36,p < 0.01),而其他时间尺度上并无显著相关,表明NAM和NAO两个模态的变化在多年代际尺度上具有较高的一致性,而在其他时间尺度上具有显著差异。这种差异的一部分原因来自于上述比较过程中NAO和NAM指数的季节不匹配,因而关于NAO和NAM指数关系的研究还需要在未来进行更详细的研究。
| 表 2 公元1049~1969年NAM和NAO[19]指数经EEMD分解后IMF分量的周期及贡献率(括号内) Table 2 The IMFs and their variance contributions(in parentheses)of various time-scale components for NAM and for NAO[19] during 1049~1969 A.D. obtained by the EEMD method, respectively |

|
图 4 公元1049~1969年NAM(红色)和NAO指数(蓝色)序列EEMD分解的5个主要时间尺度分量 Fig. 4 Decompositions of NAM(red)and NAO index(blue) during 1049~1969 A.D. into five major time scales determined using the EEMD method |
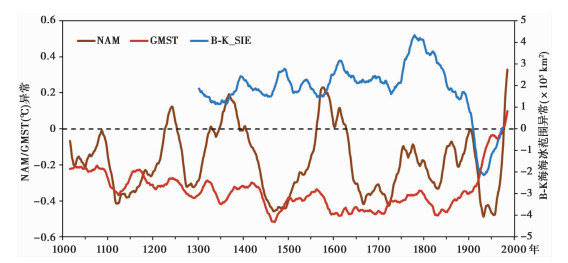
公元1000~2000年NAM指数的重建结果显示,NAM在公元1210~1250年、1350~1390年、1560~1580年、1605~1620年和1975年之后为正位相异常,而在其他时间段内为负位相异常,1950s之后由负位相向正位相转变的增加速率是过去1000年中前所未有的(图 5)。为进一步探讨过去千年NAM的演变机理,我们首先分析NAM与全球平均温度的关系,在此用到的是PAGES 2k重建的全球平均温度序列(Global Mean Surface Temperature,简称GMST)[51]。结果表明,在中世纪气候异常期(一般指800~1300年,本文涉及1000~1300年)[52]表现为随GMST的周期变化而变化,即温度升高NAM增强,温度降低NAM减弱(图 5)。NAM在小冰期(1300~1850年)[52~54]主要表现为负位相,与D'Arrigo等[18]基于树轮重建的1650年以来北极涛动指数的变化一致,同时我们发现NAM在1350~1390年和1560~1580年出现的正位相异常,与GMST在相应时间段出现短时间的增温是对应的。因而,在1850年以前NAM的多年代际变化与温度的周期性变化具有较好的一致性,模式模拟研究表明这很可能是由于北极和中纬度显著的温度差异引起的[55]。

|
图 5 公元1000~2000年北半球环状模(NAM)、全球平均温度(GMST)[51]、巴伦支海-喀拉海海冰范围(B-K_SIE)[58]异常(相比于1961~1990年)序列的31年滑动平均对比 Fig. 5 Comparison of multi-decadal(31-year sliding average)anomalies(compared to 1961~1990 A.D.)of the NAM, Global Mean Temperature(GMST)[51], and sea ice extent in Barents-Kara Sea(B-K_SIE)[58] for 1000~2000 A.D. |
然而,在1850~2000年,NAM并未随着全球平均气温的迅速升高[51]而增强,而是表现为先减弱后增强的变化趋势,在20世纪中期达到负位相最低值,之后显著增强。一些观测和模式模拟研究指出1950年之后NAM正位相增强是由人为温室气体排放造成的[10~12],然而本研究的重建结果表明1950~2000年GMST与NAM均增加,而在1850~1950年之间,NAM的年代际波动特征明显,并不随GMST的升高趋势而增强。近些年有学者提出北极放大(北极变暖幅度大于全球平均)对中高纬度气候有着不可忽视的影响,北极海冰的加速退减使得冬季NAM/NAO向负位相转变[56~58]。为进一步研究北极海冰减少是否对NAM有显著影响,本研究对比Zhang等[59]2018年重建的1289~1993年北极地区巴伦支海-喀拉海(B-K)海冰范围序列发现,1850年之后,NAM的多年代际变率与B-K海冰的变化有很好的一致性,当北极海冰由正异常转为负异常之后,NAM随着海冰范围的减少而持续减弱,直至20世纪中期海冰范围略有回增,NAM开始迅速向正位相发展(图 5)。北极海冰影响NAM的机制是复杂且存在争议的,一部分学者认为海冰减少产生的平稳罗斯贝波响应及其对平流层极涡的调整使得NAM产生负位相的可能性趋于增加[57, 60~63]。Petoukhov和Semenov[64]认为B-K海冰减少与NAM之间很有可能是非线性关系。本文研究发现1850年以前,温度-海冰-NAM的关系在大部分时段内是稳定的,温度很可能是NAM多年代际变率的主要驱动因子,而在海冰发生快速减少之后,温度的影响趋于减弱,而海冰的驱动作用开始显现。
3 结论本研究基于PAGES 2k气候代用资料,评估了不同的机器学习模型在NAM指数重建研究的适用性,成功重建了公元1000~2000年的年平均NAM指数序列,并对千年尺度NAM的趋势和周期特性进行了分析,探讨了其演变规律的可能影响因子。
通过对比8种统计模型的重建结果,我们发现CatBoost、ET和PCR这3种模型在NAM指数重建研究中稳定性较高、可靠性较强,能够更好地拟合观测时段内NAM的变化特征,其中CatBoost模型的重建结果与观测的NAM指数相关性最高(R=0.93,p < 0.001),对峰谷变化的拟合更接近观测值。模型可靠性验证的研究结果表明OR和RF模型虽然在留一法交叉验证时表现较好,但是在分段验证时,校准时段相关系数高而验证时段相关系数极低,有效系数出现负值,这表明模型存在较高的过拟合风险。OR和Ridge线性模型的重建结果振幅变化非常大,易受到代用指标噪声的影响,从而可能产生虚假的估计。此外近年在气象预测领域常用的SVR和LightGBM模型的表现也欠佳,分段检验的NSCE低于0.1,可能与数据量不足有关。因此,在当前古气候代用资料还比较有限的现状下,建议将CatBoost和ET模型作为古气候重建中优先选择的模型。
本研究的重建结果显示NAM具有显著的167.5年百年际周期波动特征和32.3年的多年代际周期波动,1950~2000年NAM由负位相转向正位相的速率在过去1000年中是前所未见的。通过对比过去1000年的NAM指数、GMST、以及B-K海冰范围序列,发现公元1000~1850年之间NAM的多年代际变率与全球平均气温的周期变化有较为一致的对应关系,即暖期NAM偏正位相,冷期NAM偏负位相,然而在1850年之后NAM并没有随着气温的升高出现正位相持续加强的趋势,而是呈现与B-K海冰范围变化一致的趋势和波动异常。结合模式模拟的研究结果,本研究推测1850年之后,北极海冰的变化对NAM的多年代际变率可能产生显著的影响,1950年之后NAM向正位相转变可能是温度和北极海冰异常变化共同影响的结果。
致谢: 感谢审稿专家和编辑部老师提出的意见和修改建议。
| [1] |
Thompson D W, Wallace J M. Annular modes in the extratropical circulation, Part Ⅰ: Month-to-month variability[J]. Journal of Climate, 2000, 13(5): 1000-1016. DOI:10.1175/1520-0442(2000)013<1000:AMITEC>2.0.CO;2 |
| [2] |
龚道溢, 王绍武. 近百年北极涛动对中国冬季气候的影响[J]. 地理学报, 2003, 58(4): 559-568. Gong Daoyi, Wang Shaowu. Influence of Arctic Oscillation on winter climate over China[J]. Acta Geographica Sinica, 2003, 58(4): 559-568. DOI:10.3321/j.issn:0375-5444.2003.04.010 |
| [3] |
尹姗, 冯娟, 李建平. 前冬北半球环状模对春季中国东部北方地区极端低温的影响[J]. 气象学报, 2013, 71(1): 96-108. Yin Shan, Feng Juan, Li Jianping. Influences of preceding winter Northern Hemisphere annular mode on the spring extreme low temperature events in the north of Eastern China[J]. Acta Meteorologica Sinica, 2013, 71(1): 96-108. |
| [4] |
Gong D Y, Wang S W, Zhu J H. East Asian winter monsoon and Arctic Oscillation[J]. Geophysical Research Letters, 2001, 28(10): 2073-2076. DOI:10.1029/2000GL012311 |
| [5] |
龚道溢, 王绍武, 朱锦红. 北极涛动对我国冬季日气温方差的显著影响[J]. 科学通报, 2004, 49(5): 487-492. Gong Daoyi, Wang Shaowu, Zhu Jinhong. Arctic Oscillation influence on daily temperature variance in winter over China[J]. Chinese Science Bulletin, 2004, 49(6): 637-642. |
| [6] |
徐寒列, 李建平, 冯娟, 等. 冬季北大西洋涛动与中国西南地区降水的不对称性关系[J]. 气象学报, 2012, 70(6): 1276-1291. Xu Hanlie, Li Jianping, Feng Juan, et al. The asymmetric relationship between the winter NAO and the precipitation in Southwest China[J]. Acta Meteorology Sinica, 2012, 70(6): 1276-1291. |
| [7] |
Liu L, Zhou T, Ning L, et al. Linkage between the Arctic Oscillation and summer climate extreme events over the middle reaches of Yangtze River Valley[J]. Climate Research, 2019, 78(3): 237-247. DOI:10.3354/cr01542 |
| [8] |
Feldstein S B. The recent trend and variance increase of the annular mode[J]. Journal of Climate, 2002, 15(1): 88-94. DOI:10.1175/1520-0442(2002)015<0088:TRTAVI>2.0.CO;2 |
| [9] |
朱献, 董文杰, 郭彦. CMIP3及CMIP5模式对冬季和春季北极涛动变率模拟的比较[J]. 气候变化研究进展, 2013, 9(3): 165-172. Zhu Xian, Dong Wenjie, Guo Yan. Comparison of simulated winter and spring Arctic Oscillation variability by CMIP5 and CMIP3 coupled models[J]. Progressus Inquisitiones De Mutatione Climatis, 2013, 9(3): 165-172. DOI:10.3969/j.issn.1673-1719.2013.03.002 |
| [10] |
Gillett N P, Allen M R, Williams K D. Modelling the atmospheric response to doubled CO2 and depleted stratospheric ozone using a stratosphere-resolving coupled GCM[J]. Quarterly Journal of the Royal Meteorological Society, 2003, 129(589): 947-966. DOI:10.1256/qj.02.102 |
| [11] |
Yukimoto S. Interdecadal Arctic Oscillation in twentieth century climate simulations viewed as internal variability and response to external forcing[J]. Geophysical Research Letters, 2005, 32(3). DOI:10.1029/2004gl021870 |
| [12] |
Miller R L, Schmidt G A, Shindell D T. Forced annular variations in the 20th century Intergovernmental Panel on Climate Change Fourth Assessment Report models[J]. Journal of Geophysical Research, 2006, 111(D18). DOI:10.1029/2005jd006323 |
| [13] |
Osborn T J, Briffa K R, Tett S F B, et al. Evaluation of the north atlantic Oscillation as simulated by a coupled climate model[J]. Climate Dynamics, 1999, 15(9): 685-702. DOI:10.1007/s003820050310 |
| [14] |
Gómez-Navarro J J, Zorita E. Atmospheric annular modes in simulations over the past millennium: No long-term response to external forcing[J]. Geophysical Research Letters, 2013, 40(12): 3232-3236. DOI:10.1002/grl.50628 |
| [15] |
Luterbacher J, Rickli R, Xoplaki E, et al. The Late Maunder Minimum(1675-1715)-A key period for studying decadal scale climatic change in Europe[J]. Climatic Change, 2001, 49(4): 441-462. DOI:10.1023/A:1010667524422 |
| [16] |
Hotelling H. The relations of the newer multivariate statistical methods to factor analysis[J]. British Journal of Statistical Psychology, 1957, 10(2): 69-76. DOI:10.1111/j.2044-8317.1957.tb00179.x |
| [17] |
Cook E R, D'Arrigo R D, Mann M E. A well-verified, multiproxy reconstruction of the winter North Atlantic Oscillation index since AD 1400[J]. Journal of Climate, 2002, 15(13): 1754-1764. DOI:10.1175/1520-0442(2002)015<1754:AWVMRO>2.0.CO;2 |
| [18] |
D'Arrigo R D, Cook E R, Mann M E, et al. Tree-ring reconstructions of temperature and sea-level pressure variability associated with the warm-season Arctic Oscillation since AD 1650[J]. Geophysical Research Letters, 2003, 30(11). DOI:10.1029/2003gl017250 |
| [19] |
Ortega P, Lehner F, Swingedouw D, et al. A model-tested North Atlantic Oscillation reconstruction for the past millennium[J]. Nature, 2015, 523(7558): 71-74. DOI:10.1038/nature14518 |
| [20] |
Li J, Xie S-P, Cook E R, et al. El Niño modulations over the past seven centuries[J]. Nature Climate Change, 2013, 3(9): 822-826. DOI:10.1038/nclimate1936 |
| [21] |
彭友兵, 程海, 陈凯, 等. 过去千年中国东部持续性严重干旱事件的模拟研究[J]. 第四纪研究, 2019, 39(2): 282-293. Peng Youbing, Cheng Hai, Chen Kai, et al. Modeling study of severe persistent drought events over Eastern China during the last millennium[J]. Quaternary Sciences, 2019, 39(2): 282-293. |
| [22] |
Gray S T, Graumlich L J, Betancourt J L, et al. A tree-ring based reconstruction of the Atlantic Multidecadal Oscillation since 1567 A.D[J]. Geophysical Research Letters, 2004, 31(12). DOI:10.1029/2004gl019932 |
| [23] |
Wang J, Yang B, Ljungqvist F C, et al. Internal and external forcing of multidecadal Atlantic climate variability over the past 1, 200 years[J]. Nature Geoscience, 2017, 10(7): 512-517. DOI:10.1038/ngeo2962 |
| [24] |
Abram N J, Mulvaney R, Vimeux F, et al. Evolution of the Southern Annular Mode during the past millennium[J]. Nature Climate Change, 2014, 4(7): 564-569. DOI:10.1038/nclimate2235 |
| [25] |
Yang J, Xiao C. The evolution and volcanic forcing of the southern annular mode during the past 300 years[J]. International Journal of Climatology, 2018, 38(4): 1706-1717. DOI:10.1002/joc.5290 |
| [26] |
McShane B B, Wyner A J. A statistical analysis of multiple temperature proxies: Are reconstructions of surface temperatures over the last 1000 years reliable?[J]. The Annals of Applied Statistics, 2011, 5(1): 5-44. |
| [27] |
Kadow C, Hall D M, Ulbrich U. Artificial intelligence reconstructs missing climate information[J]. Nature Geoscience, 2020, 13(6): 408-413. DOI:10.1038/s41561-020-0582-5 |
| [28] |
Michel S, Swingedouw D, Chavent M, et al. Reconstructing climatic modes of variability from proxy records using ClimIndRec version 1.0[J]. Geoscientific Model Development, 2020, 13(2): 841-858. DOI:10.5194/gmd-13-841-2020 |
| [29] |
Li J, Wang J X L. A modified zonal index and its physical sense[J]. Geophysical Research Letters, 2003, 30(12). DOI:10.1029/2003gl017441 |
| [30] |
PAGES2k Consortium. A global multiproxy database for temperature reconstructions of the Common Era[J]. Scientific Data, 2017, 4. DOI:10.1038/sdata.2017.88 |
| [31] |
郑景云, 刘洋, 郝志新, 等. 过去2000年气候变化的全球集成研究进展与展望[J]. 第四纪研究, 2021, 41(2): 309-322. Zheng Jingyun, Liu Yang, Hao Zhixin, et al. State-of-art and perspective on global synthesis studies of climate change for the past 2000 yeas[J]. Quaternary Sciences, 2021, 41(2): 309-322. |
| [32] |
杨保, 王鑫, 宋苗, 等. 过去2000年温度集成重建研究: 进展与展望[J]. 第四纪研究, 2017, 37(5): 945-962. Yang Bao, Wang Xin, Song Miao, et al. Temperature reconstructions of last millennium and Common Era climate variations: Present status and future prospects[J]. Quaternary Sciences, 2017, 37(5): 945-962. |
| [33] |
Leavitt S W, Treydte K, Liu Y. Environment in time and space: Opportunities from tree-ring isotope networks[M]//West J B, Bowen G J, Dawson T E, et al. eds. Isoscapes: Understanding Movement, Pattern, and Process on Earth through Isotope Mapping. Dordrecht: Springer, 2010: 113-115.
|
| [34] |
Hanhijälrvi S, Tingley M P, Korhola A. Pairwise comparisons to reconstruct mean temperature in the Arctic Atlantic region over the last 2, 000 years[J]. Climate Dynamics, 2013, 41(7-8): 2039-2060. DOI:10.1007/s00382-013-1701-4 |
| [35] |
Preisendorfer R W. Principal component analysis in meteorology and oceanography[M]//Mobley C D ed. Developments in Atmospheric Sciences. Amsterdam: Elsevier Science Publishers, 1988: 402-418.
|
| [36] |
Hoerl A E, Kennard R W. Ridge regression: Biased estimation for nonorthogonal problems[J]. Technometrics, 1970, 12(1): 55-67. DOI:10.1080/00401706.1970.10488634 |
| [37] |
Chen S, Xiong L, Ma Q, et al. Improving daily spatial precipitation estimates by merging gauge observation with multiple satellite-based precipitation products based on the geographically weighted ridge regression method[J]. Journal of Hydrology, 2020, 589: 125156. DOI:10.1016/j.jhydrol.2020.125156 |
| [38] |
Fan J, Wang X, Zhang F, et al. Predicting daily diffuse horizontal solar radiation in various climatic regions of China using support vector machine and tree-based soft computing models with local and extrinsic climatic data[J]. Journal of Cleaner Production, 2020, 248: 119264. DOI:10.1016/j.jclepro.2019.119264 |
| [39] |
李娟, 尉鹏, 戴学之, 等. 基于机器学习方法的西安市数值模拟优化研究[J]. 环境科学研究, 2020. Li Juan, Wei Peng, Dai Xuezhi, et al. Optimization of Numerical Simulation in Xi'an Based on Machine Learning Methods[J]. Research of Environmental Sciences, 2020. DOI:10.13198/j.issn.1001-6929.2020.10.27 |
| [40] |
Breiman L. Random forests[J]. Machine Learning, 2001, 45(1): 5-32. DOI:10.1023/A:1010933404324 |
| [41] |
Geurts P, Ernst D, Wehenkel L. Extremely randomized trees[J]. Machine Learning, 2006, 63(1): 3-42. DOI:10.1007/s10994-006-6226-1 |
| [42] |
Ke G, Meng Q, Finley T, et al. LightGBM: A highly efficient gradient boosting decision tree[J]. Advances in Neural Information Processing Systems, 2017, 30: 3146-3154. |
| [43] |
Dorogush A V, Ershov V, Gulin A. CatBoost: Gradient boosting with categorical features support[J]. ArXiv Preprint ArXiv, 2018, 1810: 11363. |
| [44] |
Friedman J H. Greedy function approximation: A gradient boosting machine[J]. Annals of Statistics, 2001. |
| [45] |
余东昌, 赵文芳, 聂凯, 等. 基于LightGBM算法的能见度预测模型[J]. 计算机应用, 2021. Yu Dongchang, Zhao Wenfang, Nie Kai, et al. Visibility prediction model based on LightGBM algorithm[J]. Journal of Computer Applications, 2021. DOI:10.11772/j.issn.1001-9081.2020081589 |
| [46] |
Nash J E, Sutcliffe J V. River flow forecasting through conceptual models, Part Ⅰ-A discussion of principles[J]. Journal of Hydrology, 1970, 10(3): 282-290. DOI:10.1016/0022-1694(70)90255-6 |
| [47] |
Wu Z, Huang N E. Ensemble empirical mode decomposition: A noise-assisted data analysis method[J]. Advances in Adaptive Data Analysis, 2009, 1(1): 1-41. DOI:10.1142/S1793536909000047 |
| [48] |
Huang N E, Shen Z, Long S R, et al. The empirical mode decomposition and the Hilbert spectrum for nonlinear and non-stationary time series analysis[J]. Proceedings of the Royal Society of London, 1998, 454: 903-995. DOI:10.1098/rspa.1998.0193 |
| [49] |
Qian C, Zhou T. Multidecadal variability of North China aridity and its relationship to PDO during 1900-2010[J]. Journal of Climate, 2014, 27(3): 1210-1222. DOI:10.1175/JCLI-D-13-00235.1 |
| [50] |
王志远, 王江林, 张诗茄, 等. 不同时间尺度影响下的北半球夏季风空间特征及其可能影响机制[J]. 第四纪研究, 2018, 38(6): 1494-1506. Wang Zhiyuan, Wang Jianglin, Zhang Shijia, et al. Impact of different timescales on the characteristics and mechanisms of the Northern Hemisphere summer monsoon: Based on the CESM results[J]. Quaternary Sciences, 2018, 38(6): 1494-1506. |
| [51] |
PAGES2k Consortium. Consistent multi-decadal variability in global temperature reconstructions and simulations over the Common Era[J]. Nature Geoscience, 2019, 12(8): 643-649. DOI:10.1038/s41561-019-0400-0 |
| [52] |
薛莲花, 赵侃, 崔英方, 等. 近2000年来东亚夏季风突变的落水洞高分辨率石笋记录[J]. 第四纪研究, 2020, 40(4): 973-984. Xue Lianhua, Zhao Kan, Cui Yingfang, et al. Abrupt changes of East Asian summer monsoon over the past two millennia from stalagmite record in Luoshui Cave, Hubei Province[J]. Quaternary Sciences, 2020, 40(4): 973-984. |
| [53] |
史锋, 杨保, 冯娟, 等. 利用树轮资料集成重建的过去2000年北半球年平均温度变化[J]. 第四纪研究, 2015, 35(5): 1051-1063. Shi Feng, Yang Bao, Feng Juan, et al. Reconstruction of the Northern Hemisphere annual temperature change over the Common Era derived from tree rings[J]. Quaternary Sciences, 2015, 35(5): 1051-1063. |
| [54] |
王健, 程海, 赵景耀, 等. 小冰期多尺度气候波动: 贵州董哥洞高分辨率石笋记录[J]. 第四纪研究, 2019, 39(3): 775-785. Wang Jian, Cheng Hai, Zhao Jingyao, et al. Climate variability during the Little Ice Age characterized by a high resolution stalagmite record from Dongge Cave, Guizhou[J]. Quaternary Sciences, 2019, 39(3): 775-785. |
| [55] |
陈可凡, 宁亮, 孙炜毅, 等. 基于PMIP3和CMIP5模拟结果的过去千年特征时段北极涛动的变率特征及成因分析[J]. 气候与环境研究, 2020, 25(4): 429-442. Chen Kefan, Ning Liang, Sun Weiyi, et al. Characteristics and cause analyses of arctic oscillation variability during the typical periods in last millennium based on PMIP3 and CMIP5 Simulations[J]. Climatic and Environmental Research, 2020, 25(4): 429-442. |
| [56] |
Cohen J, Screen J A, Furtado J C, et al. Recent Arctic amplification and extreme mid-latitude weather[J]. Nature Geoscience, 2014, 7(9): 627-637. DOI:10.1038/ngeo2234 |
| [57] |
Nakamura T, Yamazaki K, Iwamoto K, et al. A negative phase shift of the winter AO/NAO due to the recent Arctic sea-ice reduction in late autumn[J]. Journal of Geophysical Research: Atmospheres, 2015, 120(8): 3209-3227. DOI:10.1002/2014JD022848 |
| [58] |
Cohen J, Zhang X, Francis J, et al. Divergent consensuses on Arctic amplification influence on midlatitude severe winter weather[J]. Nature Climate Change, 2019, 10(1): 20-29. |
| [59] |
Zhang Q, Xiao C, Ding M, et al. Reconstruction of autumn sea ice extent changes since AD 1289 in the Barents-Kara Sea, Arctic[J]. Science China: Earth Sciences, 2018, 61(9): 1279-1291. DOI:10.1007/s11430-017-9196-4 |
| [60] |
Francis J A, Chan W, Leathers D J, et al. Winter Northern Hemisphere weather patterns remember summer Arctic sea-ice extent[J]. Geophysical Research Letters, 2009, 36(7). DOI:10.1029/2009gl037274 |
| [61] |
Honda M, Inoue J, Yamane S. Influence of low Arctic sea-ice minima on anomalously cold Eurasian winters[J]. Geophysical Research Letters, 2009, 36(8). DOI:10.1029/2008gl037079 |
| [62] |
Liu J, Curry J A, Wang H, et al. Impact of declining Arctic sea ice on winter snowfall[J]. Proceedings of the National Academy of Sciences of the United States of America, 2012, 109(11): 4074-4079. DOI:10.1073/pnas.1114910109 |
| [63] |
Tang Q, Zhang X, Yang X, et al. Cold winter extremes in northern continents linked to Arctic sea ice loss[J]. Environmental Research Letters, 2013, 8(1). DOI:10.1088/1748-9326/8/1/014036 |
| [64] |
Petoukhov V, Semenov V A. A link between reduced Barents-Kara sea ice and cold winter extremes over northern continents[J]. Journal of Geophysical Research, 2010, 115(D21). DOI:10.1029/2009JD013568 |
2 State Key Laboratory of Earth Surface Processes and Resource Ecology, Beijing Normal University, Beijing 100875;
3 Institute of Tibetan Plateau and Polar Meteorology, Chinese Academy of Meteorological Sciences, Beijing 100081)
Abstract
As the dominant mode of the atmospheric circulation in the Northern Hemisphere(NH), the Northern Annular Mode(NAM) makes important influences on both NH and global climate change. The knowledge of the NAM is limited by the lack of the observed data. The reconstruction of long-term changes of the NAM using proxies such as tree rings, ice cores and sediments can help us understanding the long-term characters and mechanisms of NAM.In this study, we compare eight reconstruction models, including Original Linear Regression(OR), Principle Composite Regression(PCR), Ridge, Support Vector Regression(SVR), Random Forest(RF), Extremely Randomized Trees(ET), Light Gradient Boosting Machine(LightGBM) and CatBoost, to estimate their applicability in NAM reconstruction. And further reconstruct the annual NAM index for the past 1000 years based on the climate proxies obtained from PAGES2k. By removing missing and anomalous data, 54 proxies(obtained from 22 tree ring and lake sediment records) can be used for NAM reconstruction were selected after filtering by feature engineering and correlation analysis. Compared with the OR and RF methods, the results show that the CatBoost, ET and PCR model can effectively avoid overfitting problems and better reconstruct the variability of the NAM over the instrumental period (1948~2000). The CatBoost reconstruction has the highest correlation coefficient(R=0.93, p < 0.01) with the NAM index over the instrumental period and is able to better fit the magnitude and peak-to-valley variability of the NAM index. Even the reconstruction series of the OR and RF are significantly correlated with the instrumental NAM index from 1948 A.D. to 2000 A.D., the results of the cross validation show the high correlation in the calibration period (1967~2000) and very low correlation in the validation period(1949~2000), and the Nash-Sutcliffe coefficient of efficiency(NSCE) are both negative in validation period. This suggests there is a high risk of overfitting when use the two models. The reconstructions of OR and Ridge are highly variable in amplitude because of the high sensitivity to noises in proxies, which may produce spurious estimates. The reconstructions of SVR and LightGBM, which their NSCE are lower than 0.1 in validation period, are also less reliable because of the high sensitivity to the noise of proxies or the insufficient amount of data. We recommend the CatBoost and ET as the preferred machine learning models for paleoclimate reconstruction.The ensemble empirical mode decomposition(EEMD) is used to decompose of the NAM series during the past 1000 years to obtain its multi-scales characters and nonlinear trends. The results suggest that the NAM has a significant centennial(167.5 a) and multidecadal(32.3 a) oscillations. The positive shift of NAM from 1950 A.D. to 2000 A.D. is unprecedented in the past 1000 years. We further found that prior to 1850 A.D., the multi-decadal variability of NAM was mainly influenced by the global mean temperature, with warm periods corresponding to an enhanced NAM and cold periods corresponding to a weakened NAM. While after 1850A.D., the multi-decadal changes of NAM tend to coincide with sea ice extent in the Barents-Kara Sea. We infer that rapid shift of the NAM towards a positive phase occurred after 1950s is probably influenced by the combined effect of the anomalies in both temperature and Arctic sea ice. 2021, Vol.41

