 2021, Vol.41


2 江苏省大规模复杂系统数值模拟重点实验室, 南京师范大学数学科学学院, 江苏 南京 210023;
3 青岛海洋科学与技术试点国家实验室海洋-气候-同位素模拟开放工作室, 山东 青岛 266237)
季风降水,特别是北半球季风降水影响全球超过70 % 的人口[1],为当地的农业和生态系统提供大部分水资源,同时季风降水也是重要的潜热来源[2]。因此,理解北半球季风的变化特点对于季风区国家的基础设施建设、粮食安全和防灾减灾等都至关重要[3]。
近年来,专家学者致力于研究北半球季风降水在全球变暖下的变化趋势。近30年来,北半球季风降水强度增强[4],呈现“干区更干,湿区更湿”的变化趋势[5~6]。政府间气候变化专门委员会的第五次评估报告也指出,20世纪以来,北半球季风区的面积、季风降水的强度[7~9]以及持续时间显著增加[10]。对于其物理机制,前人发现气候系统内部变率(如PDO等)有很大的影响[11~14]。此外大气变暖引起大气湿度增加是导致北半球季风降水增加最有效的驱动因素[15~16],南北半球的海温差异也是导致北半球季风降水增多的重要因素[17~18]。耦合模式比较计划第五、六阶段(Coupled Model Intercomparison Project 5、6,简称CMIP5、CMIP6)的大部分气候模式都模拟出人类活动引起的温室气体排放增多会导致北半球季风降水的显著增强[3, 7, 10]。
然而,根据现有的几十年气候观测资料,并不能完全刻画北半球季风降水自1850年以来的整体变化特点,更无法区分人为、自然外强迫的作用及其物理机制[4]。因此,要理解现代暖期北半球季风降水变化的特点,应把其放在更长的时间尺度上进行研究并且与历史上的典型暖期进行对比分析。过去2000年是理解现代暖期北半球季风降水变化的一个重要时段[19~20],这一时段可以为现代暖期的研究提供历史相似型[21~22],例如罗马暖期和中世纪气候异常期,这也是科学的理解过去、认识现代和预测未来必备的基础性时段[23]。
北半球具有大量过去千年典型暖期季风降水的重建记录[24~28]。研究人员通过石笋[27~32]、冰芯[33]、树轮[34]、湖泊沉积物[35~37]等代用资料重建了北半球各个季风区过去千年夏季风的变化,发现中世纪气候异常期夏季风较强,随后减弱,到20世纪又再次增强[38]。Lachniet等[29]根据巴拿马Chilibrillo洞石笋发现北美季风在750~950 A.D. 由于厄尔尼诺的作用而季风降水强度减少,之后降水又快速增加;印度中部的Jhumar洞石笋[30]和青藏高原冰芯[33]、树轮[34]都指出在中世纪气候异常期气候相对湿润,季风降水强度较强;东亚地区的石笋[27~28, 31~32]、湖泊沉积物[35~37]等也表明东亚季风降水在中世纪气候异常期较强。但是目前的重建记录大多聚焦于中世纪气候异常期,对罗马暖期季风降水变化的研究相对较少,并且重建记录的时间分辨率大多数都是年、十年及以上[39],在空间上重建资料的点位分散,分布不均匀,较难重建大气环流等的变化,因而在机制解释方面比较薄弱。
针对以上问题,Liu等[17]利用气候模式对过去千年季风降水的特点及其影响因子进行了研究,认为在中世纪气候异常期,北半球季风降水显著增强,其主要是受到太阳辐射的影响,与太阳活动极大值时期相对应,而现代暖期,特别是近30年以来,季风降水的增强主要是受到温室气体的影响。同时,火山喷发也会对季风降水产生影响[40~42],火山喷发会向平流层中注入大量二氧化硫气体并形成硫酸盐气溶胶,降低达到地表的太阳短波辐射影响地表温度从而影响北半球季风降水[43~44]。有研究指出,北半球大火山喷发后的两年内,北半球季风降水显著减少,而南半球火山喷发则会增强北半球季风降水[45~46],其原因是北半球火山喷发后的冬天热带太平洋发生厄尔尼诺事件的可能性增加,而南半球火山喷发则增加了发生拉尼娜事件的可能性[47]。
但是,以上基于气候模式的模拟工作大多都局限于分析过去千年时期,其中典型暖期仅包括中世纪气候异常期和现代暖期,罗马暖期很少被关注,且缺乏针对这3个典型暖期季风降水的变化特征及成因的详细对比研究。罗马暖期是指在罗马帝国时期一段相对温暖的时期;部分代用资料指出,罗马暖期的温度变化存在区域性,部分区域的温暖程度与现代相当[48]。在资料允许的情况下,考虑更多的自然暖期可以更好的分析外强迫对北半球季风降水的贡献。因此,本文利用通用地球系统模式(Community Earth System Model,简称CESM)过去2000年瞬变积分气候模拟试验的结果和千年再分析资料Last Millennium Reanalysis v2.1(简称LMR),对比分析北半球季风降水在3个暖期的异同,并且尝试探索其物理机制,以便更加准确的认识现代暖期季风降水的特点及预估未来变化。
1 资料与方法 1.1 资料 1.1.1 气候模拟资料本研究基于CESM的T31分辨率版本(水平分辨率约为3.75°×3.75°,垂直方向分为26层;海洋模块在经向116个格点,纬向100个格点,垂直方向分为60层),开展了4个2000年的瞬变积分模拟气候试验,包括太阳辐射单因子敏感性试验、火山活动单因子敏感性试验、人为组合因子敏感性试验和全强迫试验(表 1)。当前可以直接用于驱动地球系统模式的火山活动外强迫资料最长仅有公元501~2000年(Ice-core Volcanic Index 2,简称IVI2)[49],缺少公元1~500年的外强迫驱动资料,Sigl等[50]重建的过去火山活动序列包含了这一时段,但是无法直接用于驱动模式运行。因此,将1~500年的火山活动序列采用与IVI2相同的参数化方法[51]进行时空拓展,然后与IVI2资料拼接,从而得到过去2000年的火山活动外强迫驱动资料。前期,孙炜毅等[52]已经验证了过去2000年火山活动时空拓展及拼接技术的可靠性。各个单因子敏感性试验和全强迫试验以控制试验的最后一年作为初始场进行积分,然后在如表 1所示的外强迫的驱动下积分运行2000年,得到4个过去2000年瞬变积分气候模拟试验。
| 表 1 基于CESM的过去2000年气候模拟试验 Table 1 Climate simulation experiment based on CESM during the past 2000 years |
为了验证模式的模拟性能,本文采用美国国家气候预测中心降水集合分析资料(Climate Prediction Center Merged Analysis of Precipitation,简称CMAP)[56]以及全球降水气候项目的分析资料(Global Precipitation Climatology Project,简称GPCP)[57]对模拟结果进行评估验证。在分析时,本文将观测/再分析资料利用双线性插值到与模式水平分辨率一致,即3.75°×3.75°;分析时段选取模式模拟资料和观测/再分析资料的共有时段,即1979~2000年。
1.1.3 气候同化资料本文也使用了千年再分析资料LMR,其从现有的CMIP气候模式模拟中提取静态整体样本,作为气候变量的先验估计,结合国际过去全球变化研究计划(Pages2k 2017)的古气候重建资料,使用集合卡尔曼滤波的数据同化方法和线性单变量正向模型(Proxy System Models,简称PSMs),通过将重建数据拟合到网格化的器测数据,然后将PSMs用于根据先前的估算来生成年平均的气候重建值[58]。先前已有研究工作采用LMR分析了全球温度[59]、美国干旱等[60],验证了数据的可靠性。LMR包含降水、海温等年平均气候变量场,在本文中我们仅使用了同化的降水场,在使用时,本文也利用双线性插值的方法将LMR数据插值到与模式分辨率一致,即3.75°×3.75°。
1.2 方法 1.2.1 北半球季风区和季风降水强度的定义本文参考Wang和Ding[61]的定义方法,将北半球季风区定义为:当地夏季的降水量超过全年降水量的55 %,并且降水年较差(夏季降水率与冬季降水率之差)超过2 mm/day。其中,夏季定义为5~9月,冬季定义为当年的11月至第二年的3月。本文选取季风区夏季(5~9月)的平均降水率来衡量季风降水的强度。因为LMR的降水同化资料仅有年平均的结果,所以LMR的季风降水强度用年平均的结果来表征,而季风区年降水量主要由夏季贡献,占到总量的55 % 以上,故不会影响本文讨论季风降水的强度[62]。本文采用暖期减去小冰期气候平均态来衡量暖期的降水异常[63]。
1.2.2 过去2000年3个典型暖期的选取关于罗马暖期、中世纪气候异常期和现代暖期的起止时间,国内外学者还有较多的争议。本文根据Lamb等[64~65]、葛全胜等[66]的重建结果与CESM模拟的北半球季风区的降水和地表温度,如图 1所示,将1~300年定义为罗马暖期(Roman Warm Period,简称RWP),800~1100年定义为中世纪气候异常期(Medieval Climate Anomaly,简称MCA),1850~2000年定义为现代暖期(Present Warm Period,简称PWP)。图 1显示北半球季风区的降水率和地表温度的标准化年平均时间序列的相关系数达到了0.64,达到了95 % 的置信度,说明CESM模拟的北半球季风区呈现很好的“雨热同期”关系,LMR中也有类似的关系[58~60]。本文定义的3个典型暖期的起止时间和Lamb等[64~65]、葛全胜等[66]的稍有差异,这可能与模拟试验的外强迫因子和重建资料的不确定性有关。

|
图 1 AF试验过去2000年北半球季风区标准化年平均地表温度和降水率的31年滑动平均时间序列 红线为降水率,蓝线为地表温度;3个浅黄色柱状时段为3个典型暖期(RWP,MCA和PWP);右上角数字为相关系数 Fig. 1 31-year running mean time series of standardized annual mean surface temperature and precipitation rates in the Northern Hemisphere monsoon region during the past 2000 years in the AF experiment. The red line is the precipitation rate while the blue line is the surface temperature. The three light yellow columnar periods are three typical warm periods(RWP, MCA and PWP), and the number in the upper right corner is the correlation coefficient |
为了对季风降水变化的原因进行归因,本文参考前人的水汽收支诊断方法[67]:
|
(1) |
公式(1)左边表示降水量异常值,右边4项分别为地表面蒸发量异常值、大气比湿变化(热力作用)导致的垂直水汽平流异常、大气环流变化(动力作用)导致的垂直水汽平流异常和水平水汽平流异常。残差项很小,故可以忽略不计[68]。
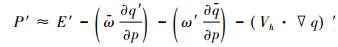
在本文的分析中,我们参考Jin等[69]的方法,假设对流层上下高低层的界面在500 hPa,故采用500 hPa的垂直速度(ω500)来衡量对流层垂直运动的强度,并假设底层对流层的平均比湿约等于850 hPa的比湿(q850),而高层对流层的比湿度很小,可以忽略不计[70]。前人的研究也指出,与垂直水汽平流相比,在绝大多数季风区的地表蒸发量和水平水汽平流是较小的,通常可以忽略不计[69]。因此,公式(1)可以进一步近似为:

|
(2) |
公式(2)右边两项分别表示热力作用和动力作用,其中上横线表示气候平均态,角分号表示与气候平均态的偏差值。
1.2.4 模式模拟结果验证本文使用GPCP和CMAP的降水资料来验证模式模拟结果的可靠性。从图 2a、2b和2c中可以看出,CESM模拟的北半球降水空间分布和GPCP、CMAP的结果相似,降水中心都位于热带辐合带和大西洋、太平洋的西北部,其空间相关系数分别达到了0.85和0.86,达到了99 % 的置信度。同时,模拟和GPCP、CMAP的降水年较差的空间分布和季风区范围,如图 2d、2e和2f所示,可以发现,季风区内的降水年较差结果均为正值,大值中心位于各个子季风区,说明CESM较好的模拟出了季风降水特点,其空间相关系数到达0.79和0.73,达到了99 % 的置信度。但是,图 2d也显示CESM模拟的降水年较差在西北太平洋地区小于GPCP、CMAP的结果,这可能与模式对西太平洋副热带高压强度及位置的模拟欠缺有关。在当前,模式对于西太平洋副热带高压的模拟均有一定的不足[71~74],但是这并不影响我们探讨典型暖期下北半球季风区的变化特征。综上所述,CESM对于北半球季风区的模拟是合理的。

|
图 2 1979~2000年的AF试验和GPCP、CMAP观测/再分析资料的降水平均场 (a,b,c)年平均降水率,(d,e,f)降水年较差,单位:mm/day;红线为北半球季风区;(b,c,e,f)右上角数字为CESM模拟结果与观测/再分析结果的空间相关系数 Fig. 2 Average climate state of precipitation rate in AF experiment and GPCP, CMAP observation/reanalysis data from 1979 to 2000.(a, b, c)are the annual mean precipitation rate, (d, e, f)are the annual precipitation variation, unit: mm/day. The red line is the monsoon region in Northern Hemisphere. The numbers in the upper right corner of(b, c, e, f)are the spatial correlation coefficient between CESM and GPCP, CMAP |
图 3显示了基于LMR同化资料和CESM气候模拟资料的罗马暖期、中世纪气候异常期和现代暖期的北半球季风区降水变化情况,可以发现,CESM和LMR表征的季风降水在孟加拉湾等地稍有差异,但是在北半球陆地季风区两者表现较为一致,都呈现增加的趋势。这可能是因为LMR中使用的重建资料主要位于北美、欧洲、北极和亚洲陆地,并且在0~500年的重建资料数量很少[58]。

|
图 3 LMR同化资料(a,c,e)和AF试验(b,d,f)的3个典型暖期北半球年平均降水率的距平场(相对于1500~1800年) 红线表示北半球季风区的范围,打点区域表示达到90 % 的置信度 Fig. 3 Anomaly fields of LMR assimilation data(a, c, e)and AF experiment(b, d, f)in three typical warm periods of annual mean precipitation rates in Northern Hemisphere(relative to 1500~1800 A.D.). The red line indicates the region of the Northern Hemisphere monsoon, and the dot area indicates a confidence level of 90 % |
就罗马暖期、中世纪气候异常期和现代暖期的降水分布空间格局来看,LMR的结果显示,3个典型暖期的北半球季风降水的空间分布格局相似,主要特点是:北非、北美季风区和亚洲陆地季风区降水增多,而西北太平洋季风区的降水减少。CESM也模拟出了在3个暖期北半球季风降水空间分布一致的结论,其主要特点是:北非、北美海洋季风区和亚洲季风区降水增多,而北美陆地季风区和西北太平洋季风区的降水减少,其中现代暖期降水空间模态与CMIP6多模式集合平均的结果非常一致[3]。
LMR和CESM均体现出罗马暖期、中世纪气候异常期和现代暖期的北半球季风降水变化的空间分布格局是一致的,那么3个暖期的季风降水强度呈现什么特点呢?为此,本文采用箱线图定量对比了3个暖期北半球季风降水强度异常值的变化。图 4展示了北半球季风区以及季风区陆地、海洋的年平均降水距平值。

|
图 4 LMR和AF试验3个典型暖期北半球季风区(a,d)、北半球陆地季风区(b,e)、北半球海洋季风区(c,f)的年平均降水距平值的箱型图(相对于1500~1800年) 黑色箱型表示罗马暖期,蓝色箱型表示中世纪气候异常期,红色箱型表示现代暖期;每一个箱型线段的上下代表降水距平值的第九十和第十(P90、P10)的百分位数,箱子的上下端代表降水距平值的第七十五和第二十五(P75、P25)的百分位数;箱子中间的横线代表中位数,红色六角星代表平均数,红色五角星表示达到了90 % 的置信度 Fig. 4 Box plots of the annual mean precipitation anomaly(relative to 1500~1800 A.D.)of LMR and AF experiment in three typical warm periods, (a, d)are the Northern Hemisphere monsoon region, (b, e)are the Northern Hemisphere land monsoon region and(c, f)are the Northern Hemisphere ocean monsoon region. Black boxes represent Roman Warm Periods, blue boxes represent Medieval Climate Anomaly, and red boxes represent Present Warm Period. The top and bottom of each box segment represent the 90th and 10th percentiles(P90 and P10)of the distributions, the top and bottom of the box represent the 75th and 25th percentiles(P75 and P25)of the distributions, the bars within the boxes represent the median, the red six-pointed stars represent the mean values, and the red five-pointed stars represent the 90 % confidence level |
LMR的结果显示,在北半球季风区,罗马暖期和中世纪气候异常期的季风降水强度相对于小冰期增加不显著,但是在现代暖期季风降水显著增加;在北半球陆地季风区,3个暖期的降水都呈现显著的增加,增加幅度分别达到了2.4 %、2.3 % 和2.8 %,现代暖期的增幅约为前两个暖期的1.2倍;在北半球海洋季风区,3个暖期的降水强度变化都不显著。CESM的模拟结果显示在3个典型暖期,无论是北半球季风区,还是北半球陆地季风区或北半球海洋季风区,季风降水的强度都显著的增加,并且现代暖期的增加幅度远大于前两个暖期。CESM模拟的陆地季风区的降水增加幅度在3个暖期分别达到了2.6 %、2.7 % 和3.1 %,现代暖期的季风降水强度异常值与前两个暖期相比的结果与LMR相同,也为1.2倍左右。
因此,CESM和LMR都表明在3个典型暖期北半球季风降水的空间分布格局是相似的,并且,现代暖期的北半球季风降水强度远大于罗马暖期和中世纪气候异常期,其季风降水异常值约为前两个暖期的1.2倍。
2.2 不同外强迫对典型暖期北半球季风降水的影响机理前人研究表明,自然暖期北半球季风降水受到有效太阳辐射的影响,而现代暖期主要受温室气体的排放和人为气溶胶等人类活动的影响[75],所以本文拟进一步探究各个暖期外强迫对降水异常的贡献,以确定主导因子及其影响机理。由于CESM模拟的北半球季风区、北半球陆地季风区和北半球海洋季风区的降水变化相似(图 4d、4e和4f),所以下文仅考虑北半球季风区。
通过对比3个典型暖期下全强迫试验和敏感性试验北半球季风降水相对于小冰期(1500~1800年)的箱型图(图 5),可以发现,罗马暖期和中世纪气候异常期降水异常值增加主要受到太阳辐射和火山活动的影响。罗马暖期火山喷发的平均强度为14.7 Tg/次,太阳辐射强度为1364.4 W/m2;中世纪气候异常期火山喷发的平均强度为9.8 Tg/次,太阳辐射强度为1363.7 W/m2;小冰期火山喷发的平均强度为33.1 Tg/次,太阳辐射强度为1361.1 W/m2。相对于小冰期,太阳辐射增强和火山减弱共同作用使得北半球季风降水强度在两个暖期分别增加了2.5 % 和2.3 %,并且在这两个时期太阳辐射和火山活动的贡献量几乎是相等的。

|
图 5 AF试验和敏感性试验在3个典型暖期北半球季风区夏季平均降水距平值的箱型图(相对于1500~1800年) 黑色箱型表示全强迫试验,蓝色箱型表示太阳辐射单因子敏感性试验,红色箱型表示火山活动单因子敏感性试验,绿色箱型表示人为组合因子敏感性试验;每一个箱型线段的上下代表降水距平值的第九十和第十(P90、P10)的百分位数,箱子的上下端代表降水距平值的第七十五和第二十五(P75、P25)的百分位数;箱子中间的横线代表中位数,红点代表平均数,红色五角星表示达到了90 % 的置信度 Fig. 5 Box plots of AF experiment and each single-forcing sensitivity experiment for summer mean precipitation anomaly in the Northern Hemisphere monsoon region during three typical warm periods(relative to 1500~1800 A.D.). The black boxes represent the AF experiment, the blue boxes represent the solar radiation experiment, the red boxes represent the volcanic activity experiment, and the green boxes represent the anthropogenic forcing experiment. The top and bottom of each box segment represent the 90th and 10th percentiles(P90 and P10)of the distributions, the top and bottom of the box represent the 75th and 25th percentiles(P75 and P25)of the distributions, the bars within the boxes represent the median, the red points represent the mean values, and the red five-pointed stars represent the 90 % confidence level |
经统计,现代暖期火山喷发的平均强度为10.5 Tg/次,太阳辐射强度为1363.7 W/m2。3个暖期的平均火山活动强度折算成辐射强迫分别为-0.9 W/m2、-0.6 W/m2和-0.7 W/m2。可见,现代暖期的自然外强迫强度与前两个暖期相似。从图 5c也可以看出,在现代暖期,太阳辐射和火山活动这两个自然外强迫的贡献与自然暖期相似,而温室气体的排放增加和土地利用改变形成的人类组合因子强迫的作用约为自然外强迫的1.5倍,从而导致了现代暖期北半球风降水强度增加了约3.5 %,其强度约为自然暖期的1.2倍。
为了分析3个暖期不同的单因子对于北半球季风降水强度的不同贡献,本文从水汽诊断方程出发,根据公式(2),利用500 hPa垂直速度和850 hPa比湿计算的热力作用和动力作用来分析成因机制,结果如图 6所示。

|
图 6 AF和各个敏感性试验3个典型暖期北半球季风区热力作用(a,b,c)、动力作用(d,e,f)距平值的箱型图(相对于1500~1800年) 黑色箱型表示全强迫试验,蓝色箱型表示太阳辐射单因子敏感性试验,红色箱型表示火山活动单因子敏感性试验,绿色箱型表示人为组合因子敏感性试验;每一个箱型线段的上下代表热力、动力作用距平值的第九十和第十(P90、P10)的百分位数,箱子的上下端代表热力、动力作用距平值的第七十五和第二十五(P75、P25)的百分位数;箱子中间的横线代表中位数,红点代表平均数,红色五角星表示达到了90 % 的置信度 Fig. 6 Box plots of AF experiment and each single-forcing sensitivity experiment for the thermodynamic process(a, b, c)and the dynamic process(d, e, f)anomaly in Northern Hemisphere monsoon region during three typical warm periods(relative to 1500~1800 A.D.). The black boxes represent the AF experiment, the blue boxes represent the solar radiation experiment, the red boxes represent the volcanic activity experiment, and the green boxes represent the anthropogenic forcing experiment. The top and bottom of each box segment represent the 90th and 10th percentiles(P90 and P10)of the distributions, the top and bottom of the box represent the 75th and 25th percentiles(P75 and P25)of the distributions, the bars within the boxes represent the median, the red points represent the mean values, and the red five-pointed stars represent the 90 % confidence level |
图 6的结果显示,在各个暖期,热力作用对于降水的贡献大于动力作用,因而在3个暖期中,热力作用对于季风降水增加的贡献都处于主导地位。图 6a、6b和6c展示了3个暖期不同单因子的热力作用对于降水的贡献,可以发现罗马暖期和中世纪气候异常期的各个单因子热力作用对于降水强度的贡献非常相似,其主要贡献来自太阳辐射增强引起大气水汽增多。在现代暖期,热力作用对于降水的贡献远大于前两个自然暖期,而其贡献主要来自于人类活动的影响,同时,太阳辐射也有与自然暖期相似的贡献。前人的研究指出,热力项的变化主要是由于对流层水汽含量的变化所导致的[69],而在现代暖期,随着人类活动温室气体的排放增加,对流层湿度也随之变大(图略),从而导致的了现代暖期热力作用贡献的显著增加[68],这与我们的结论一致。
对于动力项的结果,如图 6d、6e和6f所示,可以发现,3个典型暖期的各个单因子的动力项的贡献非常相似,主要是来自火山活动的影响,在3个典型暖期火山活动均呈现喷发频率低、强度小的特点。但是,现代暖期人为因子作用下的动力项比前两个暖期稍强,也有显著的贡献,从而在整体上,现代暖期的动力作用也较前两个暖期强。
本文进一步探究了北半球海洋和陆地季风区的热力、动力机制,结果如图 7所示。图 7中的蓝色箱型表示北半球陆地季风区的热力、动力作用,可以发现,其特征与北半球季风区是一致的,都是以热力作用为主,其中罗马暖期和中世纪气候异常期主要受到太阳辐射增强和火山活动减弱引起的热力作用增强的影响,而现代暖期主要受到人类活动引起的热力作用增强的影响。从图 7中的黑色箱型可以看出,北半球海洋季风区在3个典型暖期的热力作用的变化特征与北半球季风区、北半球陆地季风区是一致的,但是北半球海洋季风区在现代暖期的动力作用比北半球季风区、北半球陆地季风区显著增强,其主要是因为人类活动引起的温室气体排放增加和土地利用的改变引起的动力作用显著增强(图 7f)。

|
图 7 AF和各个敏感性试验3个典型暖期北半球海洋、陆地季风区热力作用(a,b,c)、动力作用(d,e,f)距平值的箱型图(相对于1500~1800年) 黑色箱型表示北半球海洋季风区,蓝色箱型表北半球陆地季风区;横坐标表示AF和各个敏感性试验;每一个箱型线段的上下代表热力、动力作用距平值的第九十和第十(P90、P10)的百分位数,箱子的上下端代表热力、动力作用距平值的第七十五和第二十五(P75、P25)的百分位数;箱子中间的横线代表中位数,红点代表平均数,红色五角星表示达到了90 % 的置信度 Fig. 7 Box plots of AF experiment and each single-forcing sensitivity experiment for the thermodynamic process(a, b, c)and the dynamic process(d, e, f)anomaly in Northern Hemisphere ocean and land monsoon region during three typical warm periods(relative to 1500~1800 A.D.). The black boxes represent the results of Northern Hemisphere ocean monsoon region, the blue boxes represent the results of Northern Hemisphere land monsoon region. The abscissa represents AF and each single-forcing sensitivity experiment. The top and bottom of each box segment represent the 90th and 10th percentiles(P90 and P10)of the distributions, the top and bottom of the box represent the 75th and 25th percentiles(P75 and P25)of the distributions, the bars within the boxes represent the median, the red points represent the mean values, and the red five-pointed stars represent the 90 % confidence level |
本文利用LMR同化资料和4个CESM过去2000年瞬变积分气候模拟试验,对比分析了罗马暖期、中世纪气候异常期和现代暖期的北半球季风降水空间分布格局、强度的异同以及成因机制,得出的主要结论如下:
(1) LMR同化资料和CESM模拟的模拟结果均表明,在罗马暖期、中世纪气候异常期和现代暖期中,北半球季风降水的空间分布格局是相似的,都没有发生显著的改变。在模式模拟结果和同化资料中,各个暖期的陆地季风降水相对于小冰期的增幅也是相近的。
(2) 罗马暖期和中世纪气候异常期的北半球季风降水强度相对于小冰期的异常值是相似的,其主要受到太阳辐射增强和火山活动减弱的影响;在现代暖期,太阳辐射和火山活动的贡献与前两个暖期是相近的,而人为因子的作用显著增强,从而导致了季风降水强度比前两个暖期显著增强,其强度异常值约为前两个暖期的1.2倍。
(3) 在3个暖期,北半球季风降水强度增强都是由热力作用主导,其中罗马暖期和中世纪气候异常期的主导因子是太阳辐射增强引起的热力作用增强,现代暖期太阳辐射对于热力项的贡献与前两个暖期相似,但是人类活动所导致的温室气体增加和土地利用/覆盖的改变引起的热力作用显著增强,从而在整体上现代暖期的热力作用比前两个暖期显著增强。
然而当前研究还存在以下的不确定性:
(1) LMR是基于重建和模拟的气候同化数据,其中代用资料对于气候变化的敏感性、地理位置、时间覆盖范围等各不相同,同化方法对结果也有一定的影响,因此可能具有一定的不确定性[58~60]。同时,LMR为年平均的结果,无法验证降水的季节变化。
(2) 模式自身对外强迫响应的不确定性,本文仅使用单一模式进行分析,每个模拟试验仅运行了一次,无法消除内部变率的影响,同时模拟结果可能具有一定的模式依赖性[76~77]。
(3) 缺少对于其他外强迫的考虑,本文仅考虑了太阳辐射、火山活动和人类活动(温室气体排放+土地利用/覆盖)的影响,而轨道参数[78]、人为气溶胶[68]等也会对北半球季风降水造成影响。
(4) 尽管北半球季风区、北半球海洋季风区、北半球陆地季风区都表现出在暖期降水增多的变化趋势,但是在空间上还是非均一的,例如在西北太平洋季风区降水呈现减少的趋势,因此各个子季风区的热力、动力机制可能有所不同[79~81]。
因此以后的工作有待于基于更多高分辨率的北半球季风区和各个子季风区降水的重建结果,并且采用考虑更多外强迫的多模式集合平均的结果来进一步分析。
| [1] |
Mochadi M, Prange M, Steinke S. Palaeoclimatic insights into forcing and response of monsoon rainfall[J]. Nature, 2016, 533(7602): 191-199. DOI:10.1038/nature17450 |
| [2] |
Vellore R, Kaplan L, Krishnan R, et al. Monsoon-extratropical circulation interactions in Himalayan extreme rainfall[J]. Climate Dynamics, 2016, 46: 3517-3546. DOI:10.1007/s00382-015-2784-x |
| [3] |
Wang B, Jin C, Liu J. Understanding future change of global monsoons projected by CMIP6 models[J]. Journal of Climate, 2020, 33(15): 6471-6489. DOI:10.1175/JCLI-D-19-0993.1 |
| [4] |
Hsu P, Li T, Wang B. Trends in global monsoon area and precipitation over the past 30 years[J]. Geophysical Research Letters, 2011, 38(8): L08701. DOI:10.1029/2011GL046893 |
| [5] |
Fasullo J. A mechanism for land-ocean contrasts in global monsoon trends in a warming climate[J]. Climate Dynamics, 2012, 39(5): 1137-1147. DOI:10.1007/s00382-011-1270-3 |
| [6] |
Zhou T, Zhang L, Li H. Changes in global land monsoon area and total rainfall accumulation over the last half century[J]. Geophysical Research Letters, 2008, 35(16): L16707. DOI:10.1029/2008GL034881 |
| [7] |
Hsu P, Li T, Luo J, et al. Increase of global monsoon area and precipitation under global warming: A robust signal?[J]. Geophysical Research Letters, 2012, 39(6): L06701. DOI:10.1029/2012GL051037 |
| [8] |
Hsu P, Li T, Murakami H, et al. Future change of the global monsoon revealed from 19 CMIP5 models[J]. Journal of Geophysical Research: Atmospheres, 2013, 118(3): 1247-1260. DOI:10.1002/jgrd.50145 |
| [9] |
Kitoh A, Endo H, Krishna K, et al. Monsoons in a changing world: A regional perspective in a global context[J]. Journal of Geophysical Research: Atmosphere, 2013, 118(8): 3053-3065. DOI:10.1002/jgrd.50258 |
| [10] |
Lee J, Wang B. Future change of global monsoon in the CMIP5[J]. Climate Dynamics, 2014, 42(1-2): 101-119. DOI:10.1007/s00382-012-1564-0 |
| [11] |
Zhou T, Yu R, Li H, et al. Ocean forcing to changes in global monsoon precipitation over the recent half-century[J]. Journal of Climate, 2008, 21(15): 3833-3852. DOI:10.1175/2008JCLI2067.1 |
| [12] |
Jiang J, Zhou T. Global monsoon responses to decadal sea surface temperature variations during the twentieth century: Evidence from AGCM simulations[J]. Journal of Climate, 2019, 32(22): 7675-7695. DOI:10.1175/JCLI-D-18-0890.1 |
| [13] |
Huang X, Zhou T, Zhang W, et al. Northern Hemisphere land monsoon precipitation changes in the twentieth century revealed by multiple reanalysis datasets[J]. Climate Dynamics, 2019, 53(11): 7131-7149. DOI:10.1007/s00382-019-04982-z |
| [14] |
韩春凤, 刘健, 王志远. 过去2000年亚洲夏季风降水百年尺度变化及其区域差异的模拟分析[J]. 第四纪研究, 2016, 36(3): 732-746. Han Chunfeng, Liu Jian, Wang Zhiyuan. Simulated analysis of Asian summer monsoon precipitation on centennial time scale and its regional differences over the past 2000 years[J]. Quaternary Sciences, 2016, 36(3): 732-746. |
| [15] |
Held I, Soden B. Robust responses of the hydrological cycle to global warming[J]. Journal of Climate, 2006, 19: 5686-569. DOI:10.1175/JCLI3990.1 |
| [16] |
Wentz F, Ricciardulli F, Hilburn K, et al. How much more rain will global warming bring?[J]. Science, 2007, 317(5835): 233-235. DOI:10.1126/science.1140746 |
| [17] |
Liu J, Wang B, Ding Q, et al. Centennial variations of the global monsoon precipitation in the last millennium: Results from ECHO-G model[J]. Journal of Climate, 2009, 22(9): 2356-2371. DOI:10.1175/2008JCLI2353.1 |
| [18] |
Wang B, Liu J, Kim H, et al. Recent change of the global monsoon precipitation(1979-2008)[J]. Climate Dynamics, 2012, 39: 1123-1135. DOI:10.1007/s00382-011-1266-z |
| [19] |
彭友兵, 程海, 陈凯, 等. 过去千年中国东部持续性严重干旱事件的模拟研究[J]. 第四纪研究, 2019, 39(2): 282-293. Peng Youbing, Cheng Hai, Chen Kai, et al. Modeling study of severe persistent drought events over Eastern China during the last millennium[J]. Quaternary Sciences, 2019, 39(2): 282-293. |
| [20] |
魏柱灯, 方修琦, 苏筠. 过去2000年中国的气候变化、财政周期与朝代更迭[J]. 第四纪研究, 2020, 40(5): 1180-1192. Wei Zhudeng, Fang Xiuqi, Su Yun. Climate change, fiscal balance and dynastical cycles in China over the past 2000 years[J]. Quaternary Sciences, 2020, 40(5): 1180-1192. |
| [21] |
史锋, 杨保, 冯娟, 等. 利用树轮资料集成重建的过去2000年北半球年平均温度变化[J]. 第四纪研究, 2015, 35(5): 1051-1063. Shi Feng, Yang Bao, Feng Juan, et al. Reconstruction of the Northern Hemisphere annual temperature change over the Common Era derived from tree rings[J]. Quaternary Sciences, 2015, 35(5): 1051-1063. |
| [22] |
郑景云, 葛全胜, 方修琦. 从中国过去2000年温度变化看20世纪增暖[J]. 地理学报, 2002, 57(6): 631-638. Zheng Jingyun, Ge Quansheng, Fang Xiuqi. Temperature change in China in the past 2000 years: A Perspective of 20th century warming[J]. Acta Geographica Sinica, 2002, 57(6): 631-638. DOI:10.3321/j.issn:0375-5444.2002.06.001 |
| [23] |
郑景云, 王绍武. 中国过去2000年气候变化的评估[J]. 地理学报, 2005, 60(1): 21-31. Zheng Jingyun, Wang Shaowu. Assessment of climate change in China in the past 2000 years[J]. Acta Geographica Sinica, 2005, 60(1): 21-31. DOI:10.3321/j.issn:0375-5444.2005.01.003 |
| [24] |
Wang P, Wang B, Kiefer T. Global monsoon across timescales[J]. Climate Dynamics, 2012, 39(5): 1043-1044. DOI:10.1007/s00382-012-1459-0 |
| [25] |
柳中晖, 周爱锋, 刘卫国. 近千年来青海湖水热变化再重建[J]. 第四纪研究, 2017, 37(5): 974-981. Liu Zhonghui, Zhou Aifeng, Liu Weiguo. Further reconstruction of temperature and salinity changes in Lake Qinghai over the past millennium[J]. Quaternary Sciences, 2017, 37(5): 974-981. |
| [26] |
满志敏, 杨煜达. 中世纪温暖期升温影响中国东部地区自然环境的文献证据[J]. 第四纪研究, 2014, 34(6): 1197-1203. Man Zhimin, Yang Yuda. The Medieval Warming impacts on the natural environment in Eastern China as inferred from historical documents[J]. Quaternary Sciences, 2014, 34(6): 1197-1203. |
| [27] |
薛莲花, 赵侃, 崔英方, 等. 近2000年来东亚夏季风突变的落水洞高分辨率石笋记录[J]. 第四纪研究, 2020, 40(4): 973-984. Xue Lianhua, Zhao Kan, Cui Yingfang, et al. Abrupt changes of East Asian summer monsoon over the past two millennia from stalagmite record in Luoshui Cave, Hubei Province[J]. Quaternary Sciences, 2020, 40(4): 973-984. |
| [28] |
程海, 艾思本, 王先锋, 等. 中国南方石笋氧同位素记录的重要意义[J]. 第四纪研究, 2005, 25(2): 157-163. Cheng Hai, Edwards R L, Wang Xianfeng, et al. Oxygen isotope records of stalagmites from Southern China[J]. Quaternary Sciences, 2005, 25(2): 157-163. DOI:10.3321/j.issn:1001-7410.2005.02.004 |
| [29] |
Lachinet M, Burns S, Piero D, et al. A 1500-year El Niño/Southern Oscillation and rainfall history for the Isthmus of Panama from speleothem calcite[J]. Journal of Geophysical Research, 2004, 109: D20117. DOI:10.1029/2004JD004694 |
| [30] |
Hu C, Henderson G, Huang J, et al. Quantification of Holocene Asian monsoon rainfall from spatially separated cave records[J]. Earth and Planetary Science Letters, 2008, 266(3-4): 221-232. DOI:10.1016/j.epsl.2007.10.015 |
| [31] |
Chen J, Chen F, Feng S, et al. Hydroclimatic changes in China and surroundings during the medieval climate anomaly and little ice age: Spatial patterns and possible mechanisms[J]. Quaternary Science Reviews, 2015, 107: 98-111. DOI:10.1016/j.quascirev.2014.10.012 |
| [32] |
Zhang P, Cheng H, Edwards R, et al. A test of climate, sun and culture relationships from an 1810-year Chinese cave record[J]. Science, 2008, 322(5903): 940-942. DOI:10.1126/science.1163965 |
| [33] |
Kaspari S, Mayewski P, Kang S, et al. Reduction in northward incursions of the South Asian monsoon since~1400 AD inferred from a Mt. Everest ice core[J]. Geophysical Research Letters, 2007, 34(16): L16701. DOI:10.1029/2007GL030440 |
| [34] |
Sinha A, Rehammer M, Stott L, et al. The leading mode of Indian summer monsoon precipitation variability during the last millennium[J]. Geophysical Research Letters, 2011, 38(15): L15703. DOI:10.1029/2011GL047713 |
| [35] |
Liu Z, Henderson A, Huang Y. Alkenone-based reconstruction of Late-Holocene surface temperature and salinity changes in Lake Qinghai, China[J]. Geophysical Research Letters, 2006, 33(13): L09707. DOI:10.1029/2006GL026947 |
| [36] |
Xu Q, Xiao J, Li Y, et al. Pollen-based quantitative reconstruction of Holocene climate changes in the Daihai Lake area, Inner Mongolia, China[J]. Journal of Climate, 2010, 23(11): 2856-2868. DOI:10.1175/2009JCLI3155.1 |
| [37] |
Liu J, Chen F, Chen J, et al. Humid medieval warm period recorded by magnetic characteristics of sediments from Gonghai Lake, Shanxi, North China[J]. Chinese Science Bulletin, 2011, 56(23): 2464-2474. DOI:10.1007/s11434-011-4592-y |
| [38] |
王绍武. 全新世气候变化[M]. 北京: 气象出版社, 2011: 175-176. Wang Shaowu. Climate Change in the Holocene[M]. Beijing: Meteorological Press, 2011: 175-176. |
| [39] |
PAGES 2k Consortium. A global multiproxy database for temperature reconstructions of the Common Era[J]. Scientific Data, 2017, 4: 170088. DOI:10.1038/sdata.2017.88 |
| [40] |
Sun W, Liu J, Wang Z. Simulation of centennial-scale drought events over Eastern China during the past 1500 years[J]. Journal of Meteorological Research, 2017, 31(1): 17-27. DOI:10.1007/s13351-017-6090-x |
| [41] |
Sun W, Liu J, Wang B, et al. A "La Niña-like" state occurring in the second year after tropical volcanic eruptions during the 1500 years[J]. Climate Dynamics, 2019, 52: 7495-7509. DOI:10.1007/s00382-018-4163-x |
| [42] |
Sun W, Wang B, Liu J, et al. How northern high-latitude volcanic eruptions in different seasons affect ENSO[J]. Journal of Climate, 2019, 32(11): 3245-3262. DOI:10.1175/JCLI-D-18-0290.1 |
| [43] |
Robock A. Volcanic eruptions and climate[J]. Reviews of Geophysics, 2000, 38(2): 191-219. DOI:10.1029/1998RG000054 |
| [44] |
Man W, Zhou T, Jungclaus J. Effects of large volcanic eruptions on global summer climate and East Asian monsoon changes during the last millennium: Analysis of MPI-ESM simulations[J]. Journal of Climate, 2014, 27(19): 7394-7409. DOI:10.1175/JCLI-D-13-00739.1 |
| [45] |
Liu F, Chai J, Wang B, et al. Global monsoon precipitation responses to large volcanic eruptions[J]. Scientific Reports, 2016, 6(1): 24331. DOI:10.1038/srep24331 |
| [46] |
Zuo M, Zhou T, Man W. Hydroclimate responses over global monsoon regions following volcanic eruptions at different latitudes[J]. Journal of Climate, 2009, 32(24): 4367-4385. |
| [47] |
Stevenson S, Otto-Bliesner B, Fasullo J, et al. "El Niño Like" hydroclimate responses to last millennium volcanic eruptions[J]. Journal of Climate, 2016, 29(8): 2907-2921. DOI:10.1175/JCLI-D-15-0239.1 |
| [48] |
葛全胜, 郑景云, 郝志新, 等. 过去2000年中国气候变化的若干重要特征[J]. 中国科学: 地球科学, 2012, 42(6): 934-942. Ge Quansheng, Zheng Jingyun, Hao Zhixin, et al. General characteristics of climate changes during the past 2000 years in China[J]. Science China: Earth Sciences, 2012, 42(6): 934-942. |
| [49] |
Gao C, Robock A, and Ammann C. Volcanic forcing of climate over the past 1500 years: An improved ice core-based index for climate models[J]. Journal of Geophysical Research, 2008, 113: D23111. DOI:10.1029/2008JD010239 |
| [50] |
Sigl M, Wenstrup M, McConnell J, et al. Timing and climate forcing of volcanic eruptions for the past 2500 years[J]. Nature, 2015, 523(7562): 543-549. DOI:10.1038/nature14565 |
| [51] |
Grieser J, Schonwiese C. Parameterization of spatiotemporal patterns of volcanic aerosol induced stratospheric optical depth and its climate radiative forcing[J]. Atmósfera, 1999, 12(2): 111-133. |
| [52] |
孙炜毅, 刘健, 高超超, 等. 过去2000年北半球不同纬度温度对火山活动的响应[J]. 科学通报, 2020. Sun Weiyi, Liu Jian, Gao Chaochao, et al. Response of temperature in different latitudes of the Northern Hemisphere to volcanic eruptions during the past 2000 years[J]. Chinese Science Bulletin, 2020. DOI:10.1360/TB-2020-1045 |
| [53] |
Shapiro A, Schmutz W, Rozanov E, et al. A new approach to the long-term reconstruction of the solar irradiance leads to large historical solar forcing[J]. Journal of Astronomy and Astrophysics, 2011, 529(A67): 1-8. |
| [54] |
MacFarling C, Etheridge D, Trudinger C, et al. Law Dome CO2, CH4 and N2O ice core records extended to 2000 years BP[J]. Geophysical Research Letters, 2006, 33(14): 1-4. |
| [55] |
Kaplan J, Krumhardt K, Ellis E, et al. Holocene carbon emissions as a result of anthropogenic land cover change[J]. The Holocene, 2011, 21(5): 775-791. DOI:10.1177/0959683610386983 |
| [56] |
Xie P, Arkin P. Global precipitation: A 17-year monthly analysis based on gauge observations, satellite estimates, and numerical model outputs[J]. Bulletin of the American Meteorological Society, 1997, 78(11): 2539-2558. DOI:10.1175/1520-0477(1997)078<2539:GPAYMA>2.0.CO;2 |
| [57] |
Adler R, Huffman G, Chang A, et al. The version 2 Global Precipitation Climatology Project (GPCP) monthly precipitation analysis(1979-present)[J]. Journal of Hydrometeorology, 2003, 4(6): 1147-1167. DOI:10.1175/1525-7541(2003)004<1147:TVGPCP>2.0.CO;2 |
| [58] |
Tardif R, Hakim G, Perkins W, et al. Last millennium reanalysis with an expanded proxy database and seasonal proxy modeling[J]. Climate of the Past, 2019, 15(4): 1251-1273. DOI:10.5194/cp-15-1251-2019 |
| [59] |
Parsons L, Hakim G. Local regions associated with interdecadal global temperature variability in the Last Millennium Reanalysis and CMIP5 models[J]. Journal of Geophysical Research: Atmospheres, 2019, 124(17-18): 9905-9917. DOI:10.1029/2019JD030426 |
| [60] |
Erb M, Emile-Geay J, Hakim G, et al. Atmospheric dynamics drive most interannual U. S. droughts over the last millennium[J]. Science Advances, 2020, 6(32): 2375-2548. |
| [61] |
Wang B, Ding Q. Global monsoon: Dominant mode of annual variation in the tropics[J]. Dynamics of Atmospheres and Oceans, 2008, 44(3-4): 165-183. DOI:10.1016/j.dynatmoce.2007.05.002 |
| [62] |
Wang B, Ding Q. Changes in global monsoon precipitation over the past 56 years[J]. Geophysical Research Letters, 2006, 33(6): L06711. DOI:10.1029/2005GL025347 |
| [63] |
Chai J, Liu F, Liu J, et al. Enhanced global monsoon in present warm period due to natural and anthropogenic forcing[J]. Atmosphere, 2018, 9(4): 136. DOI:10.3390/atmos9040136 |
| [64] |
Lamb H. The early medieval warm epoch and its sequel[J]. Palaeogeography, Palaeoclimatology, Palaeoecology, 1965, 1: 13-37. DOI:10.1016/0031-0182(65)90004-0 |
| [65] |
Lamb H. Climate: Present, past and future[M]//Grove M J. Climatic History and the Future (Vol. 2). London: Methuen, 1977: 837.
|
| [66] |
葛全胜, 刘健, 方修琦, 等. 过去2000年冷暖变化的基本特征与主要暖期[J]. 地理学报, 2013, 68(5): 579-592. Ge Quansheng, Liu Jian, Fang Xiuqi, et al. Basic characteristics and main warming period of changes in temperature and temperature in the past 2000 years[J]. Acta Geographica Sinica, 2013, 68(5): 579-592. |
| [67] |
Chou C, Wu T, Tan P. Changes in gross moist stability in the tropics under global warming[J]. Climate Dynamics, 2013, 41(9-10): 2481-2496. DOI:10.1007/s00382-013-1703-2 |
| [68] |
周天军, 张文霞, 张丽霞, 等. 人为气溶胶导致全球陆地季风区降水减少的动力和热力过程[J]. 中国科学: 地球科学, 2020, 50(8): 1122-1137. Zhou Tianjun, Zhang Wenxia, Zhang Lixia, et al. The dynamic and thermodynamic processes dominating the reduction of global land monsoon precipitation driven by anthropogenic aerosols emission[J]. Science China: Earth Sciences, 2020, 50(8): 1122-1137. |
| [69] |
Jin C, Wang B, Liu J. Future changes and controlling factors of the eight regional monsoons projected by CMIP6 Models[J]. Journal of Climate, 2020, 33(21): 9307-9326. DOI:10.1175/JCLI-D-20-0236.1 |
| [70] |
Chen C, Roeckner E, Soden B. A comparison of satellite observations and model simulations of column-integrated moisture and upper-tropospheric humidity[J]. Journal of Climate, 1996, 9(7): 1561-1585. DOI:10.1175/1520-0442(1996)009<1561:ACOSOA>2.0.CO;2 |
| [71] |
He C, Zhou T. The two interannual variability modes of the Western North Pacific Subtropical High simulated by 28 CMIP5-AMIP models[J]. Climate Dynamics, 2014, 43(9-10): 2455-2469. DOI:10.1007/s00382-014-2068-x |
| [72] |
He C, Zhou T. Responses of the western North Pacific subtropical high to global warming under RCP4.5 and RCP8.5 scenarios projected by 33 CMIP5 Models: The dominance of tropical Indian Ocean-tropical Western Pacific SST gradient[J]. Journal of Climate, 2015, 28(12): 365-380. |
| [73] |
He C, Zhou T, Lin A, et al. Enhanced or weakened western North Pacific Subtropical high under global warming?[J]. Scientific Reports, 2015, 5(1): 16771. DOI:10.1038/srep16771 |
| [74] |
He C, Wu B, Zou L, et al. Responses of the summertime subtropical anticyclones to global warming[J]. Journal of Climate, 2017, 30(16): 6465-6479. DOI:10.1175/JCLI-D-16-0529.1 |
| [75] |
Liu J, Wang B, Yim S, et al. What drives the global summer monsoon over the past millennium?[J]. Climate Dynamics, 2012, 39(5): 1063-1072. DOI:10.1007/s00382-012-1360-x |
| [76] |
李振朝, 韦志刚, 吕世华, 等. CMIP5部分模式气温和降水模拟结果在北半球及青藏高原的检验[J]. 高原气象, 2013, 32(4): 921-928. Li Zhenchao, Wei Zhigang, Lü Shihua, et al. Test of partial model temperature and precipitation simulation results of CMIP5 in the Northern Hemisphere and the Qinghai-Tibet Plateau[J]. Plateau Meteorology, 2013, 32(4): 921-928. |
| [77] |
孙炜毅, 刘健, 万凌峰, 等. 全新世北半球中纬度降水变化对不同外强迫响应的模拟研究[J]. 第四纪研究, 2020, 40(6): 1588-1596. Sun Weiyi, Liu Jian, Wan Lingfeng, et al. Simulation study on the response of mid-latitude precipitation changes in the Northern Hemisphere to different external forcing in the Holocene[J]. Quaternary Sciences, 2020, 40(6): 1588-1596. |
| [78] |
Otto-Bliesner B, Esther C, John F. Climate variability and change since 850 CE: An ensemble approach with the Community Earth System Model[J]. Bulletin of the American Meteorological Society, 2016, 97(5): 735-754. DOI:10.1175/BAMS-D-14-00233.1 |
| [79] |
Chen Z, Zhou T, Zhang L, et al. Global land monsoon precipitation changes in CMIP6 projections[J]. Geophysical Research Letters, 2020, 47: e2019GL086902. DOI:10.1029/2019GL086902 |
| [80] |
Zhou T, Lu J, Zhang W, et al. The sources of uncertainty in the projection of global land monsoon precipitation[J]. Geophysical Research Letters, 2020, 47: e2020GL088415. DOI:10.1029/2020GL088415 |
| [81] |
Chen X, Zhou T. Distinct effects of global mean warming and regional sea surface warming pattern on projected uncertainty in the South Asian summer monsoon[J]. Geophysical Research Letters, 2015, 42: 9433-9439. DOI:10.1002/2015GL066384 |
2 Jiangsu Provincial Key Laboratory for Numerical Simulation of Large Scale Complex Systems, School of Mathematical Science, Nanjing Normal University, Nanjing 210023, Jiangsu;
3 Open Studio for the Simulation of Ocean-Climate-Isotope, Qingdao National Laboratory for Marine Science and Technology, Qingdao 266237, Shandong)
Abstract
Understanding the changing characteristics of monsoon precipitation in the Northern Hemisphere during the warm period and its response to external forcing is crucial for modern socio-economic development. Using the Last Millennium Reanalysis(LMR) and climate simulation experiment based on the Community Earth System Model(CESM) during the past 2000 years, this study discusses the characteristics and mechanism of Northern Hemisphere monsoon precipitation in the Roman Warm Period, the Medieval Climate Anomaly and the Present Warm Period. The results show that during the three typical warm periods, the Northern Hemisphere monsoon precipitation presents an increasing trend, and the spatial distribution of the precipitation anomalies is similar. However, the monsoon precipitation intensity of the three warm periods is completely different. The Roman Warm Period and the Medieval Climate Anomaly have similar precipitation intensity, while the Present Warm Period is significantly stronger than the first two warm periods, which is about 1.2 times. The precipitation increase in the three warm periods is dominated by the thermal process, among which the Roman Warm Period and the Medieval Climate Anomaly are mainly influenced by the thermal process caused by the enhancement of solar radiation, and the dynamic process caused by the weak volcanic activity also contributed to some extent. In the Present Warm Period, the contribution of solar radiation and volcanic activity to the thermodynamic process is similar to that of the first two warm periods, but the increase of greenhouse gases causes the thermodynamic process to increase significantly, so that the total thermodynamic process of the Present Warm Period is significantly higher than that of the first two warm periods.