2 中山大学, 大气科学学院, 广东 珠海 519082;
3 安徽省气象台, 安徽 合肥 230031)
厄尔尼诺-南方涛动(El Niño-Southern Oscillation,简称ENSO)会对东亚夏季风产生强烈的影响。在厄尔尼诺发生的次年夏季,西北太平洋通常会出现一个异常的反气旋,从而使得东亚夏季风加强[1~3]。不过,ENSO与东亚夏季风(East Asian Summer Monsoon,简称EASM)的关系并不是一直稳定存在,而是具有年代际的变化。例如20世纪70年代末以来,它们之间的相关性有明显的提高[4~6]。
自20世纪70年代末以来,强厄尔尼诺事件发生的频率明显增多。持续时间长的强厄尔尼诺事件会增强暖池中的海气相互作用[4],并且会增强热带印度洋与西北太平洋的遥相关[2, 7~8],从而增强ENSO和东亚夏季风的关系。然而,仅考虑ENSO这个单一因子并不能完全解释ENSO和东亚夏季风关系的变化[6]。间接通过调制东北亚地区的遥相关[9],正位相的太平洋年代际涛动(Interdecadal Pacific Oscillation,简称IPO)通过增强东亚夏季风的气候态也能够增强ENSO与东亚夏季风的联系[6]。有研究发现,大西洋同样会对东亚季风产生影响[10~12]。自20世纪70年代以来,春季北大西洋涛动(North Atlantic Oscillation,简称NAO)引起的三极子海温异常,引发欧亚大陆的罗斯贝波(Rossby wave)遥相关并增强西北太平洋的副热带高压[10],以及负位相的大西洋多年代际涛动(Atlantic Multidecadal Oscillation,简称AMO)[11],都会增强ENSO和东亚夏季风的联系。通过驱动对流层上层位势高度的正异常并削弱东亚的急流,青藏高原积雪深度的减少也可以增强ENSO和东亚夏季风的联系,导致温带罗斯贝波对厄尔尼诺的响应增强[12]。
同时,气候模式的模拟也验证了厄尔尼诺与东亚夏季风之间联系的年代际变化。有研究发现,模式中的强厄尔尼诺事件会增强ENSO和东亚夏季风的联系[13],这与普遍观测的结论一致。通过CAM3的模拟发现,赤道印度洋的遥相关会增强厄尔尼诺对西北太平洋异常反气旋的影响[7]。通过减弱大西洋的温盐环流,使西北太平洋的气候态湿度增加,从而激发遥相关,因而在北大西洋年代际涛动的负位相时期,更倾向于加强ENSO和东亚夏季风的联系[11]。在人为强迫引起的全球变暖背景下,ENSO和东亚夏季风关系的变化具有很大的不确定性。由于赤道太平洋的中部平均降水增加[14]、赤道印度洋升温和西北太平洋降温[15~16]的影响,衰减周期短的厄尔尼诺事件出现频率增加,会在其达到峰值后的次年夏季结束,并增强东亚夏季风的响应[14~16]。然而,一些研究表明,当赤道印度洋和西北太平洋之间的温度梯度减小[17],或热带印度洋的降水对厄尔尼诺现象的敏感性减弱[18],都会导致两者之间的关系减弱。同时有研究指出,在耦合气候模式中,能够正确模拟平均态海温是模拟出ENSO和东亚夏季风的遥相关作用的关键[19~20]。
不过,并没有多少研究尝试通过更长时间的重建资料来解释ENSO和东亚夏季风关系的变化。Shi和Wang[21]发现,与后半个世纪的小冰河时期相比,近一个世纪以来ENSO变率的增强会同时增强它和东亚夏季风的联系。但是,两者关系的年代际变化尚未清楚。尽管ENSO和东亚夏季风的关系取决于气候平均态[6],但重建资料中气候态的特征仍存在争议。例如,小冰期时代,巴尔米拉岛的化石-珊瑚氧同位素序列[22]、沉积物序列[23]以及全新世晚期的代用资料[24]都表明了气候平均态是类似于厄尔尼诺的分布,但是以热带地区降水为基础的代用资料[25]以及湖北石笋δ18O记录[26]则显示出了类拉尼娜的平均气候态。
由于观测时间较短,所包含的年代际震荡事件较少,因而本文将重点关注更长时间的重建资料,利用时间范围更长的重建数据来研究ENSO和东亚夏季风关系的年代际变化。太平洋海温对于重建资料的太平洋海温气候态存在不确定性,限制了我们对ENSO和东亚夏季风关系的理解,因此,为了帮助理解ENSO和东亚夏季风的关系变化,我们将重建资料结合模式模拟的结果加以验证分析,理解厄尔尼诺次年东亚季风年代际变化的机制。
1 数据和方法 1.1 数据我们采用从1470年到1999年北半球暖季(5~9月)的代用降水格点资料,空间范围为亚洲大陆区域(5°~55°N,60°~135°E),分辨率为0.5°×0.5°。数据是基于正则最大期望法对树轮、冰芯、历史文献和观测数据进行的重建[27]。该重建资料1950~1999年和1930~1949年已分别被校对和核实[27],结果表明重建的结果在亚洲大陆上是有效的。
本研究使用1470~1999年期间500年北半球冬季ENSO指数,该指数是10套ENSO重建的平均值[28~37],其中每个ENSO重建指数已分别进行了标准化处理。在1871~2000年的时间序列中,平均后的指数与哈德莱气候预测与研究中心海表温度数据(HadISST1)[38]在10月至次年3月Niño3指数(5°S~5°N,150°~90°W) 之间的相关性为0.87(p < 0.01)。关于此ENSO重建指数的详细信息可以参见Liu等[39]。
为了比较外部强迫对ENSO和东亚夏季风关系的影响,我们使用了1470年至1999年太阳总辐照度[40]和火山强迫记录[41]的有效太阳辐射(effective solar radiation)数据。这两个强迫因子的结果是基于大气顶部调整后的强迫大小(W/m2)[42]。本研究使用了1902~2016年的东安格利亚大学气候研究中心(CRU)4.0版[43]的月平均降水资料以及HadISST1海表温度数据[38]。
在CMIP5模式中,CESM1是对东亚夏季风和气候态模拟最好的模式之一[44],广泛应用于古气候模拟研究[45~46]。我们使用CESM1模式过去千年多样本模拟计划(CESM-LME)的10个全强迫实验,其中外部强迫包括太阳总辐照度[40]、火山爆发[41]、土地利用[47~48]、温室气体[42]、轨道参数变化[49]和臭氧气溶胶[42]。大气和陆地的模式分辨率约为2°×2°,海洋部分约为1°×1°。关于CESM-LME的更多细节可以参考模式的说明[50]。本文主要关注模式结果中1470年至1999年的部分,用来和重建结果进行比较。
1.2 方法为了确定厄尔尼诺衰减年东亚夏季风年代际变化的主导模态,我们使用经验正交函数(EOF)分析21年滑动的衰减年夏季风的特征。具体是通过合成1470~1999年每21年滑动窗口(窗口中心年份范围为1480~1989年)中厄尔尼诺衰减年夏季的降水异常,然后对1480年至1989年的这510张合成图进行了EOF分析,以研究ENSO和东亚夏季风的关系的年代际变化。对于多集合成员的模式的东亚降水与厄尔尼诺联系,为了保证集合成员之间是同一个模态以及提取模式中的共同表现出来的主要模态,在使用与重建类似的方法对每个集合分别求得滑动合成结果之后,我们将10个集合和时间维度合并为一维(510年×10个集合)进行的EOF分解,从而提取所有集合共同表现出来的年代际信号。在进行EOF计算时,考虑了区域权重的影响。我们使用t检验计算显著性,其中使用了有效自由度[51]来得到实际的样本量。
本文中,我们定义北半球夏季为5月至9月,东亚夏季风的区域为5°~55°N,105°~135°E;Niño3指数为5°S~5°N,150°~90°W区域平均的海表温度异常。当北半球冬季的Niño3指数高于0.5个标准差时,就定义为一次厄尔尼诺事件。
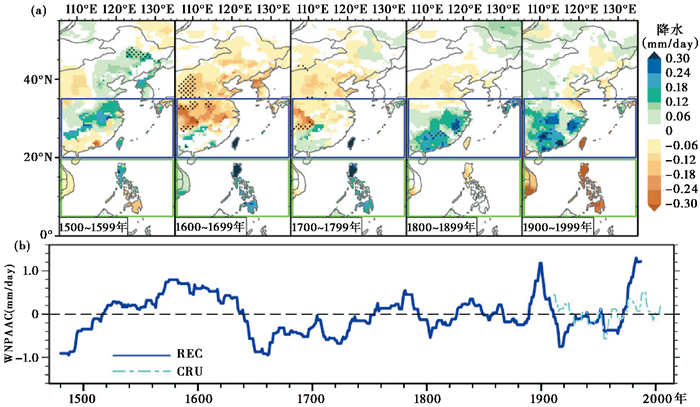
2 重建中厄尔尼诺次年的东亚夏季风异常 2.1 不同世纪厄尔尼诺次年的东亚夏季风异常图 1a显示了过去500年中每个世纪厄尔尼诺次年的东亚夏季风变化。在厄尔尼诺衰减年的夏季,东亚地区会有不同的降水响应。基于观测资料,在厄尔尼诺衰减年夏季,西北太平洋易产生反气旋异常,表现为中南半岛和菲律宾群岛的负降水异常以及东亚地区的正异常[52]。而从重建资料的结果可以看到,过去的5个世纪中,只有19世纪和20世纪存在这种降水异常的特征。19世纪之前,在厄尔尼诺衰减年夏季,菲律宾和中国台湾出现了正降水异常。而17世纪时,除了中国华南地区,华东地区甚至都出现了负降水异常。
|
图 1 基于过去500年重建资料厄尔尼诺次年东亚夏季风异常的时空特征 (a)1500年至2000年中每个世纪厄尔尼诺衰减年夏季合成的东亚降水异常(mm/day),黑色打点区域表示基于t检验超过95 % 置信度的显著区域;(b)蓝色实线是1470年至2000年重建资料(REC)的厄尔尼诺衰减年夏季西北太平洋反气旋异常指数(WNPAAC)的21年滑动平均,其中反气旋指数是根据东亚地区(20°~35°N,105°~135°E)的降水异常减去西北太平洋(5°~20°N,105°~135°E)的降水异常得到,天蓝色虚线为1901年至2016年CRU资料的结果 Fig. 1 Reconstructed El Niño -related EASM anomalies during the last half millennium. (a)The composite East Asian(EA)precipitation anomalies(mm/day)in El Niño decaying summers during each century from 1500 A.D. to 2000 A.D. Stippling indicates anomalies significant above the 95 % confidence level based on student's t-test; (b)The reconstructed 21-year running mean time series(REC, blue solid line)of Western North Pacific Anomalous Anticyclone(WNPAAC)index, which is the EA(20°~35°N, 105°~135°E) precipitation anomaly minus western North Pacific(5°~20°N, 105°~135°E) precipitation anomaly in El Niño decaying summers from 1470 A.D. to 2000 A.D. The results from CRU data(cyan dashed lines)from 1901 A.D. to 2016 A.D. are shown as references |
图 1b给出了21年滑动的厄尔尼诺次年的东亚夏季风降水异常的年代际变化。在过去的5个世纪中,受到厄尔尼诺的影响,西北太平洋反气旋经历了较强的年代际变化。在20世纪的重建资料中,厄尔尼诺衰减年夏季西北太平洋的异常反气旋仅存在于20世纪初和20世纪80年代左右,而气旋异常则出现在20世纪中叶,这与CRU观测结果一致。在过去500年中,在厄尔尼诺衰减年夏季,强的西北太平洋异常气旋发生在17世纪40年代至18世纪20年代的小冰期,且最强时期发生在大约15世纪90年代和17世纪60年代。
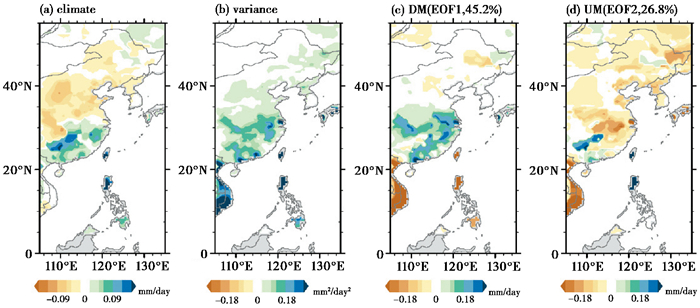
2.2 重建资料中年代际东亚夏季风模态平均而言,过去500年的厄尔尼诺衰减年的东亚季风区表现出异常气旋的特征,它由东亚南部的正降水异常和长江流域以北的负异常组成,两者被长江隔开(图 2a),这主要归因于小冰期时期异常的贡献(图 1)。厄尔尼诺现象引起的东亚夏季风异常变化的方差集中在东南亚热带地区和中国东南部(图 2b)。在过去500年中,与厄尔尼诺现象相关的东亚夏季风降水异常的年代际变化具有两种主要的EOF模态,两种主要模态的解释方差分别为45.2 % 和26.8 %。根据North等[53]的标准,它们在统计学上与其他模态的区别是显著的。
|
图 2 在过去500年中重建的与厄尔尼诺相关的东亚夏季风异常的两个主要模态 1470~2000年厄尔尼诺次年夏季的东亚降水异常(a)合成(mm/day)和(b)21年滑动平均的方差(mm2/day2);1470~2000年厄尔尼诺次年夏季东亚降水异常21年滑动合成的(c)偶极子模态(EOF1)和(d)均一模态(EOF2) Fig. 2 Two leading modes of multi-decadal variations of reconstructed El Niño -related EASM anomaly during the last half millennium. (a)Composite EA precipitation anomalies(mm/day)in post-El Niño summers from 1470 A.D. to 2000 A.D.; (b)Precipitation variance(mm2/day2)of all 21-year sliding composite of post-El Niño summers; (c)Dipole mode(DM, EOF1)and (d) the uniform mode (UM, EOF2)of 21-year sliding composite EA precipitation anomaly in post-El Niño summers from 1470 A.D. to 2000 A.D. |
在厄尔尼诺衰减年夏季,与厄尔尼诺相关的东亚夏季风降水异常的年代际变化的主要模态表现为偶极子模态(Dipole Mode,简称DM),即从中南半岛到菲律宾和中国台湾的西北太平洋地区降水异常为负值,而中国东南地区降水异常为正值(图 2c);第二种模态的分布则为除中国的华南和台湾,以及菲律宾部分地区外,其他地区基本呈现一致的降水异常(图 2d),称为均一模态(Uniform Mode,简称UM)。
图 3描述了主要模态的时间演变。在过去500年里,偶极子模态与西北太平洋异常反气旋指数高度正相关,相关系数为0.92(p < 0.01),而均一模态的相关系数仅为-0.22。这说明西北太平洋异常反气旋的变化主要是由偶极子模态主导的。

|
图 3 重建的厄尔尼诺相关的东亚夏季风异常的年代际变化 线条表现偶极子模态第一主成分的时间序列(PC1)(紫色实线)和21年滑动平均西北太平洋异常反气旋指数(WNPAAC)(黑色虚线,单位mm/day)随时间的演变;阴影表示由太阳总辐照度[40]和火山作用[41]共同合成的有效太阳辐射(W/m2),经过了21年滑动平均处理 Fig. 3 Evolution of multi-decadal variation of reconstructed El Niño -related EASM anomaly. The first principal component (PC1) time series of DM(purple solid line)and 21-year running mean western North Pacific anomalous anticyclone (WNPAAC, black dashed line; mm/day) index. Shading denotes 21-year running mean effective solar radiation(W/m2)consisting of total solar irradiance[40] and volcanic forcing[41] |
由于偶极子模态和西北太平洋异常反气旋指数在过去500年中都没有显著的线性变化趋势(图 3),因而我们计算了偶极子模态与外部自然强迫,即有效太阳辐射强迫之间的关系,有效太阳辐射是由太阳总辐照度[40]和火山强迫[41]相加组成。在1470~2000年期间,偶极子模态与有效太阳辐射显著正相关,相关系数为0.4(p < 0.05),而均一模态则不然。在1850年以前,偶极子模态与有效辐射强迫之间的关系最为显著,相关系数达到了0.57(p < 0.05)。然而自1850年以来,在人为排放温室气体的作用下,这种关系变得很弱(R=0.2)。
综上所述,在厄尔尼诺衰减年夏季,厄尔尼诺影响下的东亚夏季风异常的年代际变化有两种主导模态:东亚地区南部和其北部之间反向变化的偶极子模态,以及东亚区域一致变化的均一模态。而且,在厄尔尼诺发生后的次年夏季,偶极子模态主导了观测到的西北太平洋异常反气旋的年代际变化。1850年以前,偶极子模态与有效太阳辐射高度相关,这意味着在17世纪小冰期厄尔尼诺衰减年夏季,有效太阳辐射的降低与西北太平洋异常气旋出现存在可能的联系。然而在1850年以后,在人为强迫的作用下,偶极子模态与有效太阳辐射之间的这种显著关系消失了。因缺少500年长度的全球大气海洋资料,所以我们将通过模式资料来理解并探究东亚夏季风内部模态的响应机制。
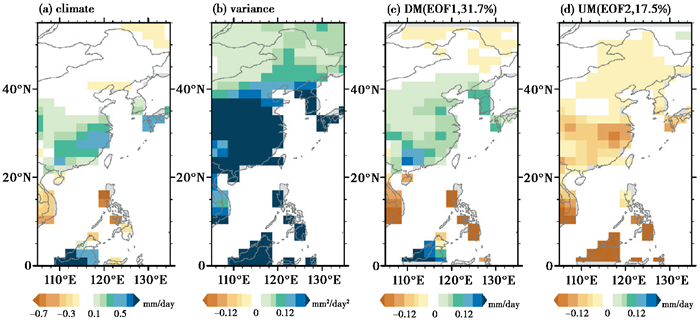
3 厄尔尼诺次年东亚夏季风异常的模拟 3.1 模式中主要模态空间分布特征及与大气的联系我们利用CESM-LME的10套实验结果来研究控制ENSO和东亚夏季风关系变化的基本机制。图 4a表现了厄尔尼诺衰减年夏季的东亚夏季风的平均状态。在厄尔尼诺次年夏季,模式模拟出菲律宾和中南半岛的负降水异常,以及江淮流域以及日本南部的正降水异常的空间特征(图 4a),与20世纪重建资料的结果基本一致(见图 1),反映出西北太平洋异常反气旋的特征。
|
图 4 CESM模式模拟的过去500年厄尔尼诺衰减年东亚夏季风异常的年代际变化 基于CESM-LME的10个集合成员中1470~2000年厄尔尼诺衰减年夏季(a)合成的东亚陆地降水异常(mm/day)以及(b)21年滑动合成的方差(mm2/day2);(c)在CESM-LME的10个集合中,1470~2000年厄尔尼诺次年夏季东亚陆地降水异常21年滑动合成的偶极子模态(EOF1;DM);(d)与(c)一致,但为均一模态(EOF2;UM) Fig. 4 Simulated multi-decadal variation of El Niño -related EASM anomaly during last half millennium. (a)Composite EA land precipitation anomalies(mm/day)in post-El Niño summers from 1470 A.D. to 2000 A.D. based on 10 ensembles of CESM-LME; (b)Precipitation variance(mm2/day2)of all 21-year sliding composites of post-El Niño summers in the 10 ensembles; (c)The DM(EOF1)and (d) the UM(EOF2)of 21-year sliding composite East Asian land precipitation anomaly in post-El Niño summers during 1470~2000 A.D. in the 10 ensembles of CESM-LME |
在厄尔尼诺衰减年,东亚夏季风降水异常在整个东亚地区的不同年份之间也表现出较大的差异(图 4b)。通过同时对这10个集合的21年滑动合成进行EOF分析(具体见方法部分),计算出CESM-LME中与厄尔尼诺相关的东亚夏季风异常的年代际变化。两种主导模态的解释方差分别为31.7 % 和17.5 %,在统计学上可与其他模态区分开。EOF1在西北太平洋和中国东部之间存在偶极降水异常,形成偶极子模态(图 4c);EOF2则在所有东亚地区为同一符号的降水异常,形成均一模态(图 4d)。这些结果表明CESM-LME能够抓住重建中的两个主要模态的主要特征,即偶极子模态和均一模态,因而可以用模式资料探究重建中与两个模态有关潜在的机制。
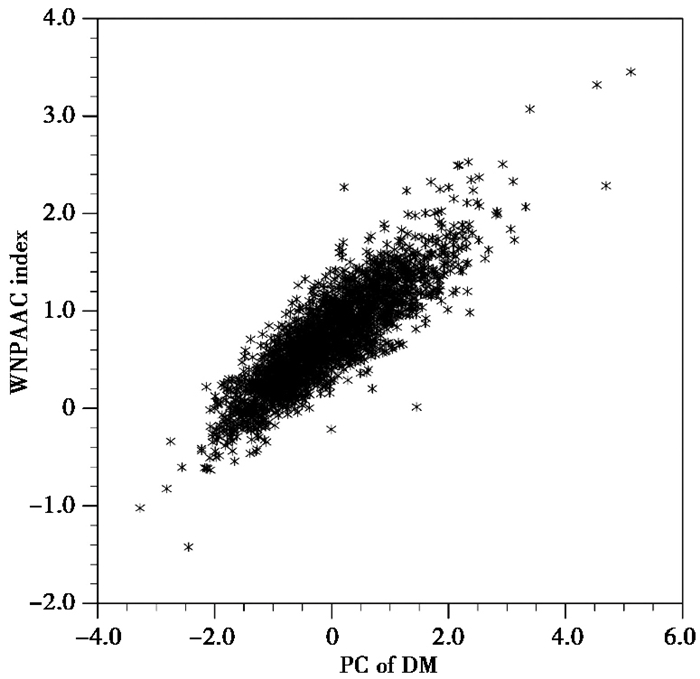
在10个集合成员中,偶极子模态的时间序列与西北太平洋异常反气旋指数之间的关系十分密切(图 5),相关系数为0.87,通过了99 % 显著性检验,但均一模态的时间序列与反气旋指数的相关性仅为-0.01。从图 6a中可以看到,在一些年份,西北太平洋异常反气旋指数甚至为负值,说明在厄尔尼诺衰减年夏季,这种气旋式异常环流在CESM-LME模式中有时也会发生。与西北太平洋异常气旋相关联的是类似拉尼娜空间特征的平均态海温特征,即在西北太平洋和中国东部地区偶极子模态出现的降水异常(图 6b)以及热带太平洋西高东低的海温梯度分布(图 6c)。
|
图 5 CESM-LME的10个集合成员中偶极子模态和西北太平洋异常反气旋指数的关系 横坐标是偶极子模态第一主成分的时间序列,纵坐标是21年滑动平均的厄尔尼诺次年夏季西北太平洋异常反气旋指数 Fig. 5 Simulated relationships between the first principal component(PC1) time series of DM and western North Pacific anomalous anticyclone(WNPAAC)index. Scatterplot is the PC of DM with 21-year running mean WNPAAC index in post-El Niño summers in 10 ensembles of CESM-LME |

|
图 6 CESM-LME中的西北太平洋异常气旋 (a)在过去500年中,CESM-LME的10个集合中,厄尔尼诺衰减年夏季21年滑动平均的西北太平洋反气旋指数(灰线),其中粗黑线表示集合平均,负值年份已用蓝色标出;(b)和(c)分别为西北太平洋异常气旋年份(即(a)中用蓝色标出的年份)合成的21年滑动的降水和海表温度异常(K),黑色箭头为显著的850 hPa风场异常,黑点区域表示通过了95 % 显著性检验 Fig. 6 WNP anomalous cyclones in CESM-LME. (a)21-year running mean western North Pacific anomalous anticyclone(WNPAAC) index(gray lines)in El Niño decay summers during the last half millennium in 10 ensembles of CESM-LME. Thick black line denotes the ensemble mean, and negative WNPAAC index values are highlighted in blue. Shading is the composites 21-year running mean (b) precipitation and (c) SST anomalies (K)for negative WNPAAC index values(highlighted in blue in (a)). Black vectors denote significant wind anomalies at 850 hPa. Stippling indicates anomalies are significant at 95 % confidence level |
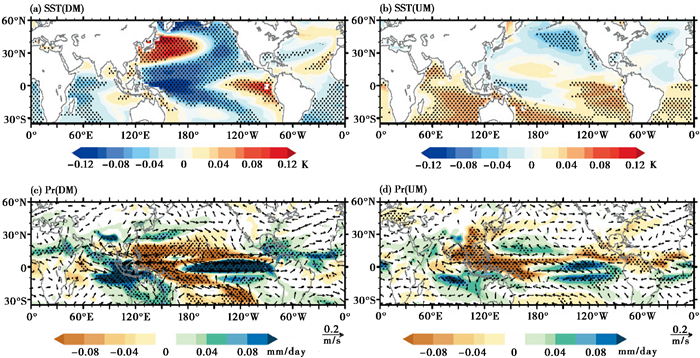
为了研究控制偶极子模态和均一模态的气候平均态,我们将主要模态的时间序列回归到了年代际的变量空间场。对偶极子模态来说(图 7a),在太平洋平均态表现出类似马蹄形的太平洋经向海温模态,并且热带地区海表温度的梯度是自西向东递增的。当这种太平洋经向模态位于暖位相,即对应东太增暖、西太变冷的海表温度分布时,热带西太平洋上空产生强烈辐散,它将通过非绝热的Gill响应[54]激发从菲律宾到印度的异常反气旋,导致反气旋所在的局地降水减少(图 7c)。异常反气旋激发的东亚地区西南风异常,增强水汽平流,使得东亚的降水增多。气候平均态作为背景态,能够影响年际尺度的变化,调制厄尔尼诺次年的东亚夏季风异常,从而形成降水的偶极子模态。
|
图 7 偶极子模态(DM)和均一模态(UM)相关的气候平均态的变化 10个CESM-LME集合中偶极子模态回归到21年滑动平均的(a)海表温度(K)和(c)降水(mm/day)以及850 hPa风场(m/s);(b)和(d)与(a)和(c)相同,但是为均一模态的结果 Fig. 7 Mean-state change associated with UM and DM. Regressed 21-year running mean (a) SST (K)and (b) precipitation(mm/day)and 850-hPa wind(m/s)anomalies onto the principal components of DM during El Niño decaying summers in 10 ensembles of CESM-LME. (c)and (d) are the same as (a) and (b), but for the UM |
对于均一模态的海温(图 7b),气候平均态呈现出全球变暖并且南北半球不对称的模态。赤道太平洋东暖西冷的海温梯度将减弱沃克环流,抑制暖池的降水。太平洋副热带的海温增暖能够激发菲律宾东部的异常气旋,气旋西北侧的北风将抑制东亚上空的降水(图 7d)。因此,当产生图 7b海温平均态时,较易形成由厄尔尼诺引起的东亚夏季风异常的年代际变化的均一模态。
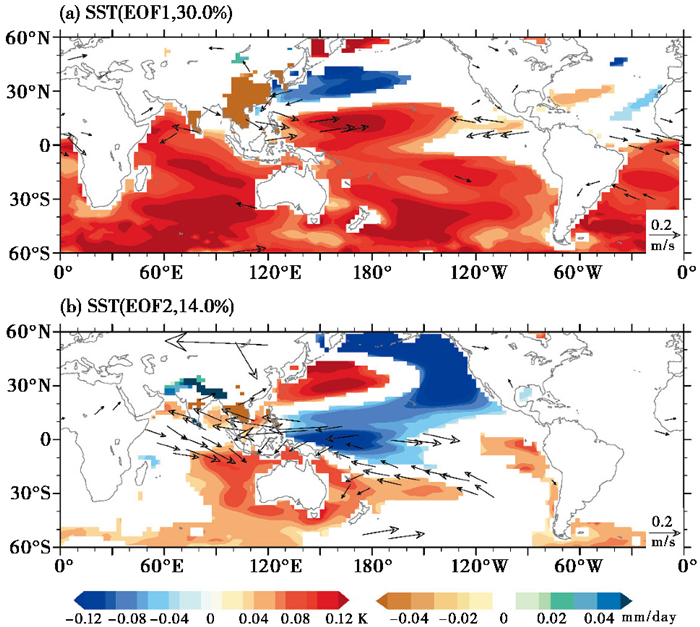
通过对21年滑动平均的北半球夏季海表温度进行EOF分析,我们得到CESM-LME中年代际变化的主要模态(图 8)。第一模态是类似于全球变暖特别是南半球增暖的模态,第二模态类似于太平洋经向模态。偶极子模态与太平洋经向模态显著正相关(0.5,p < 0.01),而均一模态则与全球变暖模态(0.27,p < 0.05)和太平洋经向模态(0.29,p < 0.10)均存在正相关关系。
|
图 8 CESM-LME中年代际变化的两种主要模态 CESM-LME 10个集合中1470~2000年的21年滑动平均海表温度异常(K)的两个主要EOF模态,以及回归的亚洲陆地降水(mm/day)和850 hPa风场(m/s),图中只显示了回归值超过95 % 显著性检验的区域 Fig. 8 Two leading modes of multi-decadal variation in CESM-LME. Two leading EOFs of 21-year running mean SST (K)anomalies in 10 ensembles of CESM-LME during 1470~2000 A.D. Regressed Asian land precipitation(mm/day)and 850-hPa wind(m/s)anomalies on the two modes are also shown. Only anomalies significant at the 95 % confidence level are shown |
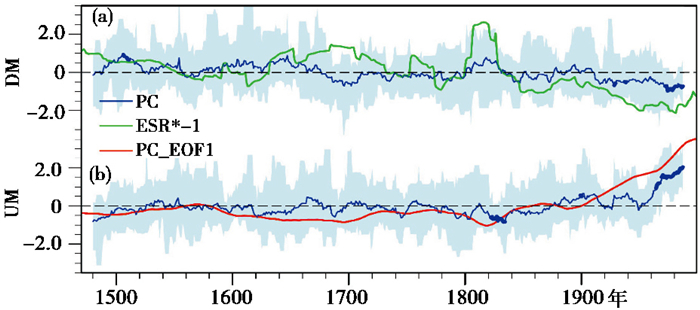
通过对模式10个集合成员的偶极子模态和均一模态的时间序列进行平均,我们可以得到模式对外部强迫的响应结果(图 9)。在1470~1999年期间,偶极子模态的集合平均与有效太阳辐射呈负相关,相关性为-0.53。在1815年附近,能够看到偶极子序列集合平均的波峰对应着太阳辐射的低值期,即对应着1815年坦博拉火山喷发。其中,1850年之前,相关性仅为-0.31,而工业革命(1850年)之后表现为和入射的短波辐射的相关更强,达到了-0.70,特别是在1950年之后,成员间表现为一致的下降趋势,说明模式的偶极子模态与气候变化存在一定的联系。而在19世纪之前,集合成员之间方差较大,只有部分年份的集合平均为显著的,反映出在模式中衰减年东亚季风对外强迫的年代际响应不够强烈。可能是因为实验样本数量较少,10个成员的平均不足以滤掉内部变率的信号,所以没有产生显著的外强迫响应。同时,模式并没有表现出类似于重建中显著的正相关性(图 3),可能与模拟的气候平均态对外强迫响应的差异有关。对于均一模态,其集合平均在近150年内为显著递增的趋势,与全球变暖模态时间序列的集合平均呈正相关,相关性为0.75。
|
图 9 模式对外部强迫的响应 (a)偶极子模态(DM)和(b)均一模态(UM)主成分的时间序列,即分别对应图 4中(c)和(d),其中蓝色实线表示时间序列的集合平均值,浅蓝阴影为10个集合成员的范围;(a)中绿色实线为乘以负号的有效太阳辐射,(b)中红色实线为海温年代际变化第一模态主成分的时间序列,在(a)和(b)蓝色实线加粗的部分表示通过了90 % 的显著性检验,即10个集合里当有8个以上的集合具有相同的符号则定义为显著 Fig. 9 Simulated response to the external forcing. Ensembles and ensemble mean of principal components(PCs) time series of (a)DM and (b) UM, that correspond to the (c) and (d) in Figure 4. Blue solid lines are ensemble mean of PCs, and shading is the range of PCs of all 10 ensemble members. The green line in (a) is the negative effective solar radiation, the red line in (b) is the PC1 time series of annual SST. Years which are significant at the 90 % confidence level, with more than eight out of 10 ensembles having the same sign, are shown in the blue bold in (a) and (b) |
综上所述,CESM-LME可以重现过去500年中与厄尔尼诺相关的东亚夏季风异常的两个主要模态,即偶极子模态和均一模态。模拟的偶极子模态与太平洋经向海温模态显著相关,而均一模态与全球变暖和太平洋经向海温模态均存在相关关系。在对外部强迫的响应方面,偶极子模态的集合平均值与有效太阳辐射并未得到重建资料中显著的正相关关系。均一模态对外部强迫的响应则反映出与全球变暖存在联系,根据克劳修斯-克拉伯龙方程,全球气温的增长会使得饱和水汽压迅速增加,从而导致东亚季风区降水增多。
4 结语通过对重建资料的分析,我们发现在厄尔尼诺衰减年夏季,厄尔尼诺遥相关对东亚季风区的影响并不是一直稳定的,而是存在年代际的变化,特别是在17世纪小冰期出现了西北太平洋异常气旋的特征(图 1)。通过对厄尔尼诺衰减年夏季进行21年滑动合成东亚夏季风降水异常的EOF分析发现,厄尔尼诺引起的东亚夏季风异常的年代际变化有两种主要模态。第一种是偶极子模态,即中南半岛和菲律宾降水为负异常,中国东部地区降水为正异常(图 2);第二种模态为均一模态,即除华南部分地区和菲律宾外,其他东亚地区均为负降水异常。在厄尔尼诺衰减年夏季,偶极子模态对西北太平洋异常反气旋的年代际变化存在联系,并与有效太阳辐射呈显著正相关(图 3),因而可以得出,厄尔尼诺次年夏季西北太平洋异常反气旋的消失可能是因有效太阳辐射下降造成的。
CESM-LME可以重现偶极子模态和均一模态的空间特征(图 4),模拟的西北太平洋异常反气旋也与偶极子模态存在紧密联系(图 5),从而对重建资料的结果做了进一步的验证。模拟的偶极子模态与暖的太平洋经向分布的海表温度异常显著相关,而模拟的均一模态与全球变暖和太平洋经向模态海表温度异常均存在相关关系(图 7)。在对外部强迫的响应中,模拟的偶极子模态的集合平均与有效太阳辐射呈负相关(图 9),均一模态的集合平均与模拟的全球变暖趋势有正相关关系。
结合重建资料与模式结果可以看到,偶极子模态与太平洋经向模态呈负相关,与有效太阳辐射呈正相关,这表明在小冰期,有效太阳辐射位于低值期,太平洋呈现出类似于厄尔尼诺的暖位相分布,与之前基于降水重建资料对ENSO特征的发现一致[25]。然而在模拟中,偶极子模态的对外强迫的响应呈现出和重建资料相反的负相关的结果,不过各个集合成员之间并没有完全一致,集合平均存在较大的方差,在这里反映出重建和模式模拟在太平洋海温对外强迫响应的偏差。
致谢: 感谢CESM-LME项目组提供的公开实验数据。感谢审稿人和编辑部杨美芳老师对本文提出的宝贵的建议及修改意见。
| [1] |
Wang Bin, Wu Renguang, Fu Xiouhua. Pacific-East Asian teleconnection: How does ENSO affect East Asian climate?[J]. Journal of Climate, 2000, 13(9): 1517-1536. DOI:10.1175/1520-0442(2000)013<1517:PEATHD>2.0.CO;2 |
| [2] |
Xie Shangping, Hu Kaiming, Hafner Jan, et al. Indian ocean capacitor effect on Indo-Western Pacific climate during the summer following El Niño[J]. Journal of Climate, 2009, 22(3): 730-747. DOI:10.1175/2008JCLI2544.1 |
| [3] |
Zhang Renhe, Sumi Akimasa, Kimoto Masahide. Impact of El Niño on the East Asian monsoon[J]. Journal of the Meteorological Society of Japan SeriesⅡ, 1996, 74(1): 49-62. DOI:10.2151/jmsj1965.74.1_49 |
| [4] |
Wang Bin, Yang Jing, Zhou Tianjun, et al. Interdecadal changes in the major modes of Asian-Australian monsoon variability: Strengthening relationship with ENSO since the late 1970s[J]. Journal of Climate, 2008, 21(8): 1771-1789. DOI:10.1175/2007JCLI1981.1 |
| [5] |
Li Jianping, Wu Zhiwei, Jiang Zhihong, et al. Can global warming strengthen the East Asian summer monsoon?[J]. Journal of Climate, 2010, 23(24): 6696-6705. DOI:10.1175/2010JCLI3434.1 |
| [6] |
Song Fengfei, Zhou Tianjun. The crucial role of internal variability in modulating the decadal variation of the East Asian summer monsoon-ENSO relationship during the twentieth century[J]. Journal of Climate, 2015, 28(18): 7093-7107. DOI:10.1175/JCLI-D-14-00783.1 |
| [7] |
Huang Gang, Hu Kaiming, Xie Shangping. Strengthening of tropical Indian Ocean teleconnection to the Northwest Pacific since the mid-1970s: An atmospheric GCM study[J]. Journal of Climate, 2010, 23(19): 5294-5304. DOI:10.1175/2010JCLI3577.1 |
| [8] |
Chowdary J S, Xie Shang-Ping, Tokinaga Hiroki, et al. Interdecadal variations in ENSO teleconnection to the Indo-Western Pacific for 1870-2007[J]. Journal of Climate, 2012, 25(5): 1722-1744. DOI:10.1175/JCLI-D-11-00070.1 |
| [9] |
Yoon Jinhee, Yeh Sang-Wook. Influence of the Pacific Decadal Oscillation on the relationship between El Niño and the Northeast Asian summer monsoon[J]. Journal of Climate, 2010, 23(17): 4525-4537. DOI:10.1175/2010JCLI3352.1 |
| [10] |
Wu Zhiwei, Li Jianping, Jiang Zhihong, et al. Possible effects of the North Atlantic Oscillation on the strengthening relationship between the East Asian summer monsoon and ENSO[J]. International Journal of Climatology, 2012, 32(5): 794-800. DOI:10.1002/joc.2309 |
| [11] |
Chen Wei, Lu Riyu, Dong Buwen. Intensified anticyclonic anomaly over the western North Pacific during El Niño decaying summer under a weakened Atlantic thermohaline circulation[J]. Journal of Geophysical Research: Atmospheres, 2014, 119(24): 637-650. DOI:10.1002/2014JD022199 |
| [12] |
Wu Zhiwei, Li Jianping, Jiang Zhihong, et al. Modulation of the Tibetan Plateau snow cover on the ENSO teleconnections: From the East Asian summer monsoon perspective[J]. Journal of Climate, 2012, 25(7): 2481-2489. DOI:10.1175/JCLI-D-11-00135.1 |
| [13] |
Li Ying, Lu Riyu, Dong Buwen. The ENSO-Asian monsoon interaction in a coupled ocean-atmosphere GCM[J]. Journal of Climate, 2007, 20(20): 5164-5177. DOI:10.1175/JCLI4289.1 |
| [14] |
Chen Wei, Lee June-Yi, Ha Kyung-Ja, et al. Intensification of the western North Pacific anticyclone response to the short decaying El Niño event due to greenhouse warming[J]. Journal of Climate, 2016, 29(10): 3607-3627. DOI:10.1175/JCLI-D-15-0195.1 |
| [15] |
Zheng Xiaotong, Xie Shangping, Liu Qinyu. Response of the Indian Ocean basin mode and its capacitor effect to global warming[J]. Journal of Climate, 2011, 24(23): 6146-6164. DOI:10.1175/2011JCLI4169.1 |
| [16] |
Hu Kaiming, Huang Gang, Zheng Xiaotong, et al. Interdecadal variations in ENSO influences on Northwest Pacific-East Asian early summertime climate simulated in CMIP5 Models[J]. Journal of Climate, 2014, 27(15): 5982-5998. DOI:10.1175/JCLI-D-13-00268.1 |
| [17] |
Jiang Wenping, Huang Gang, Huang Ping, et al. Weakening of Northwest Pacific anticyclone anomalies during post-El Niño summers under global warming[J]. Journal of Climate, 2018, 31(9): 3539-3555. DOI:10.1175/JCLI-D-17-0613.1 |
| [18] |
He Chao, Zhou Tianjun, Li Tim. Weakened anomalous western North Pacific anticyclone during an El Niño-decaying summer under a warmer climate: Dominant role of the weakened impact of the tropical Indian Ocean on the atmosphere[J]. Journal of Climate, 2019, 32(1): 213-230. DOI:10.1175/JCLI-D-18-0033.1 |
| [19] |
Turner A G, Inness P M, Slingo J M. The role of the basic state in the ENSO-monsoon relationship and implications for predictability[J]. Quarterly Journal of the Royal Meteorological Society, 2005, 131(607): 781-804. DOI:10.1256/qj.04.70 |
| [20] |
Annamalai H, Hamilton K, Sperber K R. The South Asian summer monsoon and its relationship with ENSO in the IPCC AR4 simulations[J]. Journal of Climate, 2007, 20(6): 1071-1092. DOI:10.1175/JCLI4035.1 |
| [21] |
Shi Hui, Wang Bin. How does the Asian summer precipitation-ENSO relationship change over the past 544 years?[J]. Climate Dynamics, 2018, 52(7-8): 4583-4598. DOI:10.1007/s00382-018-4392-z |
| [22] |
Cobb K M, Charles C D, Cheng H, et al. El Nino/Southern Oscillation and tropical Pacific climate during the last millennium[J]. Nature, 2003, 424(6946): 271-276. DOI:10.1038/nature01779 |
| [23] |
Overpeck J T, Cole J E. El Niño/Southern Oscillation and changes in the zonal gradient of tropical Pacific sea surface temperature over the last 1.2 ka[J]. PAGES News, 2010, 18(1): 32-34. DOI:10.22498/pages.18.1.32 |
| [24] |
Graham Nicholas E, Hughes Malcolm K, Ammann Caspar M, et al. Tropical Pacific-mid-latitude teleconnections in medieval times[J]. Climatic Change, 2007, 83(1-2): 241-285. DOI:10.1007/s10584-007-9239-2 |
| [25] |
Yan Hong, Sun Liguang, Wang Yuhong, et al. A record of the Southern Oscillation index for the past 2, 000 years from precipitation proxies[J]. Nature Geoscience, 2011, 4(9): 611-614. DOI:10.1038/ngeo1231 |
| [26] |
张伟宏, 陈仕涛, 汪永进, 等. 小冰期东亚夏季风快速变化特征: 湖北石笋记录[J]. 第四纪研究, 2019, 39(3): 765-774. Zhang Weihong, Chen Shitao, Wang Yongjin, et al. Rapid change in the East Asian summer monsoon: Stalagmite records in Hubei, China[J]. Quaternary Sciences, 2019, 39(3): 765-774. |
| [27] |
Feng Song, Hu Qi, Wu Qianru, et al. A gridded reconstruction of warm season precipitation for Asia spanning the past half millennium[J]. Journal of Climate, 2013, 26(7): 2192-2204. DOI:10.1175/JCLI-D-12-00099.1 |
| [28] |
Stahle D W, Cleaveland M K, Therrell M D, et al. Experimental dendroclimatic reconstruction of the Southern Oscillation[J]. Bulletin of the American Meteorological Society, 1998, 79(10): 2137-2152. DOI:10.1175/1520-0477(1998)079<2137:EDROTS>2.0.CO;2 |
| [29] |
Mann M E, Gille Ed, Overpeck Jonathan, et al. Global temperature patterns in past centuries: An interactive presentation[J]. Earth Interactions, 2000, 4(4): 1. DOI:10.1175/1087-3562(2000)004<0001:GTPIPC>2.3.co;2 |
| [30] |
D'Arrigo R, Cook E R, Wilson R J, et al. On the variability of ENSO over the past six centuries[J]. Geophysical Research Letters, 2005, 32(3): L03711. DOI:10.1029/2004GL022055 |
| [31] |
Cook E R, D'Arrigo R D, Anchukaitis K J. ENSO reconstructions from long tree-ring chronologies: Unifying the differences[C]//Proceedings of the A Special Workshop on Reconciling ENSO Chronologies for the Past. Moorea, French Polynesia, 2008, 500: 15.
|
| [32] |
Braganza Karl, Gergis Joılle L, Power Scott B, et al. A multiproxy index of the El Niño-Southern Oscillation, A. D. 1525-1982[J]. Journal of Geophysical Research, 2009, 114(D5): D05106. DOI:10.1029/2008JD010896 |
| [33] |
Wilson R, Cook E, D'Arrigo R, et al. Reconstructing ENSO: The influence of method, proxy data, climate forcing and teleconnections[J]. Journal of Quaternary Science, 2010, 25(1): 62-78. DOI:10.1002/jqs.1297 |
| [34] |
McGregor S, Timmermann A, Timm O. A unified proxy for ENSO and PDO variability since 1650[J]. Climate of the Past, 2010, 6(1): 1-17. DOI:10.5194/cp-6-1-2010 |
| [35] |
Li Jinbao, Xie Shangping, Cook Edward R, et al. Interdecadal modulation of El Niño amplitude during the past millennium[J]. Nature Climate Change, 2011, 1(2): 114-118. DOI:10.1038/nclimate1086 |
| [36] |
Emile-Geay J, Cobb K M, Mann M E, et al. Estimating central equatorial Pacific SST variability over the past millennium. Part Ⅱ: Reconstructions and implications[J]. Journal of Climate, 2013, 26(7): 2329-2352. DOI:10.1175/JCLI-D-11-00511.1 |
| [37] |
Li Jinbao, Xie Shangping, Cook Edward R, et al. El Niño modulations over the past seven centuries[J]. Nature Climate Change, 2013, 3(9): 822-826. |
| [38] |
Rayner N A A, Parker De E, Horton E B, et al. Global analyses of sea surface temperature, sea ice, and night marine air temperature since the late nineteenth century[J]. Journal of Geophysical Research: Atmospheres, 2003, 108(D14): 4407. DOI:10.1029/2002JD002670 |
| [39] |
Liu Fei, Li Jinbao, Wang Bin, et al. Divergent El Niño responses to volcanic eruptions at different latitudes over the past millennium[J]. Climate Dynamics, 2018, 50(9-10): 3799-3812. DOI:10.1007/s00382-017-3846-z |
| [40] |
Vieria L E, Solanki Sami K, Krivova N A, et al. Evolution of the solar irradiance during the Holocene[J]. Astronomy and Astrophysics, 2011, 531: A6. DOI:10.1051/0004-6361/201015843 |
| [41] |
Gao C C, Robock A, Ammann C. Volcanic forcing of climate over the past 1500 years: An improved ice core-based index for climate models[J]. Journal of Geophysical Research, 2008, 113(D23): D23111. DOI:10.1029/2008JD010239 |
| [42] |
Schmidt G A, Jungclaus J H, Ammann C M, et al. Climate forcing reconstructions for use in PMIP simulations of the last millennium(v1.0)[J]. Geoscientific Model Development, 2011, 4(1): 33-45. DOI:10.5194/gmd-4-33-2011 |
| [43] |
Harris I C, Jones P D. CRU TS4.00: Climatic Research Unit (CRU) Time-Series (TS) version 4.00 of high resolution gridded data of month-by-month variation in climate(Jan. 1901-Dec. 2015)[DB/OL]. Centre for Environmental Data Analysis, 2017, doi: 10.5285/edf8febfdaad48abb2cbaf7d7e846a86.
|
| [44] |
Huang Fang, Xu Zhongfeng, Guo Weidong. Evaluating vector winds in the Asian-Australian monsoon region simulated by 37 CMIP5 models[J]. Climate Dynamics, 2019, 53(1-2): 491-507. |
| [45] |
万凌峰, 刘健, 高超超, 等. 全新世火山喷发对温度变化趋势影响的模拟研究[J]. 第四纪研究, 2020, 40(6): 1597-1610. Wan Lingfeng, Liu Jian, Gao Chaochao, et al. Study about influence of the Holocene volcanic eruptions on temperature variation trend by simulation[J]. Quaternary Sciences, 2020, 40(6): 1597-1610. |
| [46] |
彭友兵, 程海, 陈凯, 等. 过去千年中国东部持续性严重干旱事件的模拟研究[J]. 第四纪研究, 2019, 39(2): 282-293. Peng Youbing, Cheng Hai, Chen Kai, et al. Modeling study of severe persistent drought events over Eastern China during the last millennium[J]. Quaternary Sciences, 2019, 39(2): 282-293. |
| [47] |
Pongratz J, Raddatz T, Reick C H, et al. Radiative forcing from anthropogenic land cover change since A. D. 800[J]. Geophysical Research Letters, 2009, 36(2): L02709. DOI:10.1029/2008GL036394 |
| [48] |
Hurtt G C, Chini L P, Frolking S, et al. Harmonization of land-use scenarios for the period 1500-2100:600 years of global gridded annual land-use transitions, wood harvest, and resulting secondary lands[J]. Climatic Change, 2011, 109(1-2): 117-161. DOI:10.1007/s10584-011-0153-2 |
| [49] |
Berger André L. Long-term variations of daily insolation and Quaternary climatic changes[J]. Journal of the Atmospheric Sciences, 1978, 35(12): 2362-2367. DOI:10.1175/1520-0469(1978)035<2362:LTVODI>2.0.CO;2 |
| [50] |
Otto-Bliesner Bette L, Brady Esther C, Fasullo John, et al. Climate variability and change since 850 CE: An ensemble approach with the Community Earth System Model[J]. Bulletin of the American Meteorological Society, 2016, 97(5): 735-754. DOI:10.1175/BAMS-D-14-00233.1 |
| [51] |
Livezey Robert E, Chen W Y. Statistical field significance and its determination by Monte Carlo techniques[J]. Monthly Weather Review, 1983, 111(1): 46-59. DOI:10.1175/1520-0493(1983)111<0046:SFSAID>2.0.CO;2 |
| [52] |
Li Tim, Wang Bin, Wu Bo, et al. Theories on formation of an anomalous anticyclone in western North Pacific during El Niño: A review[J]. Journal of Meteorological Research, 2018, 31(6): 987-1006. DOI:10.1007/s13351-017-7147-6 |
| [53] |
North Gerald R, Bell Thomas L, Cahalan Robert F, et al. Sampling errors in the estimation of empirical orthogonal functions[J]. Monthly Weather Review, 1982, 110(7): 699-706. DOI:10.1175/1520-0493(1982)110<0699:SEITEO>2.0.CO;2 |
| [54] |
Gill A E. Some simple solutions for heat-induced tropical circulation[J]. Quarterly Journal of the Royal Meteorological Society, 1980, 106(449): 447-462. DOI:10.1002/qj.49710644905 |
2 School of Atmospheric Sciences, Sun Yat-Sen University, Zhuhai 519082, Guangdong;
3 Anhui Meteorology Bureau, Hefei 230031, Anhui)
Abstract
During the summer of El Niño decay years, anomalous anticyclones are usually generated in the western North Pacific Ocean and strengthen the East Asian summer monsoon(EASM). A normalized average of 10 reconstructed Niño index is used to find El Niño cases. Based on precipitation reconstructions over the East Asian for the past 500 years during 1470~1999 A.D., we find that this relationship between El Niño and East Asian summer winds does not occur steadily, but with interdecadal oscillations. In particular, during the summer of the Little Ice Age El Niño decay year in the 17th century, cyclonic anomalies occurred over the western North Pacific. Through EOF method, we find two dominant modes of interdecadal variability of El Niño-induced EASM anomaly: the first is a dipole mode, which exhibits negative precipitation anomalies over the Indochina Peninsula and the Philippine Islands, and increased precipitation over Eastern China; the second is a uniform mode with consistent variability over East Asia. During the summer of El Niño decay years, the interdecadal variability of the anomalous Western North Pacific anticyclone is mainly controlled by the dipole mode and is positively correlated with the effective solar radiation. During the Little Ice Age, the solar irradiance decreases dramatically, which leads to cyclonic anomalies in the Western North Pacific during the summer of the decay year.CESM Last Millennium Ensemble is used to understand the mechanisms and to compensate for the lack of global circulation and temperature data in the reconstruction. Through a similar EOF method after jointing time series from 10 ensembles into one series, model simulations can reproduce the dipole and uniform modes, and the interdecadal variability of anticyclones is also found be caused by the simulated dipole mode. From the perspective of internal variability, the dipole mode is associated with an El Niño-like Pacific sea surface temperature mean state, while the uniform mode is correlated with a combined global warming and Pacific meridional mode. When focusing on the response to external forcing, the model ensemble mean is negatively correlated with the effective solar radiation in contrast to the reconstructed data. Huge variance among ensemble members and inconsistence of external forced relation compared with reconstructions indicate problems on the simulated response to external forcing in CESM. 2021, Vol.41

