2 南方海洋科学与工程广东省实验室(广州), 广东 广州 511458;
3 广东海洋大学海洋工程学院, 广东 湛江 524088;
4 广西大学珊瑚礁研究中心, 广西南海珊瑚礁研究重点实验室, 广西大学海洋学院, 广西 南宁 530004;
5 韩山师范学院地理系, 广东 潮州 521041)
定量重建地质历史时期年分辨率的温度变化历史,有助于理解过去环境变化的特征、当前所处的状态以及未来的变化趋势和幅度。目前,高分辨率环境记录主要集中在陆地的高纬度区域[1~7]。尽管在热带海洋中已经开展了一系列重要研究[8~14],但是月-年分辨率的连续长序列记录依然相对较少[5, 14]。热带海洋环境的珊瑚记录主要集中在最近200年,只有少数连续的月-年分辨率记录能够延伸到小冰期早期[14~18]。
生长于热带海洋中的造礁珊瑚,因其对热带海洋环境如表层海水温度(SST)、降雨量、盐度、酸度、光照、浑浊度等变化的敏感响应,而成为记录月-年分辨率环境变化的主要载体,特别是在高分辨率(月-季-年)环境记录方面,具有不可替代的作用[19~23]。过去的二十多年,月-年分辨率的珊瑚古环境记录,主要集中在对珊瑚骨骼元素比值和氧碳稳定同位素等代用指标的研究[14, 24],并取得了许多重要进展[12, 14, 18, 25~26]。利用珊瑚骨骼生长率(即每年生长宽度,mm/a或cm/a)重建海温变化等研究,需要长序列样品作为支撑,受珊瑚芯获取困难等限制,在过去二十多年,该研究并没有取得重要进展。近年来,随着研究深入,在建立长序列海温变化方面,其作用再次受到重视[16, 27~33]。
珊瑚骨骼具有像树木年轮[34]一样的年生长层结构,是测量珊瑚生长率的前提。珊瑚生长率与海温之间的显著相关关系,是定量重建海温的基础。珊瑚生长率作为定量重建表层海水温度(本文均简称为海温)的指标,主要有以下4个优势:1)全记录性。珊瑚骨骼在全年不间断生长,能够记录到周围水体环境的全年信息;2)直观性。珊瑚骨骼具有清晰的年生长层,可以通过对等比例的珊瑚骨骼X光片的直接测量,获得珊瑚生长率信息;3)无损分析。对珊瑚骨骼生长率的测量,不需要破坏珊瑚样品结构,在保证样品完整的情况下获得测量数据;4)年代可靠。取一年的生长量样品(约200 mg)进行铀系测年,结合珊瑚年层年代学(计数年层),可以建立精准可靠的年代框架。正因为具有上述优势,珊瑚生长率成为研究海温的重要代用指标。早在1937年,我国学者马廷英先生通过测量珊瑚骨骼微结构的周期变化,指出珊瑚生长具有“寒年短,暖年长”的现象[35]。随着研究深入,人们也发现,不同珊瑚种属的生长率与海温关系模式不同[16, 28~29, 35]。加勒比海海域的铁星珊瑚(Siderastrea siderea coral)生长率与海温具有显著的负相关关系[16, 29];而在印度洋-太平洋海域的滨珊瑚(Porites coral),其生长率与海温之间具有显著的正相关关系[28, 30, 36~40]。但均可以通过珊瑚生长率与海温之间的显著相关性,建立线性转换方程,并定量重建海温。当然,珊瑚生长率重建海温也存在一些不确定性因素。比如:1)珊瑚生长也受到非温度因素影响。珊瑚白化可能影响珊瑚骨骼生长,温室效应也会对珊瑚钙化造成影响。De'ath等[33]认为,大气二氧化碳(CO2)浓度持续增加、全球变暖和人类活动等是影响珊瑚骨骼生长的重要因素。2)采样和(或)切片的影响。如果珊瑚芯样品不是垂直于珊瑚年生长层钻取,切片方向不垂直于珊瑚年生长层等,均可能引起生长率测量的人为偏差[16]。
目前研究认为,海温仍是控制珊瑚骨骼生长率的主要因素[30, 35]。Cooper等[32]也认为海温是促进珊瑚生长的主要因素,随着海温增加,珊瑚生长率也随之增加;在南海,Nie等[37, 41]发现滨珊瑚生长率与实测海温之间存在显著的正相关关系,这一关系也得到了进一步研究的证实[27, 38~39, 42]。在上述建立生长率与海温关系的基础上,张会领等[27]和黄博津等[43]用西沙群岛滨珊瑚生长率,定量重建西沙海域中晚全新世不同时段的海温;林丽芳等[31]结合西沙群岛和黄岩岛的珊瑚生长率,定量重建了1780~2013 A.D. 时段的海温。
近年来,在南海及周边海域,也开展了一系列月年分辨率[12~13, 25~26, 42, 44~47]以及年代际-多年代际尺度的环境记录研究[48~50]。Song等[26]利用西沙海域月分辨率的珊瑚氧同位素(δ18O),定量重建了183年(1818~2000 A.D.)的冬季风变化历史;Han等[44, 51]利用西沙群岛月分辨率的珊瑚氧同位素,定量重建了158年(1851~2008 A.D.)的赤道辐合带(ITCZ)和ENSO活动;Liu等[13]利用海南岛东岸的月分辨率的锶/钙(Sr/Ca)比值,定量重建了121年(1876~1996 A.D.)的琼东上升流变化特征;Deng等[25, 52]根据海南岛东岸5条年分辨率的珊瑚Sr/Ca和氧同位素组合序列,定量重建了近千年来的海温和降雨等以及1853~2011 A.D. 太平洋年代际涛动(PDO);最近,Ramos等[18]利用中国台湾南部月分辨率的珊瑚Sr/Ca和氧同位素组合,定量重建了225年(1788~2013 A.D.)的海温序列。包括上述这些在内的环境记录,对认识和理解南海海域在全新世,特别是最近200年的环境变化特征具有重要意义。然而,受珊瑚自身生长时段主要集中在约100~200年等因素限制,目前全球月年分辨率的珊瑚研究记录主要集中在工业革命以来的时段[14, 19]。本文根据新增的4条西沙群岛滨珊瑚生长率序列和1条已经发表的YXN1-2序列[27],定量重建近500年(1520~2007 A.D.)连续的西沙海温年际变化序列,这将是对全球高分辨率海洋环境记录的重要补充,也有助于进一步理解小冰期以来热带海洋环境变化历史。
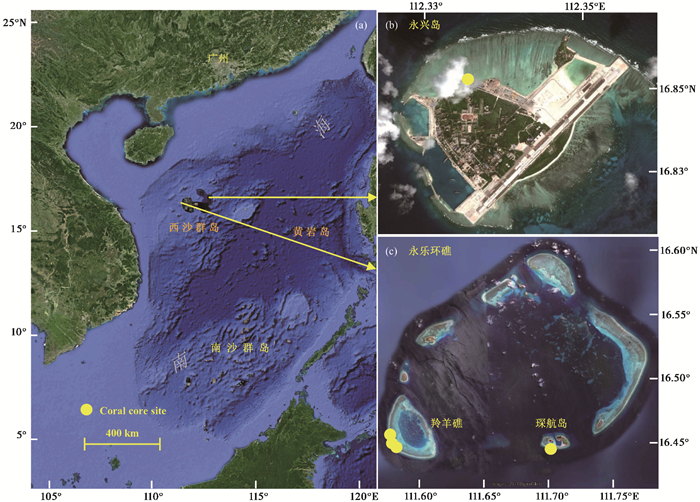
1 研究区域、样品和方法本文研究样品取自南海西沙群岛(15.76°~17.13°N,111.18°~112.90°E)的永兴岛、琛航岛和羚羊礁(图 1)。西沙海域属于热带季风气候[37],根据永兴岛海洋观测站1961~2007 A.D. 海温资料统计,该海域海温平均值27.4 ℃;全年最低值出现在12月至次年2月,平均24.5 ℃;最高值出现在5~9月,平均29.5 ℃。其水文条件非常适合珊瑚群落的生长发育[53]。本文样品均为滨珊瑚(Porites coral),YXN1-2于2008年6月采自永兴岛礁坡,其生长率序列请见张会领等[27, 40];其余4条样品于2013年7月采自永乐环礁的琛航岛(CH-4-1)和羚羊礁(LYJ-7、LYJ-10和LYJ-12-2)礁坪的风暴珊瑚石,取样工具为水下液压钻机。垂直于珊瑚生长层方向,钻取直径约68 mm的珊瑚芯,取芯后用同样直径的水泥柱封住珊瑚芯孔,以免珊瑚块体遭到钻孔生物侵蚀等。研究区域和采样位置如图 1所示。
|
图 1 研究区域和样品位置示意图 (a)南海(South China Sea(SCS));(b)永兴岛(Yongxingdao Island);(c)永乐环礁(Yongle atoll)黄色实心圆点为珊瑚芯分布位置示意图;图片均截取自谷歌卫星图(http://maps.google.com/) Fig. 1 Study area and locational distribution of coral core samples. The yellow solid dots are locational distribution of coral core samples. Three maps are taken from Google satellite images(http://maps.google.com/) |
在实验室,用切片机将上述柱状珊瑚芯切成约7 mm厚的薄板。取中间一片放入浓度为10%的双氧水中浸泡24 h[21],然后将珊瑚切片放入超声波仪中并加入去离子水,超声波清洗4次,每次20 min,以去除样品中的有机质、盐分和切片孔隙中的粉末残留等物质。最后,将清洗后的珊瑚切片放入40 ℃的恒温烘箱中烘干以供后续使用。
在珊瑚切片未受污染的位置(图 2)取大约200 mg样品用于U-Th测年,本文U-Th年龄(表 1)在澳大利亚昆士兰大学同位素年代学实验室测试完成,样品的处理及测试方法见相关文献[54~56]。

|
图 2 本文新增的西沙群岛珊瑚样品X光正片以及测年点位置(黑色方块)和年龄(黑色字体,见表 1) 右边放大图为结合珊瑚U-Th年龄和年层计年法而开展的年层标定;一对黑白相间条带的宽度为一年生长量,即珊瑚生长率(mm/a) Fig. 2 Positive X-ray images of the coral skeletons added in this study from Xishaqundao Islands, and the positions of subsamples used for U-Th dating(Black rectangle)and the results of U-Th age(Table 1). The width of each black-white couplet represents the growth over one year, that is growth rate(mm/a), which enables annual layer counting(e.g. on the right) |
| 表 1 西沙群岛珊瑚U-Th测年数据 Table 1 Results of U-Th dating(with 2σ error) of dead Porites coral in the Xishaqundao Islands |
对前处理后的珊瑚骨骼切片,利用医用X光透视机拍摄等比例的X光片,并利用专业软件(DICOM Explorer)处理X光负片,获得X光正片灰度图像。在X光正片上,珊瑚骨骼影像表现为清晰的深浅相间的高-低密度条带(图 2)。一般情况下,每对高-低密度条带的宽度代表珊瑚骨骼一年的生长量[40, 57~58],即生长率(mm/a)。利用图片处理软件(Photoshop)对等比例的珊瑚骨骼图像进行拼接,获得每条珊瑚切片完整的灰度图像(图 2)。需要指出的是,在采样和后期切片过程中,我们已经充分注意到取芯和切片对生长率的可能影响,已尽量降低人为因素对生长率的影响。
目前,关于珊瑚生长率的测量主要有3种方法[40]。第一种采用显微光学密度计;第二种采用珊瑚生长率测量软件即Coral-XDS;第三种采用图片处理软件(Photoshop)的测量工具。本文主要采用第三种测量方法,在X光正片上,以白色条带中间为起止点(冬季-冬季),一对黑-白色条带的宽度作为一年生长量进行测量,并获得每条珊瑚芯的生长率数据。
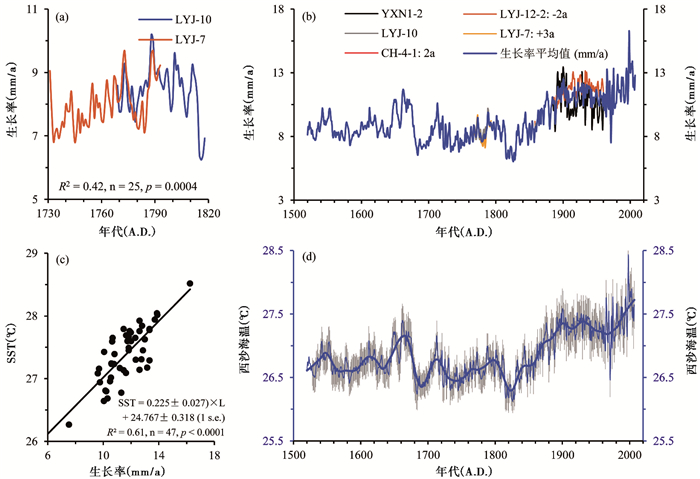
2 结果4条珊瑚芯的高精度铀系年龄见表 1。结合4个U-Th年龄,以珊瑚测年点为基准,通过计数珊瑚骨骼年层,标定每条样品的年代范围(图 2)。首先,本文珊瑚样品均具有清晰可辨的年生长层(图 2)和高精度的U-Th年龄控制(表 1);其次,YXN1-2为现代活珊瑚样品,且生长连续;最后,我们也比较了其中一段重叠序列的生长率,它们之间具有显著的正相关关系(R2=0.42,n=25,p=0.0004)和类似的变化趋势(图 3a)。因此,本文建立的年代框架精准可靠。我们通过对这5条珊瑚样品的生长率进行拼接,在4个连接处有0~76年不等的年份重叠(表 1),没有出现年份缺失,保证了整个序列的连续性。对重叠时段取算术平均值,获得了1520~2007 A.D. 完整的西沙群岛珊瑚生长率(平均)序列(图 3b和表 1)。
|
图 3 1520~2007 A.D. 西沙珊瑚生长率(mm/a)记录和珊瑚生长率-海温(简称西沙海温) (a)重叠时段的两条珊瑚生长率序列(LYJ-7和LYJ-10)的变化趋势及线性关系;(b)1520~2007 A.D. 珊瑚生长率序列,样品编号后的± a是在U-Th和珊瑚年层计年学基础上,在测年误差范围内,对每条生长率序列进行的年龄校正,蓝色线为生长率平均值;(c)1961~2007 A.D. 珊瑚生长率(平均值)与西沙器测海温的线性转换方程;(d)定量重建的1520~2007 A.D. 西沙海温,蓝线为年分辨率的西沙海温(灰色柱状线为1倍标准误差(s.e.)),粗蓝线是50年加权最小二乘平滑 Fig. 3 The records of coral growth rate(mm/a)during the 1520~2007 A.D., and the result of growth rate-sea surface temperature(that is Xisha-SST). (a)Variation trend and linear relationship of both coral growth rate series(LYJ-7 and LYJ-10)in overlapping periods; (b)Coral growth rate series during 1520~2007 A.D., the ±a behind each sample legend is the value that based on U-Th and coral chronological layer, to calibrated each growth rate series within the range of dating error, blue curve is the average value of growth rates; (c)Linear relationship between the average value of coral growth rate and instrumental SST of Xisha marine environment observatory during 1961~2007 A.D.; (d)Coral growth rate-SST in Xishaqundao Islands during 1520~2007 A.D., the blue curve is the annual resolution SST(Xisha-SST) with is 1 s.e.(gray bar), the thick curve is the 50-year weighted least squares smoothing(WLS50) |
珊瑚生长率温度计是定量重建珊瑚生长率-海温的基础。本文利用西沙珊瑚生长率和永兴岛海洋观测站1961~2007 A.D. 实测年均海温,通过一元线性回归,构建了西沙珊瑚生长率与海温的转换方程(图 3c):

|
(1) |
在公式(1)中,SST为年均表层海水温度(℃,即海温);L为珊瑚年生长速率(mm/a);s.e. 为标准误差。根据二者的函数关系,也即珊瑚生长率每增加1 mm,代表海温上升0.225 ℃。该斜率(0.225)与Nie等[37]利用西沙永兴岛Sy-7滨珊瑚芯序列建立的转换方程斜率(0.225)一致,但低于Nie等[37]利用海南三亚海域滨珊瑚生长率序列建立的转换方程斜率(0.252)和Lough[36]利用印度洋-西太平洋海域的滨珊瑚生长率所建立的转换方程斜率(0.286)。这些差异可能主要由研究区域和所使用时间序列的不同所致。
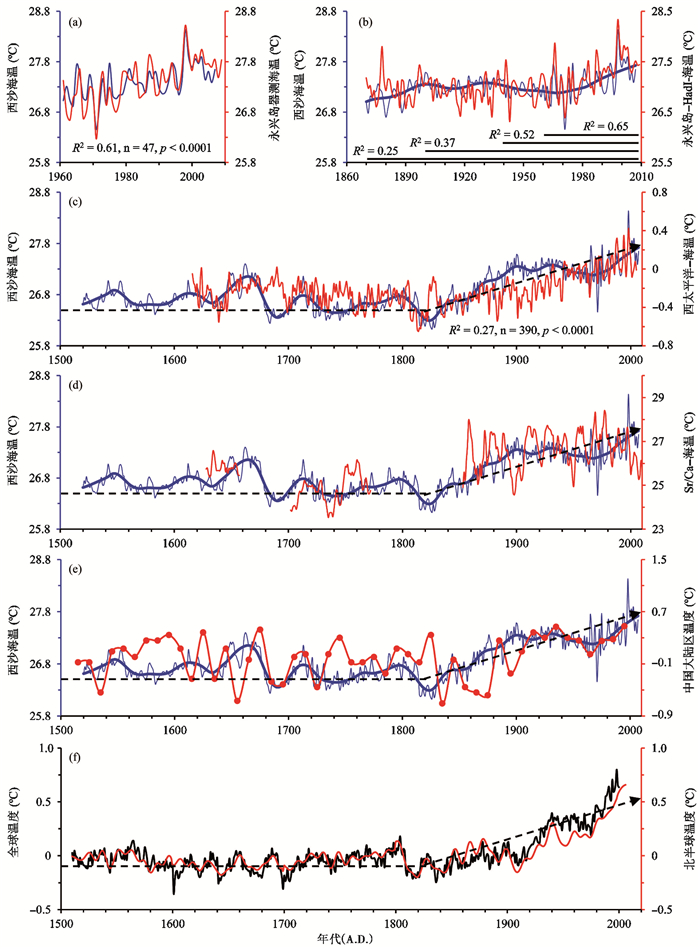
定量重建的1520~2007 A.D. 西沙珊瑚生长率-海温(简称西沙海温)介于26.13~28.43 ℃(相对于1961~2007 A.D.),极差2.30 ℃,均值26.85 ℃(图 3d和图 4)。该时段西沙海温变化表现出3个显著特征:1)趋势性。整体上西沙海温表现为先降后升,在约1520~1825 A.D.,海温整体较低且略有下降(-0.21±0.07 ℃);1826~2007 A.D. 显著增加(0.93±0.15 ℃,见图 3d和图 4);2)波动性。西沙海温在长期趋势上叠加了一系列年际-年代际波动(图 5),展现出西沙海温变化的不稳定性;3)百年尺度上与气候变化的一致性。1520~1825 A.D. 西沙海温与小冰期相对应;约1826~2007 A.D. 海温整体上快速上升(图 4),对应于这一时期全球的快速升温期。其中,1826~1899 A.D. 快速上升(1.00±0.13 ℃),1900~1971 A.D. 升温停滞并略有下降(-0.16±0.19 ℃),约1972~2007 A.D. 又快速上升(0.55±0.30 ℃)。在大的阶段上,西沙海温变化与全球温度变化相对应。
|
图 4 1520~2007 A.D. 西沙海温及其他相关记录 (a~e)蓝线是珊瑚生长率-海温(即西沙海温),(b~e)粗蓝线是50年最小二乘平滑,(c~f)虚线表示温度变化的两个主要时段;其中红线分别是(a)永兴岛海洋站观测记录的1961~2007 A.D.年分辨率海温、(b)永兴岛海域1°×1°网格HadISST(https://coastwatch.pfeg.noaa.gov/erddap/griddap/erdHadISST.html)、(c)西太平洋海域1617~2006 A.D. 年分辨率海温[14]、(d)海南岛东岸海域珊瑚Sr/Ca-海温[25]和(e)10年分辨率的中国华南季风区气温[59~60];(f)红线是北半球温度[4],黑线是全球温度[61] Fig. 4 Xisha-SST and other related records during 1520~2007 A.D. (a~e)Blue curve is coral growth rate-SST(Xisha-SST), (b~e)thick blue curve is the WLS50, and (c~f) the dotted curve represent the two main stages of temperature change. Red curves are (a) annual resolution SST of Xisha marine environment observatory during 1961~2007 A.D., (b)annual resolution HadISST in Yongxing Island by 1°×1° grid(https://coastwatch.pfeg.noaa.gov/erddap/griddap/erdHadISST.html), (c)coral-SST in the West Pacific Ocean during 1617~2006 A.D. [14], (d)coral Sr/Ca-SST in the east coast of Hainan Island[25], and (e)10-year resolution of temperature in South China monsoon region[59~60], respectively. (f)Red and black curve are temperature of North Hemisphere[4] and global[61], respectively |
|
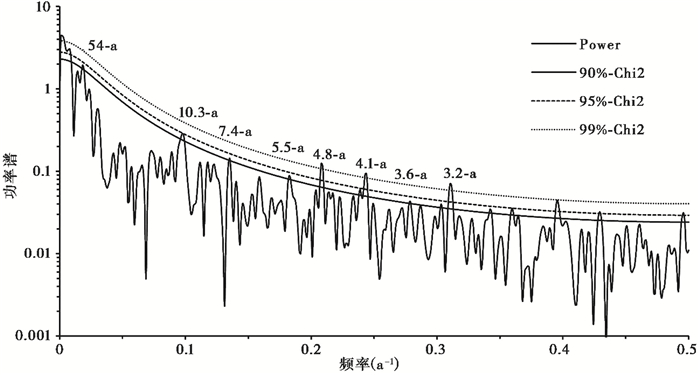
图 5 1520~2007 A.D. 西沙海温的显著周期分析软件为redfit38[62] Fig. 5 The sigificant cycles in Xisha-SST during 1520~2007 A.D. The analysis software is redfit38[62] |
定量重建的1520~2007 A.D. 西沙海温变化趋势与其他相关记录结果基本类似,但也存在一些差异。首先,在1961~2007 A.D.,西沙海温与西沙验潮站观测海温,具有显著的正相关关系(R2=0.61,n=47,p < 0.0001)和类似变化趋势,体现了珊瑚生长对周围水体环境的敏感响应(图 4a)。其次,根据与永兴岛海域1°×1°网格的HadISST(https://coastwatch.pfeg.noaa.gov/erddap/griddap/erdHadISST.html)的比较(图 4b),在1870~2007 A.D.,西沙海温与HadISST正相关关系的显著度,较与西沙验潮站海温的相比有所降低,但二者的相关性依然显著(R2=0.25,n=138,p < 0.0001)。在1940~2007 A.D. 二者的相关性(R2=0.52,n=58,p < 0.0001)显著提高,在1961~2007 A.D. 得到了进一步提高(R2=0.65,n=47,p < 0.0001)。显著性的逐渐增加,可能主要与1870 A.D. 以来,来自西沙及邻近海域的船报和器测资料等逐渐增多有关。
3.2 西沙海温与其他代用指标重建结果的异同Tierney等[14]利用西太平洋和东印度洋珊瑚氧同位素和Sr/Ca比值,集成了1617~2006 A.D. 年分辨率的西太平洋海温序列,该序列所使用的原始数据主要来自西热带南太平洋和澳大利亚周边海域。在整体趋势上,西沙海温与该序列[14]存在类似的变化特征,但在有些时段差异明显(图 4c)。比如,在小冰期时二者均表现为低温;在19世纪初期二者均出现了小冰期时期的最低值;19世纪初期以来,二者均表现为上升趋势;只是在约1870~1940 A.D. 二者的变化特征存在明显差异。西沙海温与同期海南岛东岸珊瑚Sr/Ca-海温序列[25]也具有很好的对应关系。例如,两条海温序列均记录到小冰期的相对低温期,以及小冰期后期和之后的相对升温期,在小冰期两个时段的海温也具有很好的对应关系。同时,1900~1970 A.D. 的升温相对停滞期,在海南岛东岸的珊瑚Sr/Ca-海温序列中也有明显体现(图 4d)。只是在1970年代以来,两条序列开始出现差异。然而,约1870~2007 A.D. 西沙海温变化,与最近Ramos等[18]在中国台湾南部定量重建的珊瑚Sr/Ca-海温序列具有类似的变化趋势。上述记录的一些不同,可能体现了区域的差异性或局域环境变化,因此,在南海及周边海域仍需要开展更多的高分辨率记录研究。
西沙海温与Ge等[59~60]利用历史文献资料和观测资料等,定量重建的具有可靠年代标尺的,中国华南地区同时期的气候变化具有类似的变化特征(图 4e)。同样,西沙海温与北半球温度[4]以及全球温度[61]在小冰期时段的变化特征也较为类似,总体上都处于相对低温状态(图 4f)。但是,小冰期以来西沙海域升温的开始时间似乎要早于全球平均温度记录[4, 61]。
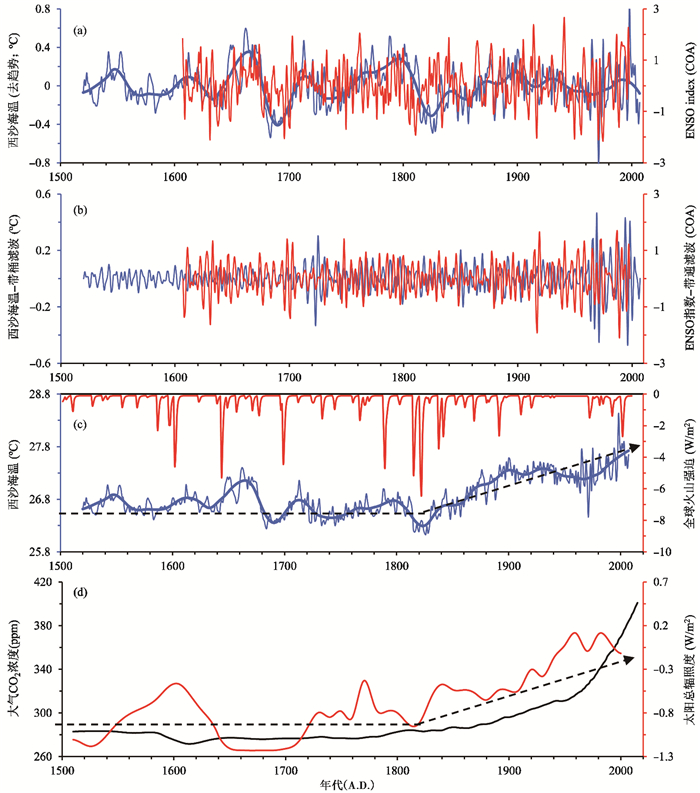
3.3 西沙海温变化的驱动机制影响影响西沙海温变化的主要因素(图 6)包括厄尔尼诺-南方涛动(ENSO)、火山活动、太阳总辐照度(TSI)和温室气体等[61, 63~65]。在年际尺度上,西沙海温的小幅波动主要响应ENSO(图 6a和6b)和火山活动(图 6c)。在年代际-多年代际尺度上,西沙海温可能主要受到火山活动、太阳总辐照度和大气二氧化碳(CO2)浓度(图 6d)等驱动。约1520~1825 A.D.,太阳总辐照度总体较低[61, 66],大气二氧化碳浓度对全球变化影响有限[65, 67],这一时期的西沙海温整体偏低,基本上与小冰期低温期相对应。约1826~2017 A.D.,太阳总辐照度呈显著增加趋势[61, 66],与此同时,大气二氧化碳浓度持续上升(图 6d),西沙海温快速上升(图 6c)。值得一提的是,约1520~1825 A.D. 期间的火山活动相对活跃[61, 64],一系列强火山活动也是造成西沙相对低海温的重要因素。从约1830年代开始,全球强火山活动明显减少,火山活动产生的阳伞效应减弱[64],也在一定程度上助推了西沙海温上升。
|
图 6 1520~2007 A.D. 西沙海温和主要驱动因素 (a)去趋势西沙海温和ENSO指数(COA[68]);(b)对(a)中的两条序列进行3~8 a的带通滤波;(c)红线是全球火山强迫[61, 64];(d)红线是太阳总辐照度[61],黑线是大气二氧化碳(CO2)浓度[67],其中1959~2007 A.D. 的数据来自观测资料(https://www.esrl.noaa.gov/gmd/ccgg/trends/data.html);(a)和(c)中的粗蓝线为50年最小二乘平滑 Fig. 6 The Xisha-SST and the main driving factors during 1520~2007 A.D. (a)Xisha-SST and ENSO-index(COA[68]); (b)3~8 a bandpass filtering to both series in (a); (c)The red curve is the global volcanic forcing[61, 64]; (d)The red curve is the total solar irradiance(TSI)value[61] and the black curve is the atmospheric CO2 concentration value[67], the data for 1959~2007 A.D. are observational data(https://www.esrl.noaa.gov/gmd/ccgg/trends/data.html). Thick bule curves are WLS50 in (a) and (c) |
西沙海温的周期性波动可能受火山、太阳活动和ENSO等共同影响。西沙低海温时期与强火山活动具有很好地对应关系(图 6c)。比如,1600 A.D.、1641 A.D.、1695 A.D. 等时段前后,以及19世纪初,每当强火山发生时,西沙海域会出现年际甚至年代际尺度的显著低温。特别是在19世纪初,一系列强火山的出现,造成了小冰期的最低温期。分析西沙海温序列的周期性(图 5)还可以发现,海温波动的54-a显著周期可能与PDO[69]有关,10.3-a的周期与太阳活动周期[66, 70~71]相对应,7.4-a、5.5-a、4.8-a、3.6-a以及3.2-a的显著周期属于ENSO活动周期范围。
Wilson等[68]利用热带中东太平洋海域8条连续的珊瑚氧同位素序列,定量重建了ENSO指数(即COA:The Centre of Action,见图 6a),该指数与去趋势后的西沙海温(图 6a)在1617~1810 A.D. 和1840~1998 A.D. 两个时段均具有类似的变化特征,这进一步说明西沙海温对热带海域环境变化的响应。只是在1810~1840 A.D. 时段,二者的变化有所不同。值得注意的是,在这一时期全球出现了一系列强火山活动[64],可能扰乱了南海海域对热带太平洋环境变化的响应。我们对西沙海温(去趋势后)和COA均进行3~8 a的带通滤波,从图 6b可以看出,在过去的四个世纪,两条序列的变化较为类似。在20世纪60年代之前,二者的波动幅度均较小;而在此之后,二者均出现了大幅波动。南海西沙海域位于西太平洋暖池北缘,ENSO活动造成的暖池海温变化势必会对西沙海域海洋环境产生影响。
4 结论本文根据西沙群岛海域5条年分辨率的滨珊瑚生长率数据和4个U-Th年龄,在建立珊瑚生长率与实测海温定量转换方程的基础上,定量重建了1520~2007 A.D. 连续的年分辨率的西沙海温序列。西沙海温可以划分为小冰期(1520~1825 A.D.)的相对低温期和1826~2007 A.D. 快速升温期两个主要时段。1520~2007 A.D. 西沙海温存在一系列年际-年代际-多年代际显著周期,年际周期(3~8 a)和十年际周期(10.3 a)分别主要响应ENSO和太阳活动等,多年代际周期(54 a)对应于太平洋多年代际涛动(PDO)。在1520~1825 A.D.,温室气体浓度相对较低,对海温的影响有限,而较为活跃的强火山活动和较低的太阳总辐照度是这一时期西沙海温较低的两个主要因素。1820年代后期以来,随着大气二氧化碳(CO2)浓度的快速增加,强火山活动的减弱或消失以及太阳总辐照度的快速上升,西沙海温快速升高。西沙海温从1820年代后期开始持续升温,略早于全球持续升温的起始时间,但与热带西太平洋暖池区升温起始时间较为接近,反映了南海海域对赤道西太平洋暖池环境变化的敏感响应。
致谢: 黄忠洲副教授和林紫云先生参与野外样品采集,澳大利亚昆士兰大学放射性同位素实验室承担U-Th测年,邓文峰教授和刘羿教授对文稿提出了建设性的修改意见和建议,对文稿质量的提高起到了重要作用,在此表示感谢。另外,若需原始数据,请联系作者获取。
| [1] |
Wang J, Yang B, Ljungqvist F C, et al. Internal and external forcing of multidecadal Atlantic climate variability over the past 1, 200 years[J]. Nature Geoscience, 2017, 10: 512-517. DOI:10.1038/ngeo2962 |
| [2] |
王健, 程海, 赵景耀, 等. 小冰期多尺度气候波动: 贵州董哥洞高分辨率石笋记录[J]. 第四纪研究, 2019, 39(3): 775-785. Wang Jian, Cheng Hai, Zhao Jingyao, et al. Climate variability during the Little Ice Age characterized by a high resolution stalagmite record from Dongge Cave, Guizhou[J]. Quaternary Sciences, 2019, 39(3): 775-785. |
| [3] |
张伟宏, 陈仕涛, 汪永进, 等. 小冰期东亚夏季风快速变化特征: 湖北石笋记录[J]. 第四纪研究, 2019, 39(3): 765-774. Zhang Weihong, Chen Shitao, Wang Yongjin, et al. Rapid change in the East Asian summer monsoon: Stalagmite records in Hubei, China[J]. Quaternary Sciences, 2019, 39(3): 765-774. |
| [4] |
Mann M E, Zhang Z H, Rutherford S, et al. Global signatures and dynamical origins of the Little Ice Age and Medieval Climate Anomaly[J]. Science, 2009, 326(5957): 1256-1260. DOI:10.1126/science.1177303 |
| [5] |
Abram N J, McGregor H V, Tierney J E, et al. Early onset of industrial-era warming across the oceans and continents[J]. Nature, 2016, 536(7617): 411-418. DOI:10.1038/nature19082 |
| [6] |
于健, 林万众, 闫伯前, 等. 基于树木年轮重建秦岭太白山1872年以来6-8月最低温度变化[J]. 第四纪研究, 2018, 38(4): 971-980. Yu Jian, Lin Wanzhong, Yan Boqian, et al. Tree-ring reconstruction of June-August mean minimum temperature back to 1872 A. D. in the Qinling Mountains, Northwest China[J]. Quaternary Sciences, 2018, 38(4): 971-980. |
| [7] |
张键, 李廷勇. "雨量效应"与"环流效应": 近1 ka亚澳季风区石笋和大气降水δ18O的气候意义[J]. 第四纪研究, 2018, 38(6): 1532-1544. Zhang Jian, Li Tingyong. "Amount effect" vs."Circulation effect": The climate significance of precipitation and stalagmite δ18O in the Asian-Australian monsoon region over the past 1 ka[J]. Quaternary Sciences, 2018, 38(6): 1532-1544. |
| [8] |
Chen T R, Cobb K M, Roff G, et al. Coral-derived Western Pacific tropical sea surface temperatures during the last millennium[J]. Geophysical Research Letters, 2018, 45(8): 3542-3549. DOI:10.1002/2018GL077619 |
| [9] |
Cobb K M, Westphal N, Sayani H R, et al. Highly variable El Niño-Southern Oscillation throughout the Holocene[J]. Science, 2013, 339(6115): 67-70. DOI:10.1126/science.1228246 |
| [10] |
Deng W, Wei G, Yu K, et al. Variations in the timing of the rainy season in the northern South China Sea during the Middle to Late Holocene[J]. Paleoceanography, 2014, 29: 115-125. DOI:10.1002/2012PA002417 |
| [11] |
Yan H, Soon W, Wang Y. A composite sea surface temperature record of the northern South China Sea for the past 2500 years: A unique look into seasonality and seasonal climate changes during warm and cold periods[J]. Earth-Science Reviews, 2015, 141: 122-135. DOI:10.1016/j.earscirev.2014.12.003 |
| [12] |
Sun D H, Gagan M K, Cheng H, et al. Seasonal and interannual variability of the mid-Holocene East Asian monsoon in coral δ18O records from the South China Sea[J]. Earth and Planetary Science Letters, 2005, 237(1-2): 69-84. DOI:10.1016/j.epsl.2005.06.022 |
| [13] |
Liu Y, Peng Z C, Shen C C, et al. Recent 121-year variability of western boundary upwelling in the northern South China Sea[J]. Geophysical Research Letters, 2013, 40(12): 3180-3183. DOI:10.1002/grl.50381 |
| [14] |
Tierney J E, Abram N J, Anchukaitis K J, et al. Tropical sea surface temperatures for the past four centuries reconstructed from coral archives[J]. Paleoceanography, 2015, 30(3): 226-252. DOI:10.1002/2014PA002717 |
| [15] |
Tangri N, Dunbar R B, Linsley B K, et al. ENSO's Shrinking twentieth-century footprint revealed in a half-millennium coral core from the South Pacific convergence zone[J]. Paleoceanography and Paleoclimatology, 2018, 33(11): 1136-1150. DOI:10.1029/2017PA003310 |
| [16] |
Saenger C, Cohen A L, Oppo D W, et al. Surface-temperature trends and variability in the low-latitude North Atlantic since 1552[J]. Nature Geoscience, 2009, 2(7): 492-495. DOI:10.1038/ngeo552 |
| [17] |
Kawakubo Y, Alibert C, Yokoyama Y. A reconstruction of subtropical western North Pacific SST variability back to 1578, based on a Porites coral Sr/Ca record from the northern Ryukyus, Japan[J]. Paleoceanography, 2017, 32(12): 1352-1370. DOI:10.1002/2017PA003203 |
| [18] |
Ramos R D, Goodkin N F, Fan T Y. Coral records at the northern edge of the Western Pacific warm pool reveal multiple drivers of sea surface temperature, salinity, and rainfall variability since the end of the Little Ice Age[J]. Paleoceanography and Paleoclimatology, 2020, 35(5): e2019PA003826. |
| [19] |
Yu K F. Coral reefs in the South China Sea: Their response to and records on past environmental changes[J]. Science China: Earth Sciences, 2012, 55(8): 1217-1229. DOI:10.1007/s11430-012-4449-5 |
| [20] |
Gagan M K, Ayliffe L K, Beck J W, et al. New views of tropical paleoclimates from corals[J]. Quaternary Science Reviews, 2000, 19(1-5): 45-64. DOI:10.1016/S0277-3791(99)00054-2 |
| [21] |
Wei G J, Deng W F, Yu K F, et al. Sea surface temperature records in the northern South China Sea from mid-Holocene coral Sr/Ca ratios[J]. Paleoceanography, 2007, 22(3): PA3206. DOI:10.1029/2006PA001270 |
| [22] |
Cobb K M, Charles C D, Cheng H, et al. El Nino/Southern Oscillation and tropical Pacific climate during the last millennium[J]. Nature, 2003, 424(6946): 271-276. DOI:10.1038/nature01779 |
| [23] |
Deng W F, Wei G J, Zhao J X, et al. Anthropogenic effects on tropical oceanic climate change and variability: An insight from the South China Sea over the past 2000 years[J]. Quaternary Science Reviews, 2019, 206: 56-64. DOI:10.1016/j.quascirev.2018.12.027 |
| [24] |
苏瑞侠, 孙东怀, 朱照宇, 等. 南海北部造礁珊瑚碳同位素的时空变化及其影响因素[J]. 第四纪研究, 2007, 27(1): 133-148. Su Ruixia, Sun Donghuai, Zhu Zhaoyu, et al. Temporal and spatial variation of carbon isotopic composition of coral Porites in the South China Sea and the environmental causes[J]. Quaternary Sciences, 2007, 27(1): 133-148. DOI:10.3321/j.issn:1001-7410.2007.01.017 |
| [25] |
Deng W, Liu X, Chen X, et al. A comparison of the climates of the medieval climate anomaly, Little Ice Age, and current warm period reconstructed using coral records from the northern South China Sea[J]. Journal of Geophysical Research: Oceans, 2017, 122(1): 264-275. DOI:10.1002/2016JC012458 |
| [26] |
Song S H, Peng Z C, Zhou W J, et al. Variation of the winter monsoon in South China Sea over the past 183 years: Evidence from oxygen isotopes in coral[J]. Global and Planetary Change, 2012, 98-99: 131-138. DOI:10.1016/j.gloplacha.2012.08.013 |
| [27] |
张会领, 余克服, 施祺, 等. 珊瑚生长率重建西沙海域中晚全新世海温变化[J]. 第四纪研究, 2014, 34(6): 1296-1305. Zhang Huiling, Yu Kefu, Shi Qi, et al. Sea surface temperature variations during the mid-Late Holocene reconstructed by Porites coral growth rates in the Xisha Islands[J]. Quaternary Sciences, 2014, 34(6): 1296-1305. |
| [28] |
Lough J M, Barnes D J. Environmental controls on growth of the massive coral Porites[J]. Journal of Experimental Marine Biology and Ecology, 2000, 245(2): 225-243. DOI:10.1016/S0022-0981(99)00168-9 |
| [29] |
Helmle K P, Dodge R E, Swart P K, et al. Growth rates of Florida corals from 1937 to 1996 and their response to climate change[J]. Nature Communications, 2011, 2: 215. DOI:10.1038/ncomms1222 |
| [30] |
Lough J M, Cantin N E. Perspectives on massive coral growth rates in a changing ocean[J]. The Biological Bulletin, 2014, 226(3): 187-202. DOI:10.1086/BBLv226n3p187 |
| [31] |
林丽芳, 余克服, 陶士臣, 等. 南海黄岩岛珊瑚记录的1780-2013年的表层海温年代际变化特征[J]. 海洋学报, 2018, 40(9): 31-42. Lin Lifang, Yu Kefu, Tao Shichen, et al. Interdecadal variability of sea surface temperature from 1780 to 2013 recorded in corals from the Huangyan Island in the South China Sea[J]. Acta Oceanologica Sinica, 2018, 40(9): 31-42. DOI:10.3969/j.issn.0253-4193.2018.09.003 |
| [32] |
Cooper T F, O'Leary R A, Lough J M. Growth of Western Australian corals in the Anthropocene[J]. Science, 2012, 335(6068): 593-596. DOI:10.1126/science.1214570 |
| [33] |
De'ath G, Lough J M, Fabricius K E. Declining coral calcification on the Great Barrier Reef[J]. Science, 2009, 323(5910): 116-119. DOI:10.1126/science.1165283 |
| [34] |
Yang B, Qin C, Wang J L, et al. A 3, 500-year tree-ring record of annual precipitation on the northeastern Tibetan Plateau[J]. Proceedings of the National Academy of Sciences of the United States of America, 2014, 111(8): 2903-2908. DOI:10.1073/pnas.1319238111 |
| [35] |
Ma T Y H. On the growth rate of reef corals and its retation to sea water temperature[J]. Palaeontolgia Sinica (Series B), 1937, XVI(1): 1-426. |
| [36] |
Lough J M. Coral calcification from skeletal records revisited[J]. Marine Ecology Progress Series, 2008, 373: 257-264. DOI:10.3354/meps07398 |
| [37] |
Nie B F, Chen T G, Liang M T, et al. Relationship between coral growth rate and sea surface temperature in the northern part of South China Sea during the past 100 a[J]. Science in China(Series D), 1997, 40(2): 173-182. DOI:10.1007/BF02878376 |
| [38] |
施祺, 张叶春, 孙东怀. 海南岛三亚滨珊瑚生长率特性及其与环境因素的关系[J]. 海洋通报, 2002, 21(6): 31-38. Shi Qi, Zhang Yechun, Sun Donghuai. Characteristics of growth rate of Porites coral from Sanya, Hainan Island and its relationship to environmental variables[J]. Marine Science Bulletin, 2002, 21(6): 31-38. DOI:10.3969/j.issn.1001-6392.2002.06.005 |
| [39] |
苏瑞霞, 孙东怀. 南海北部滨珊瑚生长的影响因素[J]. 地理学报, 2003, 58(3): 442-451. Su Ruixia, Sun Donghuai. The influencing factors of coral Porites in the northern part of the South China Sea[J]. Acta Geographica Sina, 2003, 58(3): 442-451. DOI:10.3321/j.issn:0375-5444.2003.03.014 |
| [40] |
张会领. 珊瑚和石笋对全新世季风气候的高分辨率记录[D]. 广州: 中国科学院南海海洋研究所博士学位论文, 2013: 1-371. Zhang Huiling. High-resolution Holocene Monsoon Climate Records in Corals and Stalagmites[D]. Guangzhou: The Ph. D Thesis of South China Sea Institute of Oceanology, Chinese Academy of Sciences, 2013: 1-371. |
| [41] |
Nie B F, Chen T G, Peng Z C. Reconstruction of sea surface temperature series in the last 220 years by use of reef corals in Xisha waters, South China Sea[J]. Chinese Science Bulletin, 1999, 44(22): 2094-2098. DOI:10.1007/BF02884929 |
| [42] |
江巧文, 曹志敏, 王道儒, 等. 琼东海域橙黄滨珊瑚骨骼生长特性及其主要影响因素[J]. 应用生态学报, 2016, 27(3): 953-962. Jiang Qiaowen, Cao Zhimin, Wang Daoru, et al. Growth characteristics of Porites lutea skeleton in east sea area of Hainan Island, China and affecting environmental factors[J]. Chinese Journal of Applied Ecology, 2016, 27(3): 953-962. |
| [43] |
黄博津, 余克服, 张会领, 等. 利用珊瑚生长率重建西沙海域罗马暖期中期海温变化[J]. 热带地理, 2013, 33(3): 237-241. Huang Bojin, Yu Kefu, Zhang Huiling, et al. Sea surface temperature variations during the Middle Rome Warm Period as reconstructed by Porites coral growth Rates in the Xisha Islands[J]. Tropical Geography, 2013, 33(3): 237-241. |
| [44] |
Han T, Yu K F, Yan H, et al. The decadal variability of the global monsoon links to the North Atlantic climate since 1851[J]. Geophysical Research Letters, 2019, 46(15): 9054-9063. DOI:10.1029/2019GL081907 |
| [45] |
Sun R, Hintelmann H, Liu Y, et al. Two centuries of coral skeletons from the northern South China Sea record mercury emissions from modern chinese wars[J]. Environmental Science & Technology, 2016, 50(11): 5481-5488. |
| [46] |
刘羿, 彭子成, 程继满, 等. 海南岛东部海域滨珊瑚Sr/Ca比值温度计及其影响因素初探[J]. 第四纪研究, 2006, 26(3): 470-476. Liu Yi, Peng Zicheng, Cheng Jiman, et al. The relationship between Sr/Ca values of Porites coral and SST values in eastern Hainan Island at the north of South China Sea and its influence factors[J]. Quaternary Sciences, 2006, 26(3): 470-476. |
| [47] |
韦刚健, 余克服, 李献华, 等. 南海北部珊瑚Sr/Ca和Mg/Ca温度计及高分辨率SST记录重建尝试[J]. 第四纪研究, 2004, 24(3): 325-331. Wei Gangjian, Yu Kefu, Li Xianhua, et al. Coralline Sr/Ca and Mg/Ca thermometer for the northern South China Sea: Calibration and primary application on high-resolution SST reconstructing[J]. Quaternary Sciences, 2004, 24(3): 325-331. DOI:10.3321/j.issn:1001-7410.2004.03.012 |
| [48] |
Liu X D, Sun L G, Wei G J, et al. A 1, 100-year palaeoenvironmental record inferred from stable isotope and trace element compositions of ostracode and plant caryopses in sediments of Cattle Pond, Dongdao Island, South China Sea[J]. Journal of Paleolimnology, 2008, 40(4): 987-1002. DOI:10.1007/s10933-008-9211-9 |
| [49] |
Yan H, Sun L G, Oppo D W, et al. South China Sea hydrological changes and Pacific Walker Circulation variations over the last millennium[J]. Nature Communications, 2011, 2: 293. DOI:10.1038/ncomms1297 |
| [50] |
刘晓东, 孙立广, 赵三平, 等. 南海东岛湖泊沉积物中的生态环境记录[J]. 第四纪研究, 2005, 25(5): 574-584. Liu Xiaodong, Sun Liguang, Zhao Sanping, et al. Eco-environmental information recorded in the lake sediments of the Dongdao Island, South China Sea[J]. Quaternary Sciences, 2005, 25(5): 574-584. DOI:10.3321/j.issn:1001-7410.2005.05.007 |
| [51] |
Han T, Yu K F, Yan H, et al. Coral δ18O-based reconstruction of El Niño-Southern Oscillation from the northern South China Sea since 1851 AD[J]. Quaternary International, 2020, 550: 159-168. DOI:10.1016/j.quaint.2020.04.032 |
| [52] |
Deng W F, Wei G J, Xie L H, et al. Variations in the Pacific Decadal Oscillation since 1853 in a coral record from the northern South China Sea[J]. Journal of Geophysical Research: Oceans, 2013, 118(5): 2358-2366. DOI:10.1002/jgrc.20180 |
| [53] |
Yan H Q, Shi Q, Yu K F, et al. Regional coral growth responses to seawater warming in the South China Sea[J]. Science of the Total Environment, 2019, 670: 595-605. DOI:10.1016/j.scitotenv.2019.03.135 |
| [54] |
Yu K F, Zhao J X, Shi Q, et al. U-series dating of dead Porites corals in the South China Sea: Evidence for episodic coral mortality over the past two centuries[J]. Quaternary Geochronology, 2006, 1(2): 129-141. DOI:10.1016/j.quageo.2006.06.005 |
| [55] |
Yu K F, Zhao J X, Shi Q, et al. Recent massive coral mortality events in the South China Sea: Was global warming and ENSO variability responsible?[J]. Chemical Geology, 2012, 320-321: 54-65. DOI:10.1016/j.chemgeo.2012.05.028 |
| [56] |
Zhao J X, Neil D T, Feng Y X, et al. High-precision U-series dating of very young cyclone-transported coral reef blocks from Heron and Wistari reefs, southern Great Barrier Reef, Australia[J]. Quaternary International, 2009, 195(1-2): 122-127. DOI:10.1016/j.quaint.2008.06.004 |
| [57] |
Knutson D W, Buddemeier R W, Smith S V. Coral chronometers: Seasonal growth bands in reef corals[J]. Science, 1972, 177(4045): 270-272. DOI:10.1126/science.177.4045.270 |
| [58] |
韦雯雯, 施祺, 余克服, 等. 南海滨珊瑚骨骼密度带的季节特征及其主要环境影响因素[J]. 热带地理, 2016, 36(6): 923-934. Wei Wenwen, Shi Qi, Yu Kefu, et al. Seasonal patterns and major environmental influences of skeletal density bands of coral Porites from the South China Sea[J]. Tropical Geography, 2016, 36(6): 923-934. |
| [59] |
Ge Q S, Zheng J Y, Hao Z X, et al. Temperature variation through 2000 years in China: An uncertainty analysis of reconstruction and regional difference[J]. Geophysical Research Letters, 2010, 37: L03703. |
| [60] |
Ge Q S, Hao Z X, Zheng J Y, et al. Temperature changes over the past 2000 yr in China and comparison with the Northern Hemisphere[J]. Climate of the Past, 2013, 9(1): 507-523. |
| [61] |
Neukom R, Barboza L A, Erb M P, et al. Consistent multidecadal variability in global temperature reconstructions and simulations over the Common Era[J]. Nature Geoscience, 2019, 12: 643-649. DOI:10.1038/s41561-019-0400-0 |
| [62] |
Schulz M, Mudelsee M. REDFIT: Estimating red-noise spectra directly from unevenly spaced paleoclimatic time series[J]. Computers & Geosciences, 2002, 28(3): 421-426. |
| [63] |
PAGES2k Consortium. Continental-scale temperature variability during the past two millennia[J]. Nature Geoscience, 2013, 6(5): 339-346. DOI:10.1038/ngeo1797 |
| [64] |
Sigl M, Winstrup M, McConnell J R, et al. Timing and climate forcing of volcanic eruptions for the past 2, 500 years[J]. Nature, 2015, 523(7562): 543-549. DOI:10.1038/nature14565 |
| [65] |
Myhre G, Shindell D, Bréon F M, et al. Anthropogenic and natural radiative forcing[R]//Stocker T F, Qin D H, Plattner G K, et al. Climate change 2013: The Physical Science Basis; Working Group Ⅰ Contribution to the Fifth Assessment Report of the Intergovernmental Panel on Climate Change. Cambridge: Cambridge University Press, 2014: 659-740. https://doi.org/10.1017/CBO9781107415324.018.
|
| [66] |
Lean J. Evolution of the Sun's spectral irradiance since the Maunder minimum[J]. Geophysical Research Letters, 2000, 27(16): 2425-2428. DOI:10.1029/2000GL000043 |
| [67] |
MacFarling Meure C, Etheridge D, Trudinger C, et al. Law Dome CO2, CH4 and N2O ice core records extended to 2000 years BP[J]. Geophysical Research Letters, 2006, 33(14): L14810. DOI:10.1029/2006GL026152 |
| [68] |
Wilson R, Cook E, D'Arrigo R, et al. Reconstructing ENSO: The influence of method, proxy data, climate forcing and teleconnections[J]. Journal of Quaternary Science, 2010, 25(1): 62-78. DOI:10.1002/jqs.1297 |
| [69] |
Mantua N J, Hare S R, Zhang Y, et al. A Pacific interdecadal climate oscillation with impacts on salmon production[J]. Bulletin of the American Meteorological Society, 1997, 78: 1069-1079. DOI:10.1175/1520-0477(1997)078<1069:APICOW>2.0.CO;2 |
| [70] |
Gray L J, Beer J, Geller M, et al. Solar influences on climate[J]. Reviews of Geophysics, 2010, 48(4): RG4001. |
| [71] |
Usoskin I G. A history of solar activity over millennia[J]. Living Reviews in Solar Physics, 2017, 14(1): 31-97. DOI:10.1007/s41116-017-0006-9 |
2 Southern Marine Science and Engineering Guangdong Laboratory(Guangzhou), Guangzhou 511458, Guangdong;
3 College of Ocean Engineering, Guangdong Ocean University, Zhanjiang 524088, Guangdong;
4 Coral Reef Research Center of China, Guangxi Laboratory on the Study of Coral Reefs in the South China Sea, School of Marine Sciences, Guangxi University, Nanning 530004, Guangxi;
5 Department of Geography, Hanshan Normal University, Chaozhou 521041, Guangdong)
Abstract
We use five annual-resolution growth rate(i.e. growth width per year(mm/a or cm/a)) series and four U-Th ages of Porites coral samples, based on the significantly positive correlation(R2=0.61, n=47, p < 0.0001) and transfer equation between Porites coral growth rate and instrumental sea surface temperature(SST) in the Xishaqundao Islands(15.76°~17.13°N, 111.18°~112.90°E), South China Sea(SCS), we quantitatively reconstructed continuously annual resolution growth rate-SST(i.e. Xisha-SST) during 1520~2007 A.D. The change of Xisha-SST can be divided into two main stages(1520~1825 A.D. and 1826~2007 A.D.). It is dominated by small fluctuations in the first stage(1520~1825 A.D.), with a slight decrease(-0.21±0.07℃). It showed an overall upward trend(0.93±0.15℃) in the second stage(1826~2007 A.D.), of which Xisha-SST rose rapidly(1.00±0.13℃) from 1826 A.D. to 1899 A.D., it is declined slightly(-0.16±0.19℃) during 1900~1971 A.D., and then, it continued to rise(0.55±0.30℃) since 1972 A.D. to 2007 A.D. The Xisha-SST has significant interannual(3~8 a), decadal(10.3 a) and multi-decadal(54 a) cycles in the past five centuries, which correspond to the ENSO, solar activity, and the Pacific Decadal Oscillation(PDO), respectively. The continuous warming of the Xisha-SST seems to be onset in the late-1820s, which was comparable to the onset time of the SST/temperature in the western Pacific Ocean and the monsoon region in the Southeast China, while it seems to be earlier than that in other regions of the world, this characteristics reflect the sensitive response of the SCS to the changes in the marine environment of the equatorial region. 2021, Vol.41

