2 福建师范大学湿润亚热带山地生态国家重点实验室培育基地, 福建 福州 350007;
3 昆山震川高级中学, 江苏 苏州 215300;
4 云南大学国际喀斯特联合研究中心, 云南 昆明 650223;
5 福建师范大学地理研究所, 福建 福州 350007;
6 西安交通大学全球环境变化研究院, 陕西 西安 710054;
7 明尼苏达大学地球科学系, 明尼苏达州 明尼阿波利斯 55455;
8 中国科学院地质与地球物理研究所, 中国科学院新生代地质与环境重点实验室, 北京 100029)
小冰期(Little Ice Age,简称LIA)指发生在中世纪暖期和20世纪暖期之间持续数百年的典型寒冷气候期[1],是过去千年气候变化研究的重点时段之一。现有不少学者将小冰期的起讫时间划定为1300~1900 A.D. [2~3],但不同区域的出现时段不尽一致。小冰期时期的温度和降水在时空分布上复杂多变,对当时人类社会的发展产生了深远影响[4~6]。开展小冰期区域气候变化特征及成因机制研究,有助于揭示百年至年际尺度的气候变化规律、理解人类活动与气候变化的内在联系和指导未来气候变化趋势的预测等。
亚洲季风区是全球最显著的季风区,包括印度夏季风和东亚夏季风两个子系统[7]。夏季风(降水)的异常活动时常引发严重的旱涝灾害,深刻影响季风区内的人口生存和社会经济发展[8]。先前的研究揭示了亚洲夏季风强弱与人类历史文明的兴衰更替紧密相关[9~12]。因此,有必要了解亚洲季风气候变化的特征与规律,进而提高预测未来气候变化的能力,而对近千年特征时期季风气候的研究可为深刻理解这一特征规律提供重要的窗口。
近20年来,学者们通过冰芯[13~14]、近海沉积[15~16]、石笋[9, 17~28]、树轮[10~11, 29~30]、湖泊沉积[31~35]、史料文献[36~37]、多指标综合集成分析[38~39]和数值模拟[40~42]等提取了大量小冰期季风气候的时空演变特征。小冰期时亚洲季风气候控制下的降水/干湿波动在大尺度空间范围内存在明显的区域分异。例如,通过对比分析亚洲季风区不同类型的降水/干湿代用指标序列,一些研究[32, 39]发现小冰期期间受印度夏季风影响的广阔区域(包括中国西南和南方、青藏高原南部和东南部、印度东北-喜马拉雅山地带、阿曼南部和赤道东非等)总体上呈现湿润的气候状态,而东亚夏季风区(包括中国华北、东北和西北季风区,以及日本中北部等)主要以干旱气候为主;也有研究[43]指出小冰期时亚洲季风区内存在北部湿润而南部干旱的空间分异格局。另外,高分辨率气候资料显示小冰期季风气候并不稳定,其内部存在百年乃至年际尺度的次级干湿波动。例如,喜马拉雅山中段的达索普冰芯记录显示小冰期期间发生了多次年际至年代际尺度的印度夏季风衰退事件[13];青藏高原南部湖泊沉积物记录到小冰期内部存在3次百年尺度的区域有效湿度显著增加的湿润时期[34];基于藏东南地区树轮资料重建的帕尔默干旱指数(Palmer Drought Severity Index,简称PDSI)指示小冰期时期存在一系列年代至多年代际尺度的干湿振荡[29]。洞穴石笋具有空间分布广、适合精确定年、代用指标丰富和记录较连续等诸多优势[44],是研究亚洲季风气候变化历史与机理的重要地质材料[45~46]。来自四川黑竹沟洞的石笋记录显示亚洲季风在小冰期期间呈现一系列十年际尺度的加强和减弱振荡,其中5个持续时间约40 a的强振荡旋回发生在1600~1800 A.D. [17];湖北永兴洞石笋记录到小冰期内部存在2次百年、3次数十年尺度的季风降水减弱事件,并得到中国南方董哥洞、织金洞石笋记录的支持,但区别于北方大鱼洞、九仙洞、黄爷洞和万象洞石笋记录的5次小幅度季风水文旋回[18]。总体而言,当前在小冰期季风气候变化的精细过程、区域差异等方面仍存在不少争议,尚需更广泛空间的更多高分辨率气候记录加以深入研究。
我国云南地区处于印度夏季风和东亚夏季风的交汇地带[47],对季风气候变化响应十分敏感。长期以来,对云南地区近千年气候环境变化的研究主要采用湖泊沉积物[31~33, 48~50],而现有的近千年高分辨率石笋记录在云南地区分布较少[19],特别是云南西部(典型的印度夏季风控制区)仍未见有报道。本研究选取云南西南部司岗里洞石笋(编号SGL1),结合230Th测年和高分辨率碳氧稳定同位素分析,重建小冰期时期夏季风降水变化的详细过程并探讨其可能的成因机制。
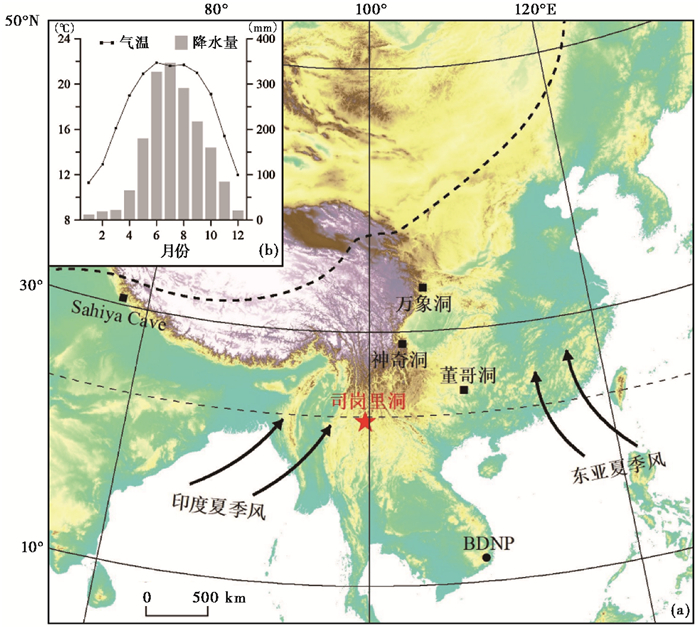
1 研究区域、材料与方法 1.1 研究区概况司岗里洞(23°32′N,99°33′E;洞口海拔约1200 m)位于云南省西南部临沧市沧源佤族自治县境内(图 1a),与昆明市直线相距约400 km。沧源县地处滇西横断山脉纵谷地带南端,地势由北向南倾斜,有利于夏季西南暖湿水汽的深入[51]。本区属南亚热带山地季风气候,具有雨热同季、干湿分明、夏秋多雨和冬春干旱等特点[51]。根据1981~2010年气象数据统计(图 1b,http://data.cma.cn/),沧源县年均气温17.7 ℃,最热月(6月)和最冷月(1月)平均气温分别为21.9 ℃、11.3 ℃,年均降水量1747 mm,年均相对湿度达82%,5~10月为当地雨季,雨季降水量占年总降水量的87%以上。司岗里洞发育于二叠系下统大名山组(P2d)白云岩夹灰岩、生物屑灰岩地层中(http://www.ngac.org.cn/),已探明洞道总长约8800 m,最宽处50 m,最高处40 m,规模宏大。洞内发育有丰富的次生化学碳酸盐沉积物,洞口处及洞内低洼处多分布有黄色粘土和机械崩塌岩块等。
|
图 1 云南西南部司岗里洞及相关洞穴记录所在位置(a)和沧源县多年月平均气温和降水量的年内分布(1981~2010年)(b) 红色星形指示司岗里洞所在位置,黑色方块指示万象洞(33°19′N,105°00′E)、董哥洞(25°17′N,108°05′E)、Sahiya洞(30°36′N,77°52′E) 和神奇洞(28°56′N,103°06′E) 石笋记录所在位置,黑色圆点指示越南南部比豆普奴伊巴国家公园(BDNP,12°00′N,108°00′E) 树轮记录所在位置;粗黑虚线表示现代亚洲夏季风界限(改自Chen等[52]) Fig. 1 (a)Locations of Sigangli Cave in southwestern Yunnan and other related records; (b)Monthly mean temperature and precipitation in Cangyuan County from 1981 A.D. to 2010 A.D. Red star indicates the location of Sigangli Cave. Black squares indicate the location of stalagmite records from Wanxiang Cave(33°19N, 105°00′E), Dongge Cave(25°17′N, 108°05′E), Sahiya Cave(30°36′N, 77°52′E) and Shenqi Cave(28°56′N, 103°06′E), respectively. Black dot indicates tree-ring record from Bidoup Nui Ba National Park(BDNP, 12°00′N, 108°00′E) in southern Vietnam. Bold black dashed line indicates the modern Asian summer monsoon limit(modified from Chen et al. [52]) |
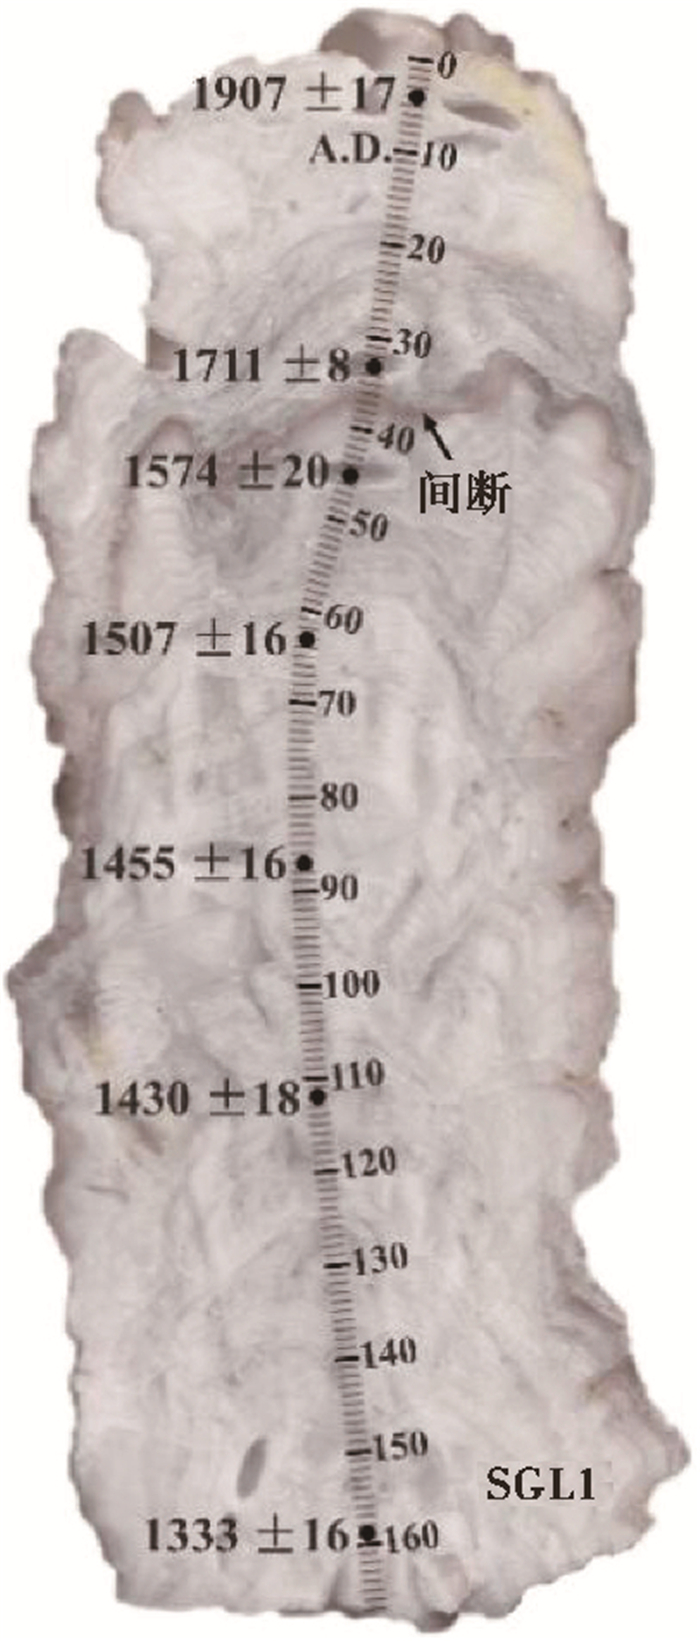
石笋SGL1采集自司岗里洞最深部的一个洞厅中,样品长约168 mm,直径约60 mm。沿生长轴切开并抛光后,可观察到石笋剖面呈灰白色,半透明,存在少量溶孔,部分层段发育有清晰的纹层,矿物鉴定显示石笋由纯方解石组成。在距顶约35~36 mm处存在一条锈色条纹,可能为沉积间断(图 2)。
|
图 2 SGL1石笋抛光面扫描图 黑色圆点标示230Th测年点,黑色箭头指示沉积间断面 Fig. 2 Polished section of stalagmite SGL1. Black dots indicate the positions of sub-samples for 230Th dating. The black arrow indicates the deposition hiatus |
在石笋抛光面上,使用直径0.3 mm牙钻沿生长层理钻取7个铀系年代样品,单个样品重量约150 mg,其中样品SGL1-63和SGL1-112在中国科学院地质与地球物理研究所测试,其余样品在西安交通大学全球环境变化研究院完成,测试仪器为MC-ICP-MS Neptune,化学分离步骤和仪器分析方法分别参照Edwards等[53]和Cheng等[54]。另外,使用直径0.3 mm牙钻沿生长轴方向以0.5 mm间隔依次采集325个稳定同位素分析样品,并在垂直于生长轴的5个不同深度层位各采集5个样品用于Hendy检验[55];同位素测试在福建师范大学稳定同位素中心完成,采用连续流GasBench Ⅱ装置和Finnigan MAT-253型质谱仪联机测试,测试过程中每7个样品内插一个实验室标样(CAI13),实验室标样和参考气使用NBS-19标定,数据采用VPDB标准,分析误差(±2 σ)优于±0.1 ‰。
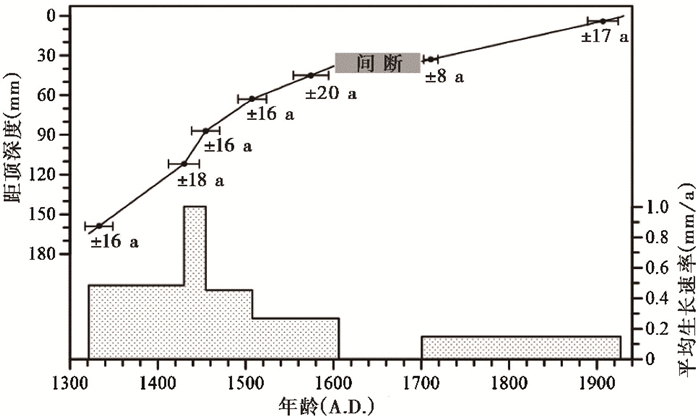
2 研究结果 2.1 测年结果与时标建立表 1列出SGL1石笋的U、Th同位素含量和7个230Th年龄。结果显示,多数样品的238U含量适中,介于161×10-9~236×10-9g/g之间,232Th含量较低,介于23×10-9~235×10-12g/g之间,测年误差(±2 σ)为8~20 a,所有年龄在误差范围内符合石笋生长层序。根据测年结果和沉积岩性分析,距石笋顶部约35~36 mm处为沉积间断,间断时长约为95 a。通过采用相邻年龄点间的线性内插、年龄点至石笋顶部、底部和沉积间断上、下界面的时段线性外推的方法,建立SGL1石笋剖面1322~1605 A.D.和1700~1927 A.D.时段的年代学标尺,石笋发育阶段的生长速率介于0.15~1.00 mm/a之间,平均速率为0.47 mm/a;其中生长速率较快且稳定的1322~1540 A.D. 时段,平均速率为0.51 mm/a(图 3)。
| 表 1 司岗里洞SGL1石笋的U、Th同位素含量和230Th年龄 Table 1 U and Th isotopic compositions, and 230Th ages of stalagmite SGL1 from Sigangli Cave |
|
图 3 SGL1石笋年龄-深度曲线和平均生长速率 灰色矩形框表示距石笋顶部35~36 mm处的沉积间断,误差棒表示230Th测年点和误差(±2 σ) Fig. 3 Age-depth curve and average growth rate for stalagmite SGL1. The gray rectangle represents the growth hiatus at 35~36 mm from the top. Error bars indicate 230Th dating points and dating errors(±2 σ) |
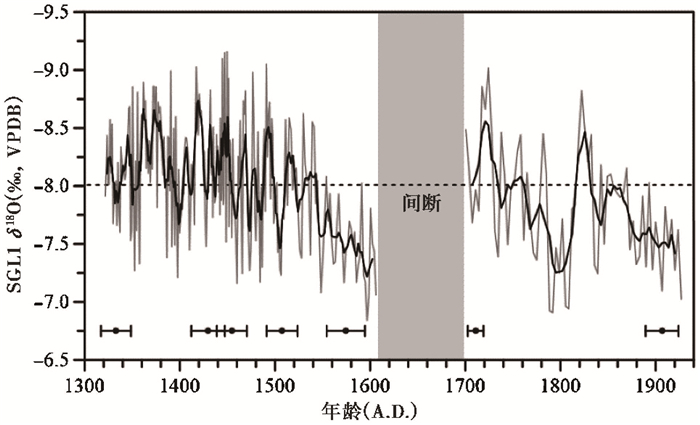
SGL1石笋δ18O时间序列如图 4所示。δ18O变化范围为-9.16 ‰~-6.84 ‰,平均值为-8.01 ‰,振幅达约2.3 ‰,数据点平均分辨率为2 a,1322~1540 A.D. 时段的平均分辨率达1 a。在百年尺度上,δ18O序列的变化特征大致可分为2个阶段:1)1322~1605 A.D. 时段,δ18O整体偏正,平均值为-8.17 ‰,在1600 A.D. 前后达到序列最正值(-6.84 ‰);2)1700~1927 A. D.时段,δ18O整体逐步偏正,平均值为-7.78 ‰,期间出现一个显著的δ18O偏正阶段(1730~1820 A.D.)。在年代际尺度上,SGL1石笋δ18O变化表现更为显著,呈现出一系列持续十年至数十年尺度的高频振荡旋回,平均振幅达0.8 ‰,最大振幅达2.0 ‰,特别是在时间分辨率和年代控制较好的1322~1540 A.D. 时段,这种年代际振荡表现得尤为显著。
|
图 4 SGL1石笋δ18O时间序列 水平虚线表示序列平均值,黑色粗线为5点滑动平均,灰色条柱指示距石笋顶部35~36 mm处的沉积间断,误差棒表示230Th测年点和误差(±2 σ) Fig. 4 δ18 time series of stalagmite SGL1. The horizontal dashed line represents the mean value. The bold black line is 5-points moving average. The gray vertical bar represents the growth hiatus at 35~36 mm from the top. Error bars indicate 230Th dating points and age errors(±2 σ) |
在石笋发育过程中水-岩同位素分馏达到或接近平衡是应用石笋δ18O重建古气候的前提条件。根据Hendy准则[55],对SGL1石笋进行同位素平衡分馏检验,结果显示:1)同一生长层δ18O值从中心向两侧的变化基本一致,标准差(SD)均落在0.11~0.23之间(图 5a);2)除距顶20 mm层位外,多数生长层δ18O和δ13C值之间无显著相关性(图 5b)。以上检验结果表明,SGL1石笋在整个沉积过程中接近于同位素平衡分馏状态。近些年的研究认为[56],石笋δ18O和δ13C值之间无相关性并不是所有同位素平衡沉积的必要条件,如果研究石笋与同一洞穴或同一气候区不同洞穴石笋的δ18O变化具有一致性,则表明该石笋沉积时同位素达到平衡分馏,即重复性准则。如图 6所示,SGL1石笋序列与印度季风控制区的印度中北部[20]和我国四川神奇洞[21]石笋记录在重叠时段的变化趋势基本一致;SGL1序列在年代控制更为精确、时间分辨率接近1 a的时段(1322~1540 A.D.),与越南树轮记录[11]在年代际尺度变化上也基本一致。这些证据在一定程度上证明SGL1氧同位素序列具有区域重现性,适用于重建古气候。

|
图 5 SGL1石笋Hendy检验结果 (a)不同深度同层δ18O值从中心向两侧的变化趋势;(b)不同深度同层δ18O和δ13C值之间的相关性 Fig. 5 Results of Hendy Test for stalagmite SGL1.(a)Variation trends of δ18O values in the same layer from center to edge at different depths; (b)Correlations between δ18O and δ13C values in the same layer at different depths |
|
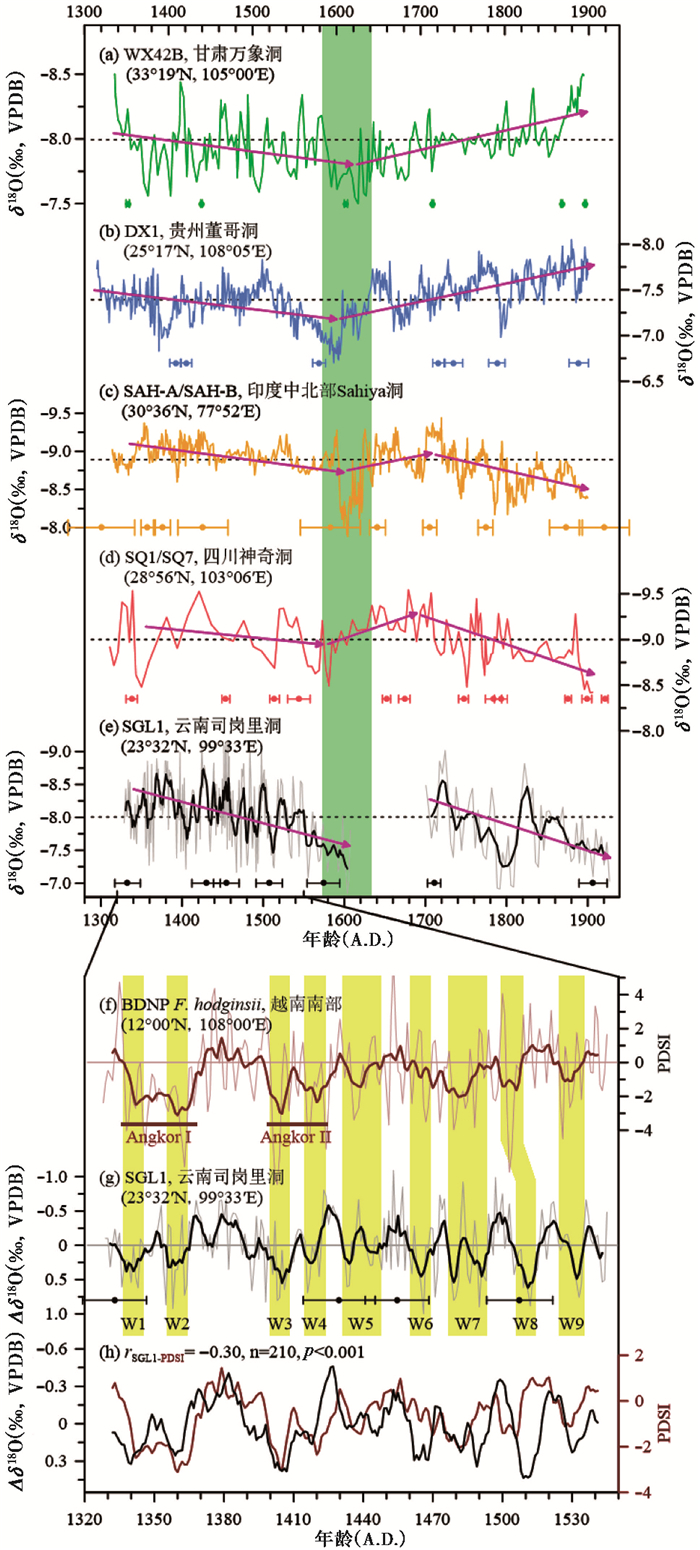
图 6 小冰期时期不同区域气候记录对比 (a)甘肃万象洞WX42B石笋δ18O记录[9];(b)贵州董哥洞DX1石笋δ18O记录[24];(c)印度北部Sahiya洞石笋δ18O记录[20];(d)四川神奇洞石笋δ18O记录[21];(e)云南司岗里洞SGL1石笋δ18O记录(深色为5点平滑曲线);(f)越南南部树轮(Fokienia hodginsii)宽度年表重建的帕尔默干旱指数(PDSI)[11](深色为9点平滑曲线);(g)去趋势后的SGL1石笋Δδ18O序列(深色为5点平滑曲线);(h)SGL1石笋Δδ18O记录(黑色线)与越南树轮PDSI序列(棕色线)对比水平虚线表示各石笋记录1300~1900 A.D. 时段δ18O平均值;粉色箭头指示δ18O阶段性变化趋势;绿色条柱指示1600 A.D. 前后δ18O显著偏正过程;黄色条柱表示SGL1石笋记录的9个干旱事件(编号W1~W9);棕色横条表示越南树轮记录的两个显著干旱事件(Angkor Ⅰ and Ⅱ Drought)[11];误差棒表示2 σ年龄误差 Fig. 6 Comparison of climatic records from different regions during the Little Ice Age. (a)δ18O record of stalagmite WX42B from Wanxiang Cave in Gansu[9]; (b)δ18O record of stalagmite DX1 from Dongge Cave in Guizhou[24]; (c)Stalagmite δ18O record from Sahiya Cave in Northern Indian[20]; (d)Stalagmite δ18O record from Shenqi Cave in Sichuan[21]; (e)δ18O record of stalagmite SGL1 from Sigangli Cave in Yunnan(the darker curve is the 5-point running average); (f)Palmer Drought Severity Index(PDSI)based on tree rings(BDNP, Fokienia hodginsii)from southern Vietnam[11](the darker curve is the 9-point running average); (g)Detrended SGL1δ18O record; (h)Comparison between detrended SGL1δ18O record(black curve) and BDNP's PDSI sequence[11](brown curve). Horizontal dashed lines represent the δ18O average values of stalagmite records. Pink arrows indicate the long-term evolution trends of different records. Green vertical bar indicates the distinct interval around 1600 A.D. with persistently positive δ18O values. Yellow vertical bars indicate nine drought events(numbered W1~W9)in SGL1 record. Brown cross bars denote two outstanding drought period(Angkor Ⅰ and Ⅱ droughts)recorded in the BDNP tree-ring record[11]. The error bars show the 2 σ age error |
在同位素平衡分馏状态下,石笋δ18O主要受控于洞穴滴水δ18O和洞穴温度的变化[55]。通常,洞穴温度接近于当地年均温。前人研究发现[57~58],云南地区小冰期年均温变幅小于1 ℃,对石笋δ18O的影响较小(-0.24 ‰ /℃[59]),无法解释SGL1石笋δ18O约2.3 ‰的变幅,因而推断该石笋δ18O值的变化主要受控于滴水δ18O的变化。
现代洞穴监测结果表明,滴水δ18O接近大气降水δ18O的年均值[60~61],而大气降水δ18O的时空变化又同时受水汽源区、水汽运移路径、水汽凝结温度和降水量等因素影响[62~63]。司岗里洞所在区域的水汽输送、降水及相关雨水同位素变化与夏季风活动密切相关,表现出明显的旱雨两季特征。在雨季(5~10月),向北逐渐推进的印度夏季风不断地从孟加拉湾往研究区输送大量的暖湿水汽,水汽达到研究区后受北高南低地势的抬升作用而形成丰沛降水,雨季降水量占到全年总量的87%以上。进入旱季(11~4月),随着夏季风南退,此时降水的水汽主要来源于有限的西风带输送和局地再蒸发产生水汽的补充,降水量大幅衰减。在距离研究区较近(200 km)的云南腾冲地区,前人根据模式模拟的研究结果认为[64],其降水中δ18O平均值呈现雨季低(-8.33 ‰)而旱季高(-3.21 ‰)的季节动态,与降水量之间存在明显的负相关关系(r=-0.64,p < 0.01),即降水量效应。考虑到研究区雨季降水占全年降水的87%以上,笔者认为该区年降水δ18O值主要受雨季降水(或夏季风降水量)的影响。来自气候-同位素模型模拟的结果也指出[65],我国西南地区年降水加权平均δ18O与夏季风降水量之间存在显著的负相关关系,即降水δ18O越偏负,夏季风降水愈多,反之亦然。综上,本文认为司岗里洞石笋δ18O值主要指示云南西南部夏季风降水变化,δ18O偏负(偏正),表明夏季风降水增加(减少)。
3.2 小冰期季风降水变化及区域对比高分辨率的SGL1石笋δ18O序列详细记录了云南西南部1322~1605 A.D. 和1701~1927 A.D. 时段夏季风降水的演化信息。该序列显示存在百年尺度的阶段性变化:1322~1605 A.D. 时段,石笋δ18O值整体逐渐偏正,指示季风降水逐渐减少,在1600 A.D. 前后达到最低状态(-6.84 ‰),之后石笋出现较长时间的沉积间断,很可能与这一时期降水持续减少而导致洞穴滴水供应不足有关;1701~1927 A. D. 时段,石笋δ18O值从相对偏负状态波动偏正,同样指示季风降水持续减少(图 6e)。来自印度中北部Sahiya洞[20]和我国四川神奇洞[21]的石笋在对应时段也记录到季风降水波动减少(图 6c和6d),类似的百年尺度降水变化过程在印度中东部[22]、阿曼南部[23]石笋记录中也有体现,表明小冰期时印度季风区部分地区的降水在百年尺度上可能存在相似的演变模式。值得注意的是,我国甘肃万象洞[9]和贵州董哥洞[24]石笋所揭示的东亚季风强度在1300~1600 A.D. 时段也呈现逐渐减弱的趋势,但在1601~1900 A. D. 时段却表现为增强趋势(图 6a和6b),这与上述印度季风区石笋所记录的结果有所不同。张伟宏等[18]综合对比中国季风区南、北部石笋记录(包括甘肃的万象洞和黄爷洞、贵州的董哥洞和织金洞以及湖北永兴洞等)发现,小冰期时东亚夏季风水文循环的长期演变趋势表现为先缓慢减弱而后逐渐增强的特征,整体呈“下凹”形态。由此可见,小冰期时印度季风和东亚季风在百年尺度上并不完全同步,在小冰期后半段(1700~1900 A.D.)存在反相变化的特征,这显示出小冰期亚洲季风降水在时空分布上的复杂性。当然,需要指出的是即使来自同一季风控制区,不同地区的降水变化也可能存在显著差异。例如,Sinha等[22]对比了过去600年(1400~2000 A.D.)印度中东部和东北部的石笋记录,发现两个地区的降水在百年尺度上呈现反相位变化;再如,中国北方季风边缘区的陕西大鱼洞[25]石笋记录显示小冰期时季风降水呈现逐渐增强的变化,这与邻近的甘肃万象洞[9]和黄爷洞[26]石笋所记录的结果相反,这也进一步凸显了小冰期季风降水的时空差异性和复杂性。区域地形条件、大气环流状况、局域气候及其对气候系统内外部因子响应等的差异,可能是造成小冰期降水时空差异显著的原因。样品分辨率、年代学精度和气候代用指标的敏感性等的不同又增加了区域气候对比的复杂性。
SGL1石笋δ18O序列在整体变化趋势上叠加了一系列年代际尺度的振荡旋回,显示小冰期季风降水在短时间尺度上的不稳定性。特别是在时间分辨率(约1 a)和年代控制较好的1322~1540 A.D. 时段,这种年代际振荡特征尤为显著,出现若干持续十年至数十年的δ18O偏负/偏正过程,即季风降水加强/减弱事件(图 6e)。其中9个持续时间约10~20 a、平均振幅达1.4 ‰的相对干旱事件,由老到新大体以1340 A.D.、1360 A.D.、1405 A.D.、1418 A.D.、1440 A.D.、1465 A.D.、1485 A.D.、1512 A.D. 和1532 A.D. 为中心(图 6g,编号W1~W9)。这9个干旱事件在基于越南南部树轮宽度年表重建的帕尔默干旱指数(PDSI)序列[11]中均有良好的体现,尽管两个记录在细节上有一些差异,受石笋记录年代误差的影响,在15世纪下叶存在时间差异,但总体上二者在年代际尺度上表现出类似的变化特征,相关系数为0.30(p < 0.001)(图 6f~6h)。表明这些干旱事件在中南半岛得到良好的响应并产生了广泛的影响。其中,W1和W2、W3和W4事件在时间上对应于越南树轮记录的2次显著干旱时期[11](图 6f棕色横柱),即吴哥大旱Ⅰ期(Angkor Ⅰ Drought,14世纪中晚期)和吴哥大旱Ⅱ期(Angkor Ⅱ Drought,15世纪早期),这两次显著干旱时期被认为在一定程度上加速了柬埔寨高棉帝国的灭亡[11, 66]。此外,W1~W5、W9事件在年龄误差范围内与印度中东部石笋记录的弱季风干旱时期[22, 27]相对应;W2、W3事件与印度历史上两次持续十年甚至更长时间的饥荒灾难事件[27]在发生时间上相吻合。值得注意是司岗里洞石笋所记录的年代际尺度季风降水振荡在万象洞[9]、董哥洞[24]、印度中北部[20]和神奇洞[21]石笋记录中并不突出,并且部分对应事件在持续时间、振荡幅度等细节特征上也存在差异,这一方面可能是由于样品分辨率、年代误差和不同洞穴对气候环境因子响应等的差异所导致的,而另一方面也反映了小冰期季风降水在短时间尺度上的区域差异性。
在小冰期后半段,SGL1石笋清晰显示1730~1820 A.D. 存在一个显著的δ18O偏正阶段,δ18O值在约70 a内从-9.0 ‰增加至-6.9 ‰,变幅达2.1%,之后在约20 a内较快地变负至-8.8%,指示了一个振幅较大、持续时间较长的干旱事件。整个事件呈不对称的“V”字型结构,即季风降水缓慢减少而后较快恢复的特征,降水最少也是该事件的中心时间出现在1800 A.D.。这一事件在达索普冰芯[13]、印度中东部石笋[22]、阿曼南部石笋[23]、湖北永兴洞石笋[18]、贵州董哥洞石笋[24, 67]、亚洲树轮[10]以及越南北部湖泊沉积物[68]等众多记录中均有体现,可能与18世纪末的强厄尔尼诺事件有关[23]。
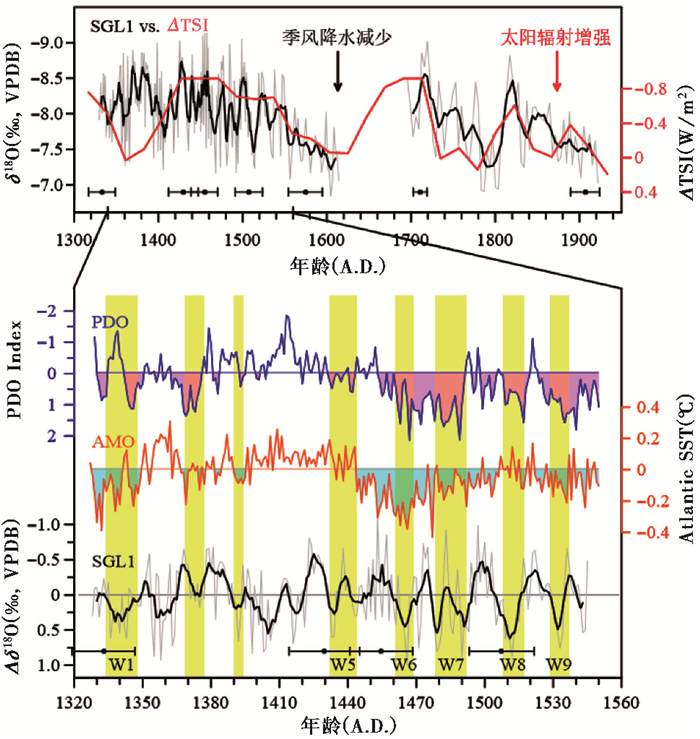
3.3 小冰期季风降水变化的驱动机制探讨太阳辐射作为地球外部能量的唯一来源,通常被认为是影响地球气候变化的最重要因素[69]。目前,已有众多研究表明百年-千年尺度气候变化与太阳活动之间存在紧密联系[9, 70~74]。传统观点认为[70~72],太阳活动与印度夏季风降水之间存在正相关关系,但也有证据[73]显示二者存在反相变化关系。对比SGL1石笋δ18O序列与太阳总辐照度(total solar irradiance, 简称TSI)记录[75](图 7),结果显示二者在百年尺度上基本同步变化,如1400~1605 A.D.、1700~1800 A.D. 和1820~1927 A.D. 时段石笋δ18O偏正均对应太阳总辐照度增大,这表明太阳活动可能是研究区小冰期百年尺度季风降水变化的主控因子,但二者呈负耦合关系,即太阳活动增强(减弱)时,研究区降水减少(增多)。这种太阳活动-季风降水的负耦合变化在我国西南地区也有记录,如四川神奇洞石笋记录显示在Wolf(1280~1340 A.D.)、Spörer(1400~1510 A.D.)、Maunder(1645~1715 A.D.)和Dalton(1796~1820 A.D.)这4个太阳活动极小期内季风降水均呈现增加趋势[21]。根据前人的研究结果[76],当太阳活动增强时,Hadley环流范围扩大,导致副热带高压区向北扩展,亚洲季风北界位置偏北,夏季研究区所处的副热带高压增强,降水减少,而当太阳活动减弱时,情况则相反。
|
图 7 SGL1石笋δ18O序列(灰色,黑色为5点平滑曲线)与太阳总辐照度(TSI)记录[75](红色)、太平洋年代际振荡(PDO)指数[79](蓝色)和大西洋海表温度记录[80](橙色)对比 水平虚线表示SGL1的δ18O平均值,黄色条柱表示δ18O偏正阶段及其与相关记录对比,误差棒表示2 σ年龄误差 Fig. 7 Comparisons of the δ18O time series of stalagmite SGL1(gray curve, darker curve is the 5-point running average)with the total solar irradiance(TSI)record[75](red curve), Pacifc Decadal Oscillation(PDO)index[79](blue curve)and Atlantic sea surface temperature record[80](orange curve) |
以往的研究发现,在年际-多年代际尺度上,印度夏季风降水除了受到太阳辐射的外胁迫作用外,来自气候系统内部的海气耦合过程也对其具有重要影响[77~78],如厄尔尼诺-南方涛动(El Niño-Southern Oscillation,简称ENSO)、太平洋年代际振荡(Pacific Decadal Oscillation,简称PDO)、大西洋多年代际振荡(Atlantic Multidecadal Oscillation,简称AMO)和印度洋偶极子(Indian Ocean Dipole,简称IOD)等。一般而言,ENSO冷相位(La Niña)、PDO冷相位、AMO暖相位和IOD正相位会使印度夏季风降水增加,反之则使降水减少[77~78]。PDO和AMO是分别发生在北太平洋和北大西洋的海表温度(SST)准周期性冷暖异常现象,二者均具有显著的年代际周期(PDO周期:15~25 a和50~70 a;AMO周期:65~80 a)[79~80]。如前文所述,小冰期云南西南部夏季风降水具有显著的年代际振荡特征,特别是在分辨率高、年代控制相对较好的1322~1540 A.D. 时段。将这一时段SGL1石笋δ18O序列与PDO指数[79]和AMO记录[80]进行对比(图 7),结果显示它们在年代际尺度上具有相似的变化,其中石笋记录的W1、W5~W9干旱事件在时间上大致对应于PDO暖相位和AMO冷相位期,由此说明小冰期研究区夏季风降水年代际尺度变化可能受到PDO和AMO的共同影响。先前的研究显示[79],当PDO处于暖相位(即东太平洋SST升高,西太平洋SST降低)时,阿留申低压减弱,西太平洋副热带高压增强并向西南方向移动,研究区下沉气流增强,因而降水减少,而当PDO处于冷相位时情况则相反。而AMO可能通过西风带和罗斯贝波对研究区降水施加影响[81]。此外,1322~1540 A.D. 高分辨率(约1 a)时段石笋δ18O序列的功率谱分析结果显示存在15 a、24 a、56 a、2.6~3.2 a和6 a周期信号(均通过90%统计置信度检验,图 8),其中15 a、24 a和56 a周期与PDO的主导周期一致,而2.6~3.2 a和6 a周期可能是研究区夏季风降水对ENSO(2~7 a周期)和(或)IOD(1~3 a周期)的响应。

|
图 8 SGL1石笋1322~1540 A.D. 时段δ18O序列功率谱分析结果 Fig. 8 Power spectral analysis of the δ18O time series of stalagmite SGL1 from 1322 A.D. to 1540 A.D. |
(1) 基于230Th定年和高分辨率碳氧稳定同位素分析,云南西南部司岗里洞SGL1石笋(长约168 mm)δ18O序列提供了1322~1605 A.D. 和1700~1927 A.D. 该区夏季风降水的变化信息。在百年尺度变化上,该石笋序列显示1322~1605 A.D. 和1700~1927 A.D. 时段的夏季风降水均呈现逐渐减弱的趋势变化,这与印度季风区石笋所记录的结果一致,但与东亚季风区石笋记录在小冰期后期(1700~1900 A.D.)呈反相变化关系,表明小冰期亚洲季风气候在百年至数百年尺度变化上的不同步性和复杂性。
(2) SGL1氧同位素序列在1322~1540 A.D. 时段呈现一系列显著的年代际振荡特征,清晰记录了9个持续时间约10~20 a、平均振幅达1.4 ‰的区域干旱事件(编号W1~W9);此外,该序列还显示1800 A.D. 前后存在一个持续约90 a、变幅达2.1 ‰的干旱事件,这些年代际尺度的干旱事件在亚洲季风区诸多气候记录中均有不同程度的体现。
(3) SGL1氧同位素序列与太阳总辐照度记录呈正相关关系,表明太阳活动可能是小冰期季风气候百年尺度变化的主要驱动因子,但二者呈负耦合关系,即太阳活动增强时,研究区季风降水减少,反之亦然。在1322~1540 A.D. 时段,SGL1记录的多年代际尺度干旱事件大多对应着PDO暖相位和AMO冷相位,功率谱分析结果显示显著的15 a、24 a、56 a、2.6~3.2 a和6 a周期,前三者类似于PDO周期,后两者类似于ENSO和(或)IOD准周期,暗示了该时段该区域多年代际气候变化可能受PDO和AMO海气耦合过程控制,而年际尺度变化可能受ENSO和(或)IOD调控。
致谢: 感谢匿名审稿人、编辑部杨美芳、赵淑君老师和郝志新研究员提出的宝贵修改意见。
| [1] |
Mann M E. Little Ice Age[M]//MacCracken M C, Perry J S. Encyclopedia of Global Environmental Change, Volume 1, The Earth System: Physical and Chemical Dimensions of Global Environmental Change. Chichester: John Wiley & Sons, Ltd., 2002: 504-509.
|
| [2] |
Soon W, Baliunas S, Idso C, et al. Reconstructing climatic and environmental changes of the past 1000 years: A reappraisal[J]. Energy & Environment, 2003, 14(2-3): 233-296. DOI:10.1260/095830503765184619 |
| [3] |
Ljungqvist F C. A new reconstruction of temperature variability in the extra-tropical Northern Hemisphere during the last two millennia[J]. Geografiska Annaler: Series A, Physical Geography, 2010, 92(3): 339-351. DOI:10.1111/j.1468-0459.2010.00399.x |
| [4] |
Petersen K L. A warm and wet Little Climatic Optimum and a cold and dry Little Ice Age in the southern Rocky Mountains, U. S.A[J]. Climatic Change, 1994, 26(2): 243-269. DOI:10.1007/BF01092417 |
| [5] |
Kulkarni C, Peteet D M, Boger R. The Little Ice Age and human-environmental interactions in the Central Balkans: Insights from a new Serbian paleorecord[J]. Quaternary International, 2018, 482: 13-26. DOI:10.1016/j.quaint.2018.04.035 |
| [6] |
方修琦, 苏筠, 郑景云, 等. 历史气候变化对中国社会经济的影响[M]. 北京: 科学出版社, 2019: 201-228. Fang Xiuqi, Su Yun, Zheng Jingyun, et al. Impacts of Climate Change on the Social Economy in China during Historical Times[M]. Beijing: Science Press, 2019: 201-228. |
| [7] |
Ding Y H, Chan J C L. The East Asian summer monsoon: An overview[J]. Meteorology and Atmospheric Physics, 2005, 89(1-4): 117-142. DOI:10.1007/s00703-005-0125-z |
| [8] |
Webster P J, Magaña V O, Palmer T N, et al. Monsoons: Processes, predictability, and the prospects for prediction[J]. Journal of Geophysical Research, 1998, 103(C7): 14451-14510. DOI:10.1029/97JC02719 |
| [9] |
Zhang P Z, Cheng H, Edwards R L, et al. A test of climate, sun, and culture relationships from an 1810-year Chinese cave record[J]. Science, 2008, 322(5903): 940-942. DOI:10.1126/science.1163965 |
| [10] |
Cook E R, Anchukaitis K J, Buckley B M, et al. Asian monsoon failure and megadrought during the last millennium[J]. Science, 2010, 328(5977): 486-489. DOI:10.1126/science.1185188 |
| [11] |
Buckley B M, Anchukaitis K J, Penny D, et al. Climate as a contributing factor in the demise of Angkor, Cambodia[J]. Proceedings of the National Academy of Sciences of the United States of America, 2010, 107(15): 6748-6752. DOI:10.1073/pnas.0910827107 |
| [12] |
Kathayat G, Cheng H, Sinha A, et al. The Indian monsoon variability and civilization changes in the Indian subcontinent[J]. Science Advances, 2017, 3(12): e1701296. DOI:10.1126/sciadv.1701296 |
| [13] |
Thompson L G, Yao T D, Mosley-Thompson E, et al. A high-resolution millennial record of the South Asian monsoon from Himalayan ice cores[J]. Science, 2000, 289(5486): 1916-1919. DOI:10.1126/science.289.5486.1916 |
| [14] |
Kaspari S, Mayewski P, Kang S, et al. Reduction in northward incursions of the South Asian monsoon since~1400 AD inferred from a Mt. Everest ice core[J]. Geophysical Research Letters, 2007, 34(16): 880-895. |
| [15] |
Anderson D M, Overpeck J T, Gupta A K. Increase in the Asian southwest monsoon during the past four centuries[J]. Science, 2002, 297(5581): 596-599. DOI:10.1126/science.1072881 |
| [16] |
Suokhrie T, Saalim S M, Saraswat R, et al. Indian monsoon variability in the last 2000 years as inferred from benthic foraminifera[J]. Quaternary International, 2018, 479: 128-140. DOI:10.1016/j.quaint.2017.05.037 |
| [17] |
蒋文静, 赵侃, 陈仕涛, 等. 小冰期十年际尺度亚洲季风变化的四川黑竹沟洞石笋记录[J]. 第四纪研究, 2017, 37(1): 118-129. Jiang Wenjing, Zhao Kan, Chen Shitao, et al. Decadal climate oscillations during the Little Ice Age of stalagmite record from Heizhugou Cave, Sichuan[J]. Quaternary Sciences, 2017, 37(1): 118-129. |
| [18] |
张伟宏, 陈仕涛, 汪永进, 等. 小冰期东亚夏季风快速变化特征: 湖北石笋记录[J]. 第四纪研究, 2019, 39(3): 765-774. Zhang Weihong, Chen Shitao, Wang Yongjin, et al. Rapid change in the East Asian summer monsoon: Stalagmite records in Hubei, China[J]. Quaternary Sciences, 2019, 39(3): 765-774. |
| [19] |
Tan L C, Cai Y J, An Z S, et al. Decreasing monsoon precipitation in Southwest China during the last 240 years associated with the warming of tropical ocean[J]. Climate Dynamics, 2017, 48(5-6): 1769-1778. DOI:10.1007/s00382-016-3171-y |
| [20] |
Sinha A, Kathayat G, Cheng H, et al. Trends and oscillations in the Indian summer monsoon rainfall over the last two millennia[J]. Nature Communications, 2015, 6: 6309. DOI:10.1038/ncomms7309 |
| [21] |
Tan L C, Cai Y J, Cheng H, et al. High resolution monsoon precipitation changes on southeastern Tibetan Plateau over the past 2300 years[J]. Quaternary Science Reviews, 2018, 195: 122-132. DOI:10.1016/j.quascirev.2018.07.021 |
| [22] |
Sinha A, Berkelhammer M, Stott L, et al. The leading mode of Indian summer monsoon precipitation variability during the last millennium[J]. Geophysical Research Letters, 2011, 38(15): 532-560. |
| [23] |
Fleitmann D, Burns S J, Neff U, et al. Palaeoclimatic interpretation of high-resolution oxygen isotope profiles derived from annually laminated speleothems from Southern Oman[J]. Quaternary Science Reviews, 2004, 23(7-8): 935-945. DOI:10.1016/j.quascirev.2003.06.019 |
| [24] |
Zhao K, Wang Y J, Edwards R L, et al. A high-resolved record of the Asian Summer Monsoon from Dongge Cave, China for the past 1200 years[J]. Quaternary Science Reviews, 2015, 122: 250-257. DOI:10.1016/j.quascirev.2015.05.030 |
| [25] |
Tan L C, Cai Y J, Cheng H, et al. Summer monsoon precipitation variations in Central China over the past 750 years derived from a high-resolution absolute-dated stalagmite[J]. Palaeogeography, Palaeoclimatology, Palaeoecology, 2009, 280(3-4): 432-439. DOI:10.1016/j.palaeo.2009.06.030 |
| [26] |
Tan L C, Cai Y J, An Z S, et al. Centennial-to decadal-scale monsoon precipitation variability in the semi-humid region, Northern China during the last 1860 years: Records from stalagmites in Huangye Cave[J]. The Holocene, 2011, 21(2): 287-296. DOI:10.1177/0959683610378880 |
| [27] |
Sinha A, Cannariato K G, Stott L D, et al. A 900-year(600 to 1500 AD) record of the Indian summer monsoon precipitation from the core monsoon zone of India[J]. Geophysical Research Letters, 2007, 34(16): L16707. DOI:10.1029/2007GL030431 |
| [28] |
薛莲花, 赵侃, 崔英方, 等. 近2000年来东亚夏季风突变的落水洞高分辨率石笋记录[J]. 第四纪研究, 2020, 40(4): 973-984. Xue Lianhua, Zhao Kan, Cui Yingfang, et al. Abrupt changes of East Asian summer monsoon over the past two millennia from stalagmite record in Luoshui Cave, Hebei Province[J]. Quaternary Sciences, 2020, 40(4): 973-984. |
| [29] |
Fang K Y, Gou X H, Chen F H, et al. Reconstructed droughts for the southeastern Tibetan Plateau over the past 568 years and its linkages to the Pacific and Atlantic Ocean climate variability[J]. Climate Dynamics, 2010, 35(4): 577-585. DOI:10.1007/s00382-009-0636-2 |
| [30] |
He M H, Yang B, Bräuning A, et al. Tree-ring derived millennial precipitation record for the south-central Tibetan Plateau and its possible driving mechanism[J]. The Holocene, 2012, 23(1): 36-45. |
| [31] |
Xu H, Zhou X Y, Lan J H, et al. Late Holocene Indian summer monsoon variations recorded at Lake Erhai, Southwestern China[J]. Quaternary Research, 2015, 83(2): 307-314. DOI:10.1016/j.yqres.2014.12.004 |
| [32] |
Sheng E G, Yu K K, Xu H, et al. Late Holocene Indian summer monsoon precipitation history at Lake Lugu, northwestern Yunnan Province, Southwestern China[J]. Palaeogeography, Palaeoclimatology, Palaeoecology, 2015, 438: 24-33. DOI:10.1016/j.palaeo.2015.07.026 |
| [33] |
谭金凤, 肖霞云, 李艳玲. 滇西北格贡错那卡湖沉积记录揭示的晚全新世气候变化[J]. 第四纪研究, 2018, 38(4): 900-911. Tan Jinfeng, Xiao Xiayun, Li Yanling. Late Holocene climatic change revealed by sediment records in Gegongcuonaka Lake, northwestern Yunnan Province[J]. Quaternary Sciences, 2018, 38(4): 900-911. |
| [34] |
郭超, 马玉贞, 刘杰瑞, 等. 过去2000年西藏羊卓雍错沉积物粒度记录的气候变化[J]. 第四纪研究, 2016, 36(2): 405-419. Guo Chao, Ma Yuzhen, Liu Jierui, et al. Climatic change recorded by grain-size in the past about 2000 years from Yamzhog Yumco Lake, Tibet[J]. Quaternary Sciences, 2016, 36(2): 405-419. |
| [35] |
范保硕, 张文胜, 张茹春, 等. 华北平原小冰期以来干湿变化与人类活动特征[J]. 第四纪研究, 2019, 39(2): 483-486. Fan Baoshuo, Zhang Wensheng, Zhang Ruchun, et al. Characteristics of dry-wet changes and human activities in the North China Plain since the Little Ice Age[J]. Quaternary Sciences, 2019, 39(2): 483-496. |
| [36] |
Zheng J Y, Wang W C, Ge Q S, et al. Precipitation variability and extreme events in Eastern China during the past 1500 years[J]. Terrestrial Atmospheric and Oceanic Sciences, 2006, 17(3): 579-592. DOI:10.3319/TAO.2006.17.3.579(A) |
| [37] |
Tan L C, Cai Y J, Yi L, et al. Precipitation variations of Longxi, northeast margin of Tibetan Plateau since AD 960 and their relationship with solar activity[J]. Climate of the Past, 2008, 4(1): 19-28. DOI:10.5194/cp-4-19-2008 |
| [38] |
Chen J H, Chen F H, Feng S, et al. Hydroclimatic changes in China and surroundings during the Medieval Climate Anomaly and Little Ice Age: Spatial patterns and possible mechanisms[J]. Quaternary Science Reviews, 2015, 107: 98-111. DOI:10.1016/j.quascirev.2014.10.012 |
| [39] |
Xu H, Lan J H, Sheng E G, et al. Hydroclimatic contrasts over Asian monsoon areas and linkages to tropical Pacific SSTs[J]. Scientific Reports, 2016, 6: 33177. DOI:10.1038/srep33177 |
| [40] |
Polanski S, Fallah B, Befort D J, et al. Regional moisture change over India during the past millennium: A comparison of multi-proxy reconstructions and climate model simulations[J]. Global and Planetary Change, 2014, 122: 176-185. DOI:10.1016/j.gloplacha.2014.08.016 |
| [41] |
Zhou X C, Jiang D B, Lang X M, et al. A multi-model analysis of 'Little Ice Age' climate over China[J]. The Holocene, 2019, 29(4): 592-605. DOI:10.1177/0959683618824761 |
| [42] |
彭友兵, 程海, 陈凯, 等. 过去千年中国东部持续性严重干旱事件的模拟研究[J]. 第四纪研究, 2019, 39(2): 282-293. Peng Youbing, Cheng Hai, Chen Kai, et al. Modeling study of severe persistent drought events over Eastern China during the last millennium[J]. Quaternary Sciences, 2019, 39(2): 282-293. |
| [43] |
Liang F Y, Brook G A, Kotlia B S, et al. Panigarh cave stalagmite evidence of climate change in the Indian Central Himalaya since AD 1256:Monsoon breaks and winter southern jet depressions[J]. Quaternary Science Reviews, 2015, 124: 145-161. DOI:10.1016/j.quascirev.2015.07.017 |
| [44] |
Cheng H, Zhang H W, Zhao J Y, et al. Chinese stalagmite paleoclimate researches: A review and perspective[J]. Science China: Earth Sciences, 2019, 62: 1489-1513. DOI:10.1007/s11430-019-9478-3 |
| [45] |
黄冉, 陈朝军, 李廷勇, 等. 基于石笋记录的晚全新世太平洋东西两岸季风区气候事件对比研究[J]. 第四纪研究, 2019, 39(3): 742-754. Huang Ran, Chen Chaojun, Li Tingyong, et al. Comparison of climatic events in the Late Holocene, based on stalagmite records from monsoon regions near by the east and west Pacific[J]. Quaternary Sciences, 2019, 39(3): 742-754. |
| [46] |
王权, 赵侃, 杨少华, 等. 湖北永兴洞降水对2015年厄尔尼诺的响应[J]. 第四纪研究, 2020, 40(4): 985-991. Wang Quan, Zhao Kan, Yang Shaohua, et al. The response of precipitation δ18O in Yongxing Cave, Hubei Province to ENSO, 2015[J]. Quaternary Sciences, 2020, 40(4): 985-991. |
| [47] |
Wang B, Lin H. Rainy season of the Asian-Pacific summer monsoon[J]. Journal of Climate, 2002, 15(4): 386-398. DOI:10.1175/1520-0442(2002)015<0386:RSOTAP>2.0.CO;2 |
| [48] |
Wu Duo, Zhou A F, Liu J B, et al. Changing intensity of human activity over the last 2000 years recorded by the magnetic characteristics of sediments from Xingyun Lake, Yunnan, China[J]. Journal of Paleolimnology, 2015, 53(1): 47-60. DOI:10.1007/s10933-014-9806-2 |
| [49] |
Zhang T W, Yang X Q, Chen Q, et al. Humidity variations spanning the 'Little Ice Age' from an upland lake in Southwestern China[J]. The Holocene, 2020, 30(2): 289-299. DOI:10.1177/0959683619883026 |
| [50] |
邓颖, 陈光杰, 刘术, 等. 基于沉积物与文献记录的茈碧湖水文波动与近现代生态环境变化[J]. 第四纪研究, 2018, 38(4): 912-925. Deng Ying, Chen Guangjie, Liu Shu, et al. Sediment and historical records of hydrological fluctuation, recent environmental and ecological changes in Cibi Lake of northwest Yunnan[J]. Quaternary Sciences, 2018, 38(4): 912-925. |
| [51] |
沧源佤族自治县地方志编纂委员会. 沧源佤族自治县志[M]. 昆明: 云南民族出版社, 1998: 53-64. Local Chronicles Compiling Committee of Cangyuan Wa Autonomous County. Annals of Cangyuan Wa Autonomous County[M]. Kunming: Yunnan Nationalities Publishing House, 1998: 53-64. |
| [52] |
Chen F H, Chen J H, Holmes J, et al. Moisture changes over the last millennium in arid Central Asia: A review, synthesis and comparison with monsoon region[J]. Quaternary Science Reviews, 2010, 29(7-8): 1055-1068. DOI:10.1016/j.quascirev.2010.01.005 |
| [53] |
Edwards R L, Chen J H, Wasserburg G J. 238U-234U-230Th-232Th systematics and the precise measurement of time over the past 500, 000 years[J]. Earth and Planetary Science Letters, 1987, 81(2-3): 175-192. DOI:10.1016/0012-821X(87)90154-3 |
| [54] |
Cheng H, Edwards R L, Shen C-C, et al. Improvements in 230Th dating, 230Th and 234U half-life values, and U-Th isotopic measurements by multi-collector inductively coupled plasma mass spectrometry[J]. Earth and Planetary Science Letters, 2013, 371-372: 82-91. DOI:10.1016/j.epsl.2013.04.006 |
| [55] |
Hendy C H. The isotopic geochemistry of speleothems-Ⅰ. The calculation of the effects of different modes of formation on the isotopic composition of speleothems and their applicability as palaeoclimatic indicators[J]. Geochimica et Cosmochimica Acta, 1917, 35(8): 801-824. DOI:10.1016/0016-7037(71)90127-x |
| [56] |
Dorale J A, Liu Z H. Limitations of Hendy test criteria in judging the paleoclimatic suitability of speleothems and the need for replication[J]. Journal of Cave and Karst Studies, 2009, 71(1): 73-80. |
| [57] |
王苏民, 刘健, 周静. 我国小冰期盛期的气候环境[J]. 湖泊科学, 2003, 15(4): 369-376. Wang Sumin, Liu Jian, Zhou Jing. The climate of Little Ice Age maximum in China[J]. Journal of Lake Sciences, 2003, 15(4): 369-376. DOI:10.3321/j.issn:1003-5427.2003.04.013 |
| [58] |
Shi F, Yang B, Gunten L V. Preliminary multiproxy surface air temperature field reconstruction for China over the past millennium[J]. Science China: Earth Sciences, 2012, 55(12): 2058-2067. DOI:10.1007/s11430-012-4374-7 |
| [59] |
Kim S T, O'Neil J R. Equilibrium and nonequilibrium oxygen isotope effects in synthetic carbonates[J]. Geochimica et Cosmochimica Acta, 1997, 61(16): 3461-3475. DOI:10.1016/S0016-7037(97)00169-5 |
| [60] |
Yonge C J, Ford D C, Gray J, et al. Stable isotope studies of cave seepage water[J]. Chemical Geology: Isotope Geoscience Section, 1985, 58(1-2): 97-105. DOI:10.1016/0168-9622(85)90030-2 |
| [61] |
Onac B P, Pace-Graczyk K, Atudirei V. Stable isotope study of precipitation and cave drip water in Florida(USA): Implications for speleothem-based paleoclimate studies[J]. Isotopes in Environmental and Health Studies, 2008, 44(2): 149-161. DOI:10.1080/10256010802066174 |
| [62] |
Gascoyne M. Palaeoclimate determination from cave calcite deposits[J]. Quaternary Science Reviews, 1992, 11(6): 609-632. DOI:10.1016/0277-3791(92)90074-I |
| [63] |
张键, 李廷勇. "雨量效应"与" 环流效应": 近1 ka亚澳季风区石笋和大气降水δ18O的气候意义[J]. 第四纪研究, 2018, 38(6): 1532-1544. Zhang Jian, Li Tingyong. "Amount effect" vs. "Circulation effect": The climate significance of precipitation and stalagmite δ18O in the Asian-Australian monsoon region over the past 1 ka[J]. Quaternary Sciences, 2018, 38(6): 1532-1544. |
| [64] |
章新平, 关华德, 孙治安, 等. 云南降水中稳定同位素变化的模拟和比较[J]. 地理科学, 2012, 32(1): 121-128. Zhang Xinping, Guan Huade, Sun Zhian, et al. Simulations of stable isotopic variations in precipitation and comparison with measured values in Yunnan Province, China[J]. Scientia Geographica Sinica, 2012, 32(1): 121-128. |
| [65] |
Liu Z Y, Wen X Y, Brady E C, et al. Chinese cave records and the East Asia summer monsoon[J]. Quaternary Science Reviews, 2014, 83: 115-128. DOI:10.1016/j.quascirev.2013.10.021 |
| [66] |
Buckley B M, Fletcher R, Wang S Y M, et al. Monsoon extremes and society over the past millennium on mainland Southeast Asia[J]. Quaternary Science Reviews, 2014, 95(7): 1-19. |
| [67] |
王健, 程海, 赵景耀, 等. 小冰期多尺度气候波动: 贵州董哥洞高分辨率石笋记录[J]. 第四纪研究, 2019, 39(3): 775-785. Wang Jian, Cheng Hai, Zhao Jingyao, et al. Climate variability during the Little Ice Age characterized by a high resolution stalagmite record from Dongge Cave, Guizhou[J]. Quaternary Sciences, 2019, 39(3): 775-785. |
| [68] |
Stevens L R, Buckley B M, Kim S, et al. Increased effective moisture in northern Vietnam during the Little Ice Age[J]. Palaeogeography, Palaeoclimatology, Palaeoecology, 2018, 511: 449-461. DOI:10.1016/j.palaeo.2018.09.011 |
| [69] |
Beer J, Mende W, Stellmacher R. The role of the sun in climate forcing[J]. Quaternary Science Reviews, 2000, 19(1-5): 403-415. DOI:10.1016/S0277-3791(99)00072-4 |
| [70] |
Neff U, Burns S J, Mangini A, et al. Strong coherence between solar variability and the monsoon in Oman between 9 and 6 kyr ago[J]. Nature, 2001, 411(6835): 290-293. DOI:10.1038/35077048 |
| [71] |
Kodera K. Solar influence on the Indian Ocean monsoon through dynamical processes[J]. Geophysical Research Letters, 2004, 31(24): 1183-1186. |
| [72] |
Malik A, Brönnimann S, Stickler A, et al. Decadal to multi-decadal scale variability of Indian summer monsoon rainfall in the coupled ocean-atmosphere-chemistry climate model SOCOL-MPIOM[J]. Climate dynamics, 2017, 49(9-10): 3551-3572. DOI:10.1007/s00382-017-3529-9 |
| [73] |
Polanski S, Fallah B, Prasad S, et al. Simulation of the Indian monsoon and its variability during the last millennium[J]. Climate of the Past Discussions, 2013, 9(1): 703-740. |
| [74] |
黄春菊, 田晓丽. 太阳活动对年代际-亚轨道尺度气候变化的驱动机制探讨[J]. 第四纪研究, 2018, 38(5): 1255-1267. Huang Chunju, Tian Xiaoli. Discussion on the driving mechanism of solar activity to interannual-suborbital-scale climate change[J]. Quaternary Sciences, 2018, 38(5): 1255-1267. |
| [75] |
Steinhilber F, Abreu J A, Beer J, et al. 9400 years of cosmic radiation and solar activity from ice cores and tree rings[J]. Proceedings of the National Academy of Sciences of the United States of America, 2012, 109(16): 5967-5971. DOI:10.1073/pnas.1118965109 |
| [76] |
赵亮, 徐影, 王劲松, 等. 太阳活动对近百年气候变化的影响研究进展[J]. 气象科技进展, 2011, 1(4): 37-48. Zhao Liang, Xu Ying, Wang Jingsong, et al. Progress in studies on the influence of solar activity on climate change during the last 100 years[J]. Advances in Meteorological Science and Technology, 2011, 1(4): 37-48. |
| [77] |
Hrudya P H, Varikoden H, Vishnu R. A review on the Indian summer monsoon rainfall, variability and its association with ENSO and IOD[J]. Meteorology and Atmospheric Physics, 2020. DOI:10.1007/s00703-020-00734-5 |
| [78] |
Malik A, Brönnimann S. Factors affecting the inter-annual to centennial timescale variability of Indian summer monsoon rainfall[J]. Climate Dynamics, 2018, 50: 4347-4364. DOI:10.1007/s00382-017-3879-3 |
| [79] |
MacDonald G M, Case R A. Variations in the Pacific Decadal Oscillation over the past millennium[J]. Geophysical Research Letters, 2005, 32(8): L08703. |
| [80] |
Wang J L, Yang B, Ljungqvist F C, et al. Internal and external forcing of multidecadal Atlantic climate variability over the past 1, 200 years[J]. Nature Geoscience, 2017, 10(7): 512-517. DOI:10.1038/ngeo2962 |
| [81] |
Ju J, Slingo J. The Asian summer monsoon and ENSO[J]. Quarterly Journal of the Royal Meteorological Society, 1995, 121(525): 1133-1168. DOI:10.1002/qj.49712152509 |
2 Key Laboratory of Humid Subtropical Eco-geographical Processes of the Ministry of Education, Fujian Normal University, Fuzhou 350007, Fujian;
3 Kunshan Zhenchuan Senior High School, Suzhou 215300, Jiangsu;
4 International Joint Research Center for Karstology, Yunnan University, Kunming 650223, Yunnan;
5 Institute of Geography, Fujian Normal University, Fuzhou 350007, Fujian;
6 Institute of Global Environmental Change, Xi'an Jiaotong University, Xi'an 710054, Shaanxi;
7 Department of Earth Sciences, University of Minnesota, Minneapolis, MN 55455, USA;
8 Key Laboratory of Cenozoic Geology and Environment, Institute of Geology and Geophysics, Chinese Academy of Sciences, Beijing 100029)
Abstract
High-resolution and precisely dated climate records are necessary for further investigating the climate variability during the Little Ice Age(LIA). Here, we present a high-resolution oxygen isotope(δ18O) time series from Sigangli Cave to characterize the climate changes during the LIA. Sigangli Cave(23°32'N, 99°33'E; 1200 m a.s.l.) is located in Cangyuan County, southwestern Yunnan, China. Regional climate of the cave is dominated by Indian summer monsoon(ISM) with moistures mainly coming from the Bay of Bengal. Mean annual temperature and precipitation in this region recorded by Cangyuan Meteorological Station are 17.7℃ and 1750 mm(1981~2010 A.D.), respectively. Most of the precipitation(about 87%) occurs during the summer monsoon season from May to October. Stalagmite SGL1 was collected in the innermost chamber of the cave with 168 mm in height and 60 mm in diameter. It is composed of gray-white, densely crystallized pure calcite. A clear hiatus was observed on the polished surface at 35~36 mm from the top. Total of 7230Th dating were performed on MC-ICPMS. Totally 350 subsamples for stable isotope measurements were drilled(325 along the vertical growth axle and 25 along horizontal layer at 5 depths for "Hendy Test"), and analyzed with MAT 253 coupling with Gasbench-Ⅱ. The SGL1 δ18O time sequence with an average resolution of 2 years covers the intervals of 1322~1605 A.D. and 1700~1927 A.D. Its variabilities are interpreted as the variation of regional monsoon precipitation.The SGL1δ18O values vary from -9.16 ‰ to -6.84 ‰, with an average value of -8.01 ‰, and exhibit centennial-scale fluctuations with increasing values from 1322 A.D. to 1605 A.D. and from 1700 A.D. to 1927 A.D., indicating the persistently decreasing trends in summer monsoon precipitation. These decreasing trends inferred from SGL1 broadly coincide with other stalagmite records from ISM region within the limitation of dating error. However, the increasing trend during interval of 1700~1927 A.D. was observed in some cave records from East Asian summer monsoon(EASM) region. The existence of inconsistent monsoon precipitation behaviors in Asian monsoon region on centennial scale reveals the complexity of monsoonal climate variation during the LIA.The most prominent feature of the SGL1 sequence is a series of decadal-scale oscillations punctuating on long-term trend. There are nine drought events(numbered W1~W9) with the duration of 10~20 years and average amplitude of 1.4 ‰ can be identified during 1322~1540 A.D., in which the time resolution of δ18O sequence is up to 1~2 years. These drought events coincide well with drought events logged in tree-ring based Palmer Drought Severity Index (PDSI) record from southern Vietnam. Within them, drought event W1~W2 and W3~W4 correspond to so called Angkor Ⅰ and Ⅱ Drought, respectively, the later was suggested as a key factor to explain the demise of Angkor Period. A more remarkable drought event, with an amplitude of 2.1 ‰ in δ18O, was identified in the interval of 1730~1820 A.D. This decadal-scale drought events were also recorded in other climate records from Asian monsoon region.The SGL1δ18O sequence is positively correlated with the total solar irradiance(TSI) on multi-centennial scale, suggesting that solar activity plays an important influence on monsoon precipitation in southwestern Yunnan through the LIA. During the interval of 1322~1540 A.D. with well dating and high resolution, our record agrees with index of Pacific Decadal Oscillation(PDO) and is similar in part with Atlantic Multi-decadal Oscillation(AMO). Most of the drought events during this time periods are corresponded to warm phases of PDO, indicates that PDO plays importance role on climate on decadal scale in study region. Spectral analysis results show significant cycles of 15, 24 and 56 years, which are similar with dominant periodicities of PDO, further supporting the PDO impact. Statistically significant periodicities of 2.6~3.2 and 6 years had also been identified, hinting influence of EI Niño-Southern Oscillation(ENSO) and/or Indian Ocean Dipole(IOD), on sub-annually scale climate in this region. 2021, Vol.41

