2 Institute of Geosciences, Christian-Albrechts-University of Kiel, D-24118 Germany)
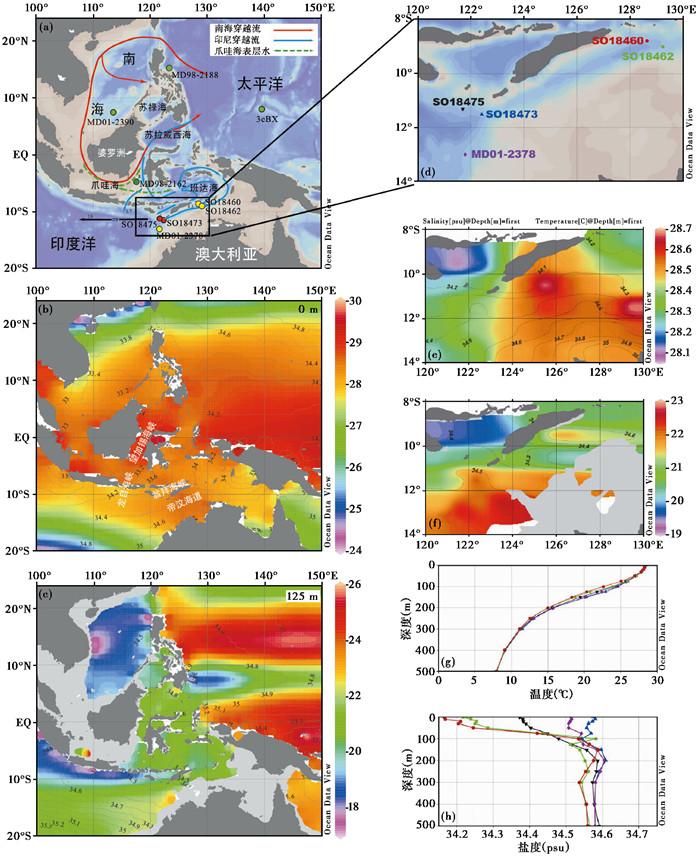
印尼穿越流(Indonesian Througflow,简称ITF)作为全球大洋循环系统在低纬海区的关键部分,是连接西太平洋和印度洋上层海水的唯一载体,调节着这两个大洋之间的热量和淡水的收支[1-3],继而在全球气候变化中扮演着重要的角色。现代海洋学观测显示,印尼穿越流的水体主要来源于北太平洋温跃层,少量来源于南大洋[4]。北太平洋温跃层水向南流动,通过苏拉威西海(Sulawesi Sea)进入望加锡海峡(Makassar Strait),然后通过龙目海峡(Lombok Strait)、翁拜海峡(Ombai Strait)和帝汶海道(Timor Passage)进入东印度洋(图 1a~1d)。

|
图 1
研究区水文环境和站位图
(a)本文涉及站位、南海穿越流(South China Sea Throughflow,简称SCSTF;红色箭头)和温跃层深度的印尼穿越流(Indonesian Throughflow,简称ITF;蓝色箭头)示意图(据文献[4, 8]绘制);研究区(b)0m和(c)125m深度温度和盐度分布;(d)放大显示帝汶海区用于建立堆叠记录的钻孔站位图;帝汶海区(e)0m和(f)125m温度和盐度分布;帝汶海区钻孔站位水体(g)温度和(h)盐度随深度分布 图件使用软件Ocean Data View[9]基于WOA2009数据[10-11]绘制;(b)、(c)、(e)和(f)中颜色分带为海水温度(℃)、等值线为海水盐度(psu);(g)和(h)中线条颜色与(d)中站位标识的颜色对应 Fig. 1 Site location of the cores and modern hydrology. (a)Sites of cores and routes of the South China Sea Throughflow(SCSTF, red arrows)and the Indonesian Througflow(ITF)in the thermocline(blue arrows)(according to Gordon, 2005[4]; Qu et al., 2009[8]); and temperature and salinity profile at water depth of (b)0m and (c)125m; amplified map for the Timor Sea showing (d) location of coring sites with their records involved in calculating the Timor Sea stacked records in this study, and temperature and salinity profile at water depth of (e)0m and (f)125m; and seawater depth profile of (g) temperature and (h) salinity at the coring sites indicated in (d). In panels (b), (c), (e)and (f), the color scales denote temperature and iso-lines indicate salinity. Depth profiles in (e) and (f) for each core are indicated by the colored labels of coring sites in (d). Plots were made using Ocean Data View(Schlitzer, 2020)[9] based on WOA 2009 data(Antonov et al., 2010[10]; Locarnini et al., 2010[11]) |
印尼穿越流的变化与东亚季风和厄尔尼诺-南方涛动(El Niño -Southern Oscillation,简称ENSO)等气候现象密切相关。现代观测显示,在北半球冬季风的驱动下,较淡的南海表层水通过加里曼丹海峡(Kalimantan Strait)到达望加锡海峡南部,形成的“淡水楔”会抑制印尼穿越流表层流的运输,导致印尼穿越流得不到来自西太平洋表层暖水的补充而变冷,次表层流得以强化、温跃层变浅[5],使得热带东印度洋上部水体变冷[6],可能会增加东印度洋与西太平洋之间表层海水温度(Sea Surface Temperature,简称SST)的差异,反过来对东亚季风和ENSO现象形成潜在的反馈[5]。同时,北半球冬季风盛行时,望加锡海峡南部相比北部来说,表层海水相对较暖、也相对较淡[4]。这种情形在北半球夏季风盛行的时候是相反的,即印尼穿越流的表层流相对次表层流增强、水体相对较暖、望加锡海峡南北的盐度梯度减小且南部的表层海水比北部的温度稍低一些[4-5, 7]。
模拟研究显示厄尔尼诺事件发生时印尼穿越流的流量明显减弱[12]。如果印尼穿越流关闭,则热带东印度洋表层海水变冷、温跃层变浅,热带东太平洋表层海水变暖,西太平洋暖池(年平均表层海水温度超过28℃的西太平洋地区[13])降水中心东移,厄尔尼诺强度和频率都会大大增加[14]。2008~2009年望加锡海峡内印尼穿越流的观测结果显示,厄尔尼诺事件诱发的南海穿越流(South China Sea Throughflow, 简称SCSTF)的加强驱使低密度的南海表层海水穿过苏禄海(Sulu Sea)经由西布图海道(Sibutu Passage)进入望加锡海峡的北部(图 1b),继而阻止西太平洋表层海水进入望加锡海峡;拉尼娜(La NiÖa,即ENSO冷期)事件时,南海穿越流几乎为零,西太平洋温暖的表层海水则会顺利进入望加锡海峡,然后到达印度洋[15]。印尼穿越流的传输因此会潜在造成区域表层海水温度的差异、继而影响区域气候[15]。东亚季风和ENSO影响着西太平洋边缘海的洋流和降水模式,尽管其影响行为仍在讨论之中。有研究表明,类似超级ENSO(Mega-ENSO)在北半球夏季风的强化中扮演了重要的角色[16]。因此,非常有必要探寻东亚季风和ENSO活动之间的联系,包括它们对西太平洋暖池及其边缘海影响的范围和程度,而印尼穿越流便是一个良好的研究载体。
用于获得帝汶海区堆叠记录和作为对比的其他海区钻孔记录所处站位信息见表 1[17-29];另外,根据Anand等[30]、Bemis和Spero[31]计算公式,对帝汶海区印尼穿越流出口处的一些钻孔研究发现这些钻孔古海洋学记录在长时间尺度上的演化存在着很高的相似性(图 2)。当然这些记录之间也存在着一些差异,但与这些钻孔站位现今的海洋学性质之间的差异非常类似(图 1e~1h)。比如,在这些钻孔记录中,SO18460站的表层和温跃层海水温度(Thermocline Temperature,简称TT)整体而言较低,而SO18473站的相对较高(图 2),特别是在末次冰期和冰消期时最为显著。这一特征与我们所见的现今这些站位处的水文环境吻合很好(图 1e~1h),可能是由于在末次冰期-冰消期时的较冷气候状态下信号的放大作用强化了钻孔记录之间的差异。既然在长时间尺度上,帝汶海区钻孔记录存在着非常一致的变化趋势,将这些记录进行堆叠(stacked)或许能更好地捕捉出口处印尼穿越流的平均信号,并方便与其他海区的钻孔记录进行对比。本文涉及的帝汶海区钻孔古海洋记录的分析和测试工作是在同一个实验室完成的,排除了实验室之间的误差,有利于开展堆叠工作。因此,本文尝试对这些钻孔记录进行堆叠处理,讨论印尼穿越流出口处古海洋学平均信号的变化。由于浮游有孔虫壳体δ18O和Mg/Ca分析测试方法以及与海水温度和海水δ18O(δ18Osw)之间转换公式等内容频繁见诸于文献中,在此不再赘述。
| 表 1 文中涉及钻孔站位信息 Table 1 Introduction to coring sites involved in this study |

|
图 2
过去25ka以来帝汶海钻孔古海洋学记录和钻孔数据堆叠记录
(a)浮游有孔虫表层水种Globigerinoides ruber壳体δ18O;(b)温跃层水种Pulleniatina obliquiloculata壳体δ18O;(c)根据Gs. ruber壳体Mg/Ca利用Anand等(2003)[30]350~500μm粒径通用属种Mg/Ca-温度转换公式计算的表层海水温度(SST);(d)根据P.obliquiloculata壳体Mg/Ca利用Anand等(2003)[30]250~350μm粒径特定属种Mg/Ca-温度转换公式计算的温跃层温度(TT);(e)基于Gs. ruber壳体δ18O和Mg/Ca温度计算的表层海水δ18O和(f)基于P.obliquiloculata壳体δ18O和Mg/Ca温度计算的温跃层海水δ18O,海水δ18O的计算使用Bemis和Spero(1998)[31]温度-δ18O转换公式;(g)利用Mg/Ca温度计算的表层和温跃层海水温度梯度(ΔT) 转换公式见诸于许多文献中,在此不再赘述;各站位曲线见(a)中的图例;堆叠数据计算见正文 Fig. 2 Paleoceanographic records of Timor Sea cores and the stacked records over the last 25ka. (a)Planktonic foraminiferal surface-dwelling species Globigerinoides ruber shell δ18O; (b)Thermocline-dwelling species Pulleniatina obliquiloculata shell δ18O; (c)Sea surface temperature(SST)converted from Gs. ruber shell Mg/Ca using Anand et al. (2003)[30] Mg/Ca-T calibration for size fraction of 350~500μm; (d)Thermocline temperature(TT)converted from P.obliquiloculata shell Mg/Ca based on Anand et al. (2003)[30] species-specific calibration for P.obliquiloculata at size fraction of 250~350μm; (e)Surface water δ18O(δ18Osw-Gs. ruber)calculated from Gs. ruber shell δ18O and Mg/Ca based temperature; (f) Thermocline water δ18O(δ18Osw-P.obliquiloculata)calculated from P.obliquiloculata shell δ18O and Mg/Ca based temperature using the T-δ18O equation of Bemis and Spero(1998)[31]; (g)Thermal gradient(ΔT)between the sea surface and thermocline based on Mg-Ca temperature reconstruction. Marks of colored solid line with dots in each plot are shown up in the box atop the panel (a). The equations used for calculating temperatures and δ18Osw are seen in bunches of literatures and thus omitted here. See the main text for steps to calculated the Stacked records |
图 1显示帝汶海区钻孔站位位于现代暖池的西南边缘,SO18473和MD01-2378站受澳大利亚西北部较暖和较咸温跃层海水的影响,在图 1f中,很明显一个红色的舌状温暖区域;同时,盐度的等值线也为一个舌状的区域。MD98-2162和3cBX钻孔站位均位于表层海水温度>28℃的区域内,特别是3cBX孔的站位位置可能更好地捕捉暖池变化的信号[24]。
现代海洋学研究显示,近表层的南海穿越流和温跃层深度的印尼穿越流主要是受太平洋大尺度范围内风力驱动[8]。印尼穿越流温跃层流输送的季节性变化受区域季风驱动力的控制[32]。因此,过去印尼穿越流的变化,包括南海穿越流对印尼穿越流的贡献,应该或多或少地受到东亚季风驱动的影响。
图 1g显示,帝汶海区各钻孔站位之间现代海水温度随水深的分布总体上差异不大,较为明显的差异大致分布在80~200m水深,对应着温跃层的深度。在温跃层内,海水温度在SO18460站最低、在SO18473和MD01-2378站最高,钻孔站位之间的温差可达2.5℃。这一点也反映在125m水深的区域温度分布上(图 1f)。帝汶海区温跃层深度(Depth of Thermocline,简称DOT)的海水温度在空间上的分布特征可能是受澳大利亚西北岸外较暖水体的影响。尽管0m水深海水温度的区域分布显示大面积的相对暖的海水出现在帝汶海区(图 1e中黄色到红色分带)。
与温度相比,帝汶海区钻孔站位100m水深以浅的垂向盐度变化较大,水深越浅,各个站位之间盐度的差异也就越大(图 1h)。总体上,在SO18473和MD01-2378这两个站上部500m范围内盐度随水深变化不大。然而,在地理上刚好位于印尼穿越流在帝汶海道出口处的SO18460和SO18462站,其上部100m范围内盐度随水深迅速增加;这一点很可能与来自西太平洋较淡的印尼穿越流表层水以及传输路径上的海域如班达海低盐表层水对这两个站位的表层和近表层海水的影响有关(图 1b和1h)。就SO18475站海水盐度而言,应当是受到印尼海岸较淡表层水的影响。
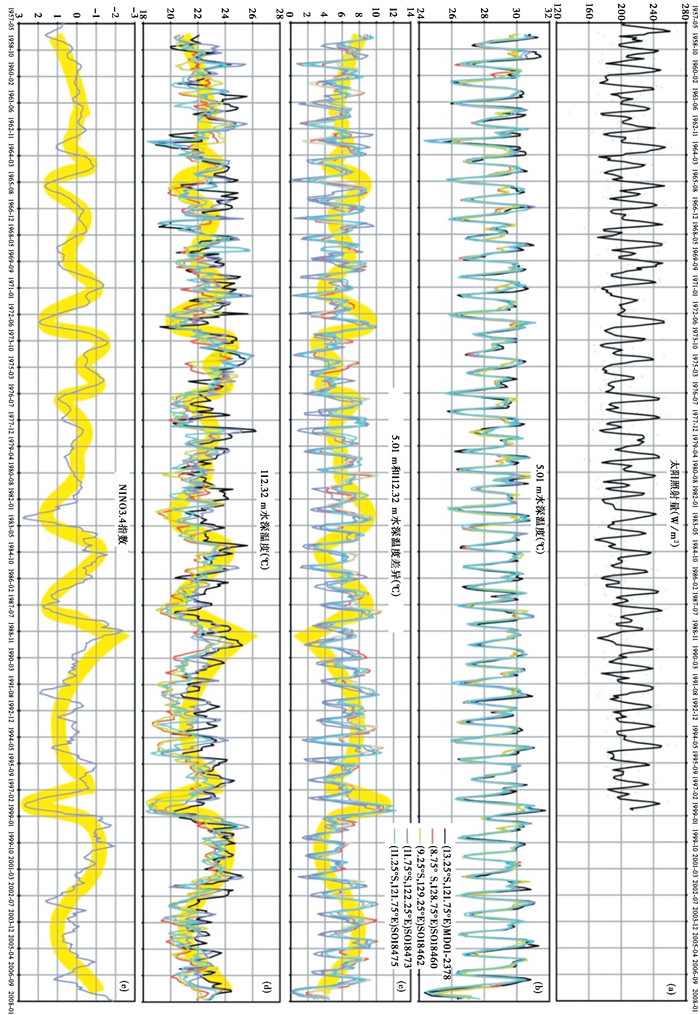
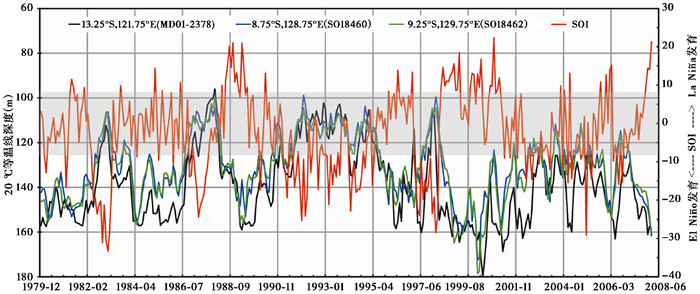
2 帝汶海现代温跃层海水温度和温跃层深度与ENSO活动的联系帝汶海现代水文学资料与太阳照射量以及ENSO指标对比(图 3),显示钻孔站位现代表层海水温度主要受太阳照射量的影响,而温跃层海水温度与ENSO活动更为密切[23]。同时,在年际变化尺度上,表层和温跃层海水的温度差异(梯度和指示温跃层深度)也与ENSO活动具有很好的对照关系(图 3c和3e)。这一点,也获得了钻孔站位现代垂向水层20℃等温线(指示温跃层)深度与ENSO活动指标之一的南方涛动指标(Southern Oscillation Index,简称SOI)相互吻合的验证(图 4)。

|
图 3
帝汶海区钻孔站位近表层和温跃层上部1957~2008年间温度与太阳照射量和ENSO对比
(a)南纬10°太阳照射量(Solar Irradiance)[35]*;(b)近表层(5.01m水深)海水温度[33]* *;(c)5.01m和112.32m水深海水温度差异;(d)温跃层上部(112.32m水深)海水温度[33]* *;(e)ENSO指标(NINO3.4指数>0.8时为厄尔尼诺、< -0.8时为拉尼娜)* * * (a)中太阳照射量的原始数据用灰色点表示,黑色实线表示原始数据的三点平滑曲线;(b)、(c)和(d)中各钻孔站位数据曲线以颜色标识,详见图例;(e)中的黄色粗线标识NINO3.4指数曲线的长尺度趋势,并复制粘贴到(c)和(d)中以展示相似的变化趋势 *太阳照射量数据来自http://iridl.ldeo.columbia.edu/SOURCES/.CAYAN/.Si/;* *海水温度数据来自http://iridl.ldeo.columbia.edu/SOURCES/.CARTON-GIESE/.SODA/.v2p0p2-4/;* * *NINO3.4综合数据来自http://www.cpc.ncep.noaa.gov/data/indices/sstoi.indices和http://www.cgd.ucar.edu/cas/catalog/climind/nino334_data.html Fig. 3 Relation of modern Timor seawater temperatures at coring sites to solar irradiance and to ENSO over the duration of 1957~2008. (a)Solar Irradiance over 10°S*(Cayan, 1992)[35]; (b)Temperatures at near surface(5.01m)* *(Carton and Giese, 2008)[33]; (c)Temperature difference between at water depth of 5.01m and 112.32m; (d)Temperatures in upper thermocline(112.32m)* *(Carton and Giese, 2008)[33]; (e) ENSO index(NINO3.4, the value of which is >0.8 for El Niño andx -0.8 for La NiÖa)* * *. Original data of Solar Irradiance in plot (a) are shown as grey dots and the black solid curve indicates three-point running average of the original data. Denotation of colored curves in plots (b), (c)and (d) is shown in the box atop plots. Broad yellow curves in plots (c), (d)and (e) were originated from a same mask of NINO 3.4 curve that was sketched for a long-term trend of NINO 3. 4. *Data were retrieved from http://iridl.ldeo.columbia.edu/SOURCES/.CAYAN/.Si/. * *Data were retrieved from http://iridl.ldeo.columbia.edu/SOURCES/.CARTON-GIESE/.SODA/.v2p0p2-4/. * * *Combined data were retrieved from http://www.cpc.ncep.noaa.gov/data/indices/sstoi.indices and http://www.cgd.ucar.edu/cas/catalog/climind/nino334_data.html |

|
图 4 帝汶海区钻孔站位1979~2008年间20℃等温线深度记录与南方涛动指标(SOI)记录对比 南方涛动指标数据来自http://www.bom.gov.au/climate/current/soihtm1.shtml Fig. 4 A 30-year record of 20℃-isotherm depth at coring sites of cores MD01-2378, SO18460 and SO18462 shows a strong correlation with the Southern Oscillation Index(SOI)in the duration of 1979~2008. Data of SOI were retrieved from http://www.bom.gov.au/climate/current/soihtm1.shtml |
帝汶海区钻孔站位之间近表层(5.01m)海水温度的差异很小,特别是在冬、夏过渡期时几乎不存在差别(图 3b)。帝汶海近表层海水温度具有很明显的季节性周期变化,尽管与太阳照射量的变化有一定的相位差别,但二者仍具有很强的同步变化特征(图 3a),表明帝汶海区表层海水温度的变化直接、或者通过季风的季节性变化间接地受太阳照射量影响。
相比较而言,帝汶海区温跃层上部(112.32m)海水温度在不同钻孔站位之间存在着明显的差异(图 3d),这一点也在海水温度随水深变化的关系图上有所显示(图 1g)。与近表层海水温度具有季节性周期变化不同,温跃层上部海水温度具有更为明显的年际周期性变化特征、并与NINO3.4指数具有密切的对应关系(图 3d和3e)。比如SO18462钻孔站位的温跃层温度与NINO3.4指数之间的线性相关系数(R2)为0.43,可能指示ENSO活动对印尼穿越流温跃层海水的影响[23]。
帝汶海区近表层和温跃层上部海水之间的温度差异的变化相对比较复杂,季节性周期变化叠加于年际变化之上(图 3c)。但是,一些较大的温度差异的变化,与重大的比如1997~1998年间的ENSO暖期事件(即厄尔尼诺)[23, 33]发生的时间十分吻合,进一步指示了帝汶海区上部水体分层和热力结构与ENSO活动之间的联系。假如越大的表层和温跃层海水温度差异指示越浅的温跃层深度,图 3c和图 3e的对比则显示帝汶海区温跃层深度的重要变浅出现在重大ENSO事件发生时。
前人利用模型研究了印尼穿越流受阻状态下印尼穿越流与ENSO活动之间的联系[12, 14, 34],结果显示印尼穿越流受阻会使得印度洋的表层海水温度降低、温跃层深度变浅,将暖池降水中心向东推移,减小西太平洋暖池和东太平洋冷舌之间表层海水温度的梯度。相似地,作为反馈,ENSO暖期事件的增强会减弱印尼穿越流的输送。尽管前人的模拟研究没有涉及印度洋温跃层温度的变化,如图 3d和3e显示非常清晰的温跃层温度与ENSO之间的关系,即帝汶海区温跃层海水比较大的降温都对应于ENSO的暖期即厄尔尼诺事件。图 4进一步展示帝汶海区温跃层变化与ENSO活动之间的联系,帝汶海区钻孔站位20℃等温线所处水深的重要变浅均发生在ENSO更偏向厄尔尼诺的气候状态时期;反之,20℃等温线水深增加则对应于拉尼娜增强的时期。这一关系表明,ENSO暖期气候态会导致印尼穿越流减弱,继而造成帝汶海区温跃层变浅。因此,不论是作为影响因素还是反馈因素,帝汶海区的温跃层变化都与ENSO活动强烈相关。
3 帝汶海区钻孔年代框架和钻孔之间记录的异同MD01-2378孔是帝汶海区研究最为成熟的钻孔之一,其年代框架基于大量AMC14C测年年龄[17-18],并获得了利用14C平台(14C plateau)事件进行优化[20],因此该孔具有非常精准的年代数据支撑。SO18460、SO18462、SO18473和SO18475的初始年龄框架均基于AMC14C测年年龄[19, 21-23],之后与MD01-2378孔进行浮游有孔虫Gs.ruberδ 18O曲线比较,获得最终的年龄模式(图 2a)。
总体上,不论是通过仪器测试获得的浮游有孔虫不同属种壳体δ18O、还是利用经验公式计算获得的不同水层海水δ18Osw,帝汶海区各钻孔记录之间都非常接近,差异小于0.5 ‰ (见图 2a、2b、2e和2f)。相比之下,各个钻孔的表层和温跃层海水温度的差异较大,特别是11ka之前的时段,比如末次冰期时,SO18460和SO18473两孔的温度差异可达4℃(图 2c和2d)。
过去25 ka帝汶海区钻孔记录中海水温度和δ18O的差别在某种程度上与这些钻孔站位现今的水文环境差异相类似(图 1e~1h)。比如,这些钻孔站位现今表层海水盐度最高的为SO18473、最低的为SO18460(图 1h)。重建的δ18Osw记录也同样显示SO18473孔相较于其他孔整体上盐度是最高的,而SO18460是最低的,特别是在末次冰期(图 2e)。
相似的情形也出现在温跃层海水温度上。SO18460钻孔站位现今125m水深的海水温度在20℃左右、SO18473在23℃左右,这与利用两个钻孔顶部样品通过P.obliquiloculata壳体Mg/Ca计算获得温跃层温度比较吻合。重建的温跃层海水温度在钻孔之间的较大差异也同样存在于末次冰期,SO18460孔的可低至18℃,而SO18473孔可高达23℃(图 2d)。末次冰期时钻孔记录之间差异增大很可能是极端冷期时由于海平面下降约110m使得各钻孔站位地理位置与现今相比距离陆地更近而导致各站之间信号差异被放大。
钻孔之间表层和温跃层海水温度梯度(ΔT)的差异相对不是太明显,在曲线形态上存在着“你中有我、我中有你”的现象(图 2g),但总体上都显示出自末次冰期以来逐渐增大的趋势,指示温跃层深度持续变浅。这一点与帝汶海区内另一个钻孔SO18480-3的结果吻合[36]。
4 帝汶海区钻孔记录堆叠数据计算为了获得堆叠记录,本文将帝汶海区每个钻孔的δ18O和Mg/Ca数据均插值成0.5ka的时间间隔;由于不同钻孔记录覆盖的时间范围有差异,为了让堆叠记录包括所有钻孔记录,本文将堆叠记录的起始年龄定在21.5ka、终止年龄定在1ka。堆叠记录的时间间隔定在0.5ka是基于帝汶海区内所研钻孔记录的平均时间分辨率:MD01-2378孔的时间分辨率约为0.1ka、SO18460孔约为0.6ka、SO18462孔约为0.1ka、SO18473孔约为0.5ka、SO18475孔约为0.5ka。海水温度和δ18Osw为在进行堆叠处理之前利用各钻孔插值后获得的浮游有孔虫壳体Mg/Ca和δ18O数据、使用Anand等(2003)[30] Mg/Ca-温度转换公式结合Bemis和Spero(1998)[31]温度-δ18O转换公式计算获得(详情见图 2说明)。然后,将这些插值后获得的记录进行堆叠处理,对同一个年龄点上的所有钻孔记录计算其平均值及其标准偏差,并进行误差检验,最终获得堆叠记录(图 2)。
获得的Gs.ruber和P.obliquiloculata壳体δ18O堆叠记录与“太阳号”(SONNE)航次钻孔的记录匹配很好,特别是SO18460和SO18462钻孔(图 2a和2b)。比较明显的偏差存在于堆叠与MD01-2378孔的δ18O记录。MD01-2378孔的Gs.ruber和P.obliquiloculata壳体δ18O整体上均比堆叠δ18O要轻,但许多数据点仍在计算误差范围内(±2σ,注意图 2a~2f中阴影所示误差范围为±1σ)。Gs.ruber和P.obliquiloculata壳体δ18O堆叠记录的t检验(Student's t-test)90 %可信度计算误差平均为0.02 ‰。
相比较,帝汶海区各钻孔表层海水温度和温跃层温度在同一时间点上的分布较为分散,特别是在15ka之前的时间点上(图 2c和2d)。堆叠获得的表层海水温度平均计算标准偏差(±1σ)和t检验90 %可信度计算误差分别为0.64℃和0.56℃,而温跃层海水分别为1.01℃和1.24℃。然而,堆叠记录有效地捕捉了各个钻孔记录中的一些重要的变化,比如所有单个的钻孔记录都显示20~19ka时表层海水温度的最低值,在堆叠记录中最低值出现在19.5ka(图 2c)。
帝汶海区各钻孔的表层和温跃层海水δ18Osw的总体变化趋势十分清晰,在同一个时间点上数据的分布也相对较为集中(图 2e和2f),因此δ18Osw堆叠记录较为精准地诠释了各个钻孔的记录。表层海水δ18Osw堆叠记录的平均计算标准偏差(±1σ)和t检验90 %可信度计算误差分别为0.16 ‰和0.04 ‰,温跃层海水δ18Osw堆叠记录的为0.22 ‰和0.06 ‰。
5 帝汶海区堆叠记录与其他海区钻孔记录对比帝汶海区堆叠记录与来自望加锡海峡南部MD98-2162孔[29]、暖池中心ODP806B[25]和3cBX孔[24]、南海南部的MD01-2390孔[26]以及西太平洋边缘菲律宾岸外的MD98-2188孔[27]的对比显示,一目了然的差别在于南海南部MD01-2390孔。
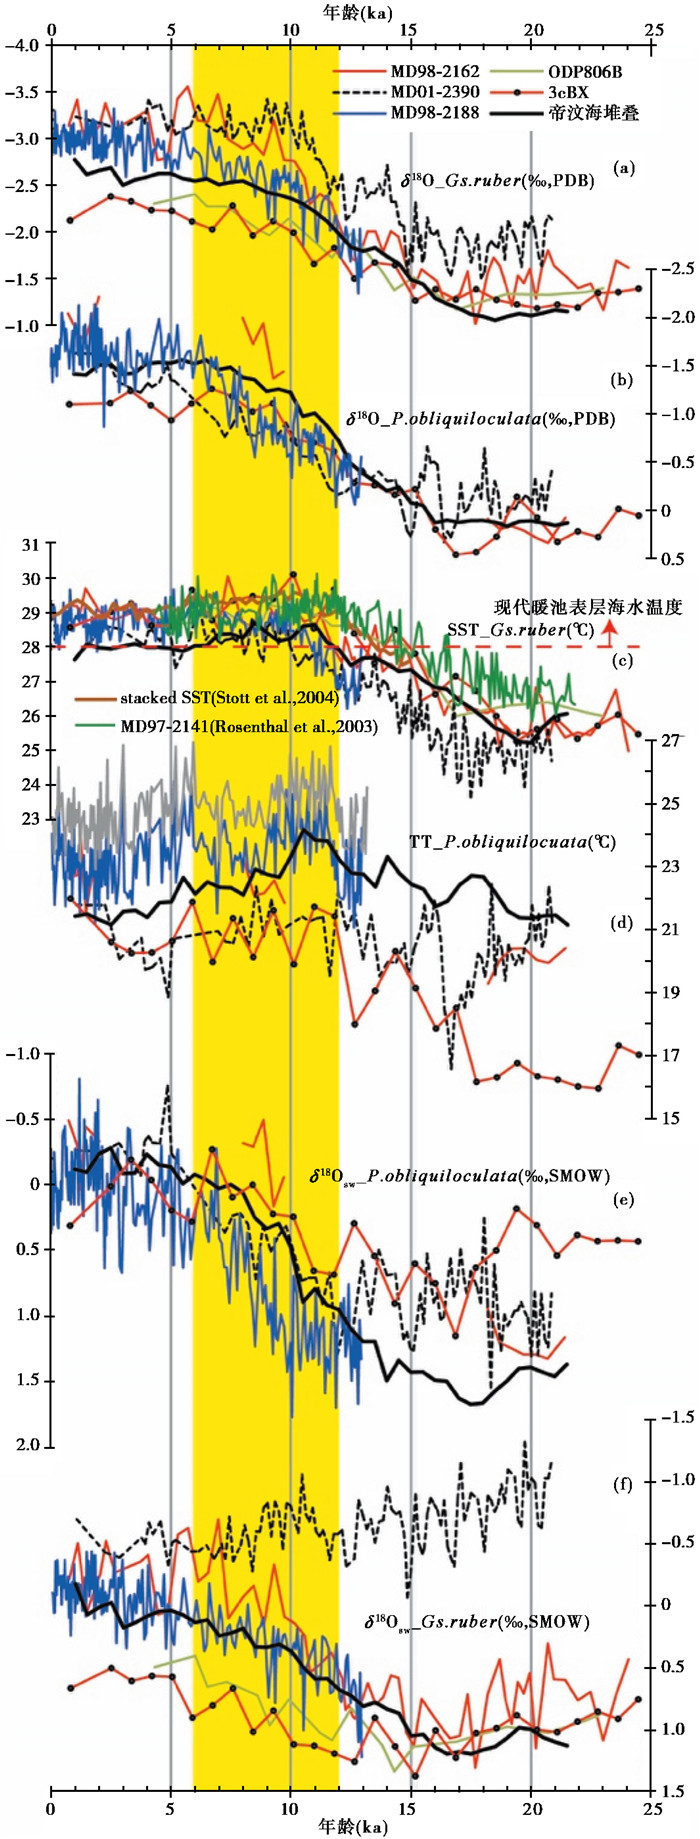
就研究区内表层海水温度而言,在整个研究时间范围内,来自暖池中心的3cBX和ODP806B孔的记录非常相似,Stott等[37]的堆叠数据与苏禄海以及帝汶海与暖池中心的记录也很接近(图 5c)。研究表明,在全新世之前,南海南部的表层海水温度相比其他海域低得多;而帝汶海堆叠记录在末次冰期和末次冰消期时与暖池中心的记录可类比。对于帝汶海堆叠记录来说,其突出的特征是显示只有在12~6ka期间,帝汶海的表层海水温度才达到28℃以上,而在全新世时期的其他时间保持在28℃左右(图 5c)。这一特征与其他海区的记录十分不同,后者的表层海水温度在整个全新世时期都在28℃以上。如果将西太平洋暖池的范围定义为28℃等温线圈闭的区域[13],则帝汶海堆叠记录可能表明在大约12~6ka期间暖池覆盖帝汶海区,也就是说帝汶海位于暖池范围内,而之后暖池范围缩小或者向东移动,使得晚全新世时帝汶海只位于暖池的边缘。

|
图 5
帝汶海钻孔堆叠记录与临近海域钻孔记录对比
临近海域的钻孔记录包括:来自南海南部的MD01-2390[26]、吕宋岛岸外的MD98-2188[27]、西太平洋暖池中心的3cBX[24]和ODP806B[25]以及西太平洋边缘钻孔堆叠表层海水温度(Stacked SST[37])和苏禄海MD97-2141孔表层海水温度[28];黄色阴影标示帝汶海堆叠表层海水温度记录超过28℃的时间范围(12~6ka) (a)Gs. ruber壳体δ18O;(b)P.obliquiloculata壳体δ18O;(c)基于Gs. ruber壳体Mg/Ca计算的表层海水温度(SST);(d)基于P.obliquiloculata壳体Mg/Ca计算的温跃层海水温度(TT);(e)根据P.obliquiloculata壳体Mg/Ca和δ18O计算的温跃层海水δ18O(δ18Osw-P.obliquiloculata)和(f)根据Gs. ruber壳体Mg/Ca和δ18O计算的表层海水δ18O(δ18Osw-Gs.ruber),其中海水δ18O的计算使用Bemis和Spero (1998)[31]温度-δ18O转换公式 各钻孔曲线见(a)中的图例,(c)中的水平红色段线标示28℃表层海水温度,现代暖池的温度边界,(d)中的灰色曲线标示MD98-2188孔的原始温跃层温度[27]、蓝色曲线为根据有孔虫壳体粒径对Mg/Ca影响校正后重新计算的该孔温跃层温度;Dang等(2012)[27]使用的P.obliquiloculata壳体大小为360~440μm粒径,而本文帝汶海区的钻孔使用的壳体大小为250~315μm粒径;根据帝汶海样品的分析,两个粒径P.obliquiloculata壳体Mg/Ca相差约0.4mmol/mol[38] Fig. 5 Stacked records of the Timor Sea cores in comparison with records from adjacent seas. The southern South China Sea(MD01-2390, Steinke et al., 2010)[26], off Luzon Island at the western Pacific(MD98-2188, Dang et al., 2012[27]), and center of the IPWP(3cBX, Sagawa et al., 2012[24]; and ODP 806B, Lea et al., 2000[25]). Stacked SST by Stott et al. (2004)[37] and Sulu Sea SST(MD97-2141, Rosenthal et al., 2003[28])are also presented here for comparison. Yellow shading denotes the duration(from 12ka to 6ka)when the stacked Timor Sea SST was over 28℃. Shell δ18O of (a) surface dwelling species Gs. ruber and of (b) thermocline dwelling species P.obliquiloculata; (c)Sea Surface Temperature(SST)and (d) Thermocline Temperature(TT)calculated from shell Mg/Ca ratios of Gs.ruber and P.obliquiloculata, respectively; and reconstructed seawater δ18O(δ18Osw)of (e) Thermocline and (f) sea surface based on shell δ18O and Mg/Ca from P.obliquiloculata and Gs. ruber, respectively, using the T-δ18O equation of Bemis and Spero(1998)[31]. Description of curves is shown in the box ridding over the plot (a). Horizontal solid dashed line indicates SST at 28℃ that defines the temperature threshold of modern warm pool. Note that grey curve in the plot (d) represents the original TT of Core MD98-2188(Dang et al., 2012)[27] and blue curve indicates re-calculated TT of the same core that has been corrected for effect of size fraction(-0.4mmol/mol based on Timor Sea samples; Xu, 2010[38]). Dang et al. (2012)[27] used the size fraction of 360~440μm for P.obliquiloculata that is in contrast to 250~315μm that we used for Timor Sea cores |
重建的表层海水δ18Osw记录显示,除了南海南部外,其他所有区域在大约12ka前具有相似的表层海水盐度(图 5f)。MD01-2390孔记录的末次冰期时盐度非常低的表层海水,很可能与陆地河流淡水输入有关。末次冰期时,海平面下降大约110m,该孔站位比现今距离陆地要近得多,更容易接受来自陆地的淡水[26]。将表层海水温度和δ18Osw记录综合起来,我们发现暖池区的这些站位,除了南海南部外,末次冰期时它们的水温和盐度都非常相似(图 5e和5f),很可能指示末次冰期时暖池区内的不同海区具有温-盐性质上较为一致的表层海水,也可能进一步地指示这些站位所在的海区在末次冰期时均(或者均不)在暖池范围之内。现代水文性质分布显示,相比暖池西部如南海、望加锡海峡、班达海等边缘海区,东印度洋表层海水具有高盐低温的特点(图 1b)。末次冰期时,帝汶海的表层海水性质与其他海区相似,表明暖池的信号压制了东印度洋的信号,这一点应当指示帝汶海位于暖池范围之内。
自大约14.5~12.5ka开始,暖池中心3cBX和ODP806B孔与其他钻孔的表层海水δ18Osw出现分异,较高的盐度出现在暖池中心区、而较低的盐度出现在南海南部和望加锡海峡;帝汶海与吕宋岸外的表层海水δ18Osw基本一致,相较于暖池中心,更加接近望加锡海峡和南海南部(图 5f)。因此,帝汶海内的印尼穿越流表层海水的盐度应与望加锡海峡和南海南部的表层水有关。在印尼穿越流的传输路径上,望加锡海峡的低盐水和南海南部较淡的表层水的混入改变了印尼穿越流表层海水的性质。中晚全新世南海南部和望加锡海峡表层海水δ18Osw逐渐趋同可窥见一斑。
对于温跃层海水来说,自末次冰期以来较高的温度出现在帝汶海区,而南海南部和暖池中心钻孔站位的温度则相对较低(图 5d)。来自吕宋岛岸外的MD98-2188孔只有全新世的温跃层海水温度记录。本文重新计算的该孔温跃层海水温度(详见图 5说明)在10.5ka前与帝汶海的堆叠数据十分相似,但在10.5ka之后要高得多。帝汶海温跃层海水温度堆叠记录的一个显著的特征,是其在10.5ka达到最高值后,以大约5.5ka为中点呈现两段式的大幅降低趋势(图 5d)。这一特征似乎在吕宋岸外的钻孔记录中也存在,只是温度降低的幅度稍弱些,但在暖池中心和南海南部的钻孔记录中则不存在。暖池中心和南海南部钻孔记录的温跃层海水温度尽管存在着较高频率的震荡,但在12~6ka间总体保持不变(图 5d),结合同样几乎没有变化的表层海水温度(图 5c),可能指示暖池中心和南海南部具有相对稳定的上部海水热力结构。相比较,12~6ka间帝汶海温跃层海水堆叠温度的持续降低,应当指示了来自暖池区相对较冷的温跃层海水通过印尼穿越流向帝汶海输送的逐渐加强;在6ka后,帝汶海堆叠温度逐渐降低,并与南海南部和暖池中心的温跃层温度趋于一致(图 5d),指示印尼穿越流温跃层流输送的进一步强化。
温跃层海水δ18Osw重建记录显示末次冰期时暖池中心、南海南部和望加锡海峡温跃层具有相似的盐度;相比之下,帝汶海区的温跃层海水盐度则要高得多。自12ka开始,帝汶海区与西太平洋其他海区的温跃层海水盐度趋于一致(图 5e),同样指示印尼穿越流温跃层流输送的加强。
6 帝汶海区堆叠记录的古海洋学意义由以上帝汶海堆叠记录与南海南部、望加锡海峡、吕宋岸外和暖池中心的记录对比(图 2和5),结合帝汶海区现代水文环境与ENSO活动关系(图 3和4),本文推测很可能末次冰期时为类拉尼娜(La NiÖa -like)状态,在12~6ka期间类拉尼娜状态有所增强,而在6ka以来以类厄尔尼诺(El Niño -like)气候态为主。
图 6显示,帝汶海区在12~6ka期间位于暖池范围内(图 6b),对应着东亚夏季风增强、冬季风减弱、巴布亚新几内亚气候湿润、ENSO事件频率较少、热带辐合带(Intertropical Convergence Zone,简称ITCZ)总体上可能向北位移。这一时期,帝汶海温跃层温度逐渐降低(图 6c),上部水体分层强化(图 6d),东印度洋较高盐度海水对温跃层海水的影响逐渐降低(图 6e)。所有的这些现象指向如下的推论:1)暖池的西向移动或者范围的扩展使得印尼穿越流的输送加强,对应着类拉尼娜的气候状态;2)东亚夏季风加强、ITCZ向北位移和类拉尼娜气候状态对区域降水的影响是一致的,因此造成印尼穿越流区域内降水的增加,淡水的输入导致印尼穿越流表层流受到抑制,温跃层流因此得以相对增强。

|
图 6
末次冰期以来帝汶海堆叠记录与古气候记录对比
(a)帝汶海表层和温跃层海水δ18O堆叠记录(δ18Osw);(b)表层海水温度(SST)堆叠记录;(c)温跃层海水温度(TT)堆叠记录(黑色实线)以及北纬65°(灰色实线)北半球夏至(6月21日)和南纬13°(黑色点线)北半球冬至(12月21日)太阳辐射量;(d)帝汶海表层和温跃层温度梯度(ΔT)堆叠记录(纵坐标反向,曲线下行指示温跃层变浅);(e)表层和温跃层δ18Osw差异(Δδ 18Osw)堆叠记录;(f)中国洞穴石笋δ18O记录作为东亚夏季风指标[40-41];(g)华南湖光岩玛珥湖(Lake Huguangyan Maar)沉积物Ti含量作为东亚冬季风指标[42];(h)卡里亚科盆地(Cariaco Basin)沉积物Ti含量作为热带辐合带(Intertropical Convergence Zone,简称ITCZ)位移指标[43];(i)巴布亚新几内亚黑炭记录作为气候干旱/湿润指标[44];(j)ENSO事件频率模拟记录[45] 阴影标识帝汶海表层海水温度堆叠记录高于28℃的时段(12~6ka);垂向灰色点状粗线标识相关记录之间的相似性(峰值) Fig. 6 Stacked Timor Sea records in comparison with climate records since the last glacial. (a)Stacked δ18O of surface and thermocline waters(δ18Osw); (b)Stacked SST; (c)Stacked TT and insolation on Jun. 21 at 65°N and on Dec. 21 at 13°S; (d)Stacked thermal gradient(ΔT)between surface and thermocline waters in the Timor Sea at a reverse scale, with increasing values showing shoaling of depth of thermocline; (e)δ18Osw difference(Δδ 18Osw)between surface and thermocline waters; (f)China cave stalagmite δ18O as a proxy of East Asian summer monsoon(Wang et al., 2001[40]; Yuan et al., 2004[41]); (g)South China Lake Huguangyan Maar Ti counts as a proxy of East Asian winter monsoon (Yancheva et al., 2007)[42]; (h)Cariaco Basin Ti counts as a proxy of Inter-tropical Convergence Zone (ITCZ) movement(Haug et al., 2001)[43]; (i)Charcoal records as an indicator of dry/humid climate of Papua New Guinea (Haberle et al., 2001)[44]; (j) Modeled frequency of ENSO events(Moy et al., 2002)[45]. The shading denotes the interval of the stacked Timor Sea SSTs above 28℃(from 12ka to 6ka). Vertical grey dashed lines mark similarities among the records |
堆叠记录显示6ka之后帝汶海区表层海水温度稍低于或者维持在28℃,表明帝汶海区总体上处于暖池的边缘(图 6b),与12~6ka期间的记录相比,进一步揭示暖池可能向东移动或者范围减小,可能指示类厄尔尼诺的气候状态。帝汶海区温跃层深度更加变浅(图 6d)、巴布亚新几内亚气候变得更加干燥(图 6i)和更为频繁的ENSO事件(图 6j)可作为6ka以来气候处于类厄尔尼诺态的佐证。然而,现代海洋学研究表明,在厄尔尼诺事件发生时,作为反馈,印尼穿越流的输送是减弱的[14, 34]。因此,印尼穿越流的表层和温跃层流的输送也均应当受到抑制。而我们的记录却显示帝汶海区温跃层海水温度和盐度都降低,指示印尼穿越流温跃层流的持续加强(图 5e、图 6c和6e)。我们推测可能的解释是,增强的东亚冬季风驱动南海南部表层海水进入到望加锡海峡的南部[5],或者是厄尔尼诺事件诱发南海穿越流加强驱使南海表层海水穿过苏禄海进入望加锡海峡的北部[15],或者二者均有,从而抑制印尼穿越流的表层流而因此使得温跃层流相对增强。有研究推测,ENSO活动可能贡献了帝汶海区温跃层海水43 %的变化,余下的变化很可能主要是受东亚季风的影响[23]。
帝汶海区温跃层海水与东亚季风之间的可能联系,除了获得Gordon等[5]的现代观测证明以外,也显示在末次冰期以来温跃层海水相关的记录,即:温跃层海水温度、表层和温跃层海水温度梯度(ΔT)和δ18O差异(Δδ 18Osw)(图 6c~6e),与东亚季风记录在几个重要的事件上具有很好的一致性,比如B/A暖期、全新世气候适宜期的开始(图 6中垂向灰色点状粗线所示)。此外,作为北半球的气候现象,东亚季风通常被认为在某种程度上与北纬65°夏至(6月21日)太阳辐射量有关联[39];而帝汶海区温跃层温度堆叠记录的长期变化趋势恰好与太阳辐射量相匹配(图 6c),却与该区纬度上(南半球)的夏至太阳辐射量相反,很可能指示帝汶海区温跃层海水接收了北半球气候变化的信号。除了因为帝汶海区温跃层海水来源于印尼穿越流且最终来自于北太平洋之外[4],东亚季风也可能通过大气过程和影响海洋过程而将北半球的信号传至帝汶海区温跃层。比如,太平洋来源的海水经过南海持续南向输送(即南海穿越流),然后通过卡里马塔海峡继续南向输送,将太平洋的信号传输至印尼海域[8]。卡里马塔海峡在大约9.5ka左右贯通,东亚冬季风驱动南海较淡的表层水才能够得以进入望加锡海峡的南部形成“淡水楔”,阻止印尼穿越流表层流,使得次表层流相对强化,从而改变印尼穿越流的垂向结构,导致帝汶海区次表层海水温度的降低和盐度的减小以及温跃层的变浅[18, 46]。图 6e显示表层和温跃层海水δ18O的差异(Δδ 18Osw)在大约9.5~9.0ka时到达0值,表明表层和温跃层海水盐度接近,而9ka后温跃层相对表层海水更淡,可能便是望加锡海峡南部“淡水楔”对印尼穿越流表层流阻碍的结果;另外图 6f和图 6g的洞穴石笋δ18O记录[40-41]和湖光岩湖沉积物Ti含量[42]也表现出一致的结果。尽管近年来中国洞穴石笋δ18O记录作为东亚夏季风指标、湖光岩湖沉积物Ti含量作为东亚冬季风指标存在着争议,但最近研究表明在切实的季风指标出现之前这些记录仍能够较为有效地指示季风的变化[47],因此本文仍予以使用。
7 结论印尼穿越流是连接西太平洋和印度洋的唯一载体,调节着这两个大洋之间的热量和淡水的收支。印尼穿越流水体分层、流量和强弱变化等与东亚季风和ENSO活动密切相关。帝汶海区是印尼穿越流的主要出口之一,该区不同钻孔末次冰期以来的古海洋学记录显示在长时间尺度上变化存在着很高的相似性。尽管这些记录之间也存在着一些差异,但与这些钻孔站位现今的海洋学性质之间的差异非常类似。同时,本文涉及的帝汶海区钻孔古海洋记录的分析和测试工作在同一个实验室完成,非常有利于开展堆叠工作。为了捕捉出口处印尼穿越流的平均信号,本文将这些记录进行堆叠,并与其他海区的钻孔记录进行对比,探讨印尼穿越流对东亚季风和ENSO活动的响应。总体上,帝汶海区各孔之间的有孔虫壳体δ18O和海水δ18Osw差异很小,但末次冰期和冰消期时海水温度记录之间差异较大,在某种程度上可与这些钻孔站位现今的水文环境差异相类比。壳体δ18O和海水δ18Osw的堆叠记录平均计算标准偏差(±1σ)和t检验90 %可信度计算误差均较小,与各钻孔记录匹配也较好;较大的差异出现在末次冰期-冰消期时期的温度堆叠记录中。末次冰期时钻孔记录之间较大的差异很可能是冷期时信号放大的缘故。帝汶海区表层海水温度堆叠记录与其他海区钻孔记录对比揭示末次冰期至12~6ka期间帝汶海可能位于暖池范围内,而晚全新世时位于暖池的边缘。自末次冰期以来较高的温跃层海水温度出现在帝汶海区,在达到最高值后呈现两段式的大幅降低趋势,帝汶海区与西太平洋其他海区的温跃层海水盐度也逐渐趋于一致,指示印尼穿越流温跃层流的逐渐加强。综合帝汶海区现代水文环境与气候的关系、不同海区钻孔记录之间对比、堆叠记录与古气候记录对比等,本文推测很可能末次冰期时为类拉尼娜状态,在12~6ka期间类拉尼娜状态有所增强,而在6ka以来以类厄尔尼诺气候态为主。除了ENSO的影响之外,东亚季风通过驱动南海穿越流将南海表层低盐水输送至望加锡海峡,阻碍印尼穿越流表层流,从而将北半球信号传送至印尼穿越流温跃层中。
致谢: 感谢编辑部杨美芳老师和审稿专家在时间和精力上对稿件的付出,他们认真细致的工作大大提高了本文内容的质量和文字表述的准确性。
| [1] |
Vranes K, Gordon A L, Ffield A. The heat transport of the Indonesian Throughflow and implications for the Indian Ocean heat budget[J]. Deep-Sea Research Ⅱ:Topical Studies in Oceanography, 2002, 49(7/8): 1391-1410. |
| [2] |
Potemra J T, Hautala S L, Sprintall J. Vertical structure of Indonesian throughflow in a large-scale model[J]. Deep Sea Research Part Ⅱ:Topical Studies in Oceanography, 2003, 50(12-13): 2143-2161. DOI:10.1016/S0967-0645(03)00050-X |
| [3] |
Gordon A L, Sprintall J, Van Aken H M, et al. The Indonesian throughflow during 2004-2006 as observed by the INSTANT program[J]. Dynamics of Atmospheres and Oceans, 2010, 50(2): 115-128. DOI:10.1016/j.dynatmoce.2009.12.002 |
| [4] |
Gordon A L. Oceanography of the Indonesian Seas and their throughflow[J]. Oceanography, 2005, 18(4): 14-27. DOI:10.5670/oceanog.2005.01 |
| [5] |
Gordon A L, Giulivi C F, Ilahude A G. Deep topographic barriers within the Indonesian seas[J]. Deep Sea Research Part Ⅱ:Topical Studies in Oceanography, 2003, 50(12-13): 2205-2228. DOI:10.1016/S0967-0645(03)00053-5 |
| [6] |
Song Q, Gordon A L, Visbeck M. Spreading of the Indonesian Throughflow in the Indian Ocean[J]. Journal of Physical Oceanography, 2004, 34: 772-792. DOI:10.1175/1520-0485(2004)034<0772:SOTITI>2.0.CO;2 |
| [7] |
Fan W, Jian Z, Chu Z, et al. Variability of the Indonesian Throughflow in the Makassar Strait over the Last 30 ka[J]. Scientific Reports, 2018, 8(1): 5678. DOI:10.1038/s41598-018-24055-1 |
| [8] |
Qu T, Song Y T, Yamagata T. An introduction to the South China Sea throughflow:Its dynamics, variability, and application for climate[J]. Dynamics of Atmospheres and Oceans, 2009, 47(1-3): 3-14. DOI:10.1016/j.dynatmoce.2008.05.001 |
| [9] |
Schlitzer R. Ocean Data View[DB]. https://odv.awi.de/.2020.
|
| [10] |
Antonov J I, Seidov D, Boyer T P, et al. World Ocean Atlas 2009, Volume 2: Salinity[M]//Levitus S ed. NOAA Atlas NESDIS 69. Washington, D. C.: US. Government Printing Office, 2010: 1-184.
|
| [11] |
Locarnini R A, Mishonov A V, Antonov J I, et al. World Ocean Atlas 2009, Volume 1: Temperature[M]//Levitus S ed. NOAA Atlas NESDIS 68. Washington, D. C.: US. Government Printing Office, 2010: 1-184.
|
| [12] |
Lee T, Fukumori I, Menemenlis D, et al. Effects of the Indonesian Throughflow on the Pacific and Indian Ocean[J]. Journal of Physical Oceanography, 2002, 32(5): 1404-1429. DOI:10.1175/1520-0485(2002)032<1404:EOTITO>2.0.CO;2 |
| [13] |
Yan X H, Ho C R, Zheng Q, et al. Temperature and size variabilities of the Western Pacific Warm Pool[J]. Science, 1992, 258(5088): 1643-1645. DOI:10.1126/science.258.5088.1643 |
| [14] |
Song Q, Vecchi G A, Rosati A J. The role of the Indonesian Throughflow in the Indo-Pacific climate variability in the GFDL Coupled Climate Model[J]. Journal of Climate, 2007, 20(11): 2434-2451. DOI:10.1175/jcli4133.1 |
| [15] |
Gordon A L, Huber B A, Metzger E J, et al. South China Sea throughflow impact on the Indonesian throughflow[J]. Geophysical Research Letters, 2012, 39: L11602. DOI:10.1029/2012GL052021 |
| [16] |
Wang B, Liu J, Kim H-J, et al. Northern Hemisphere summer monsoon intensified by mega-El Ninño/southern oscillation and Atlantic multidecadal oscillation[J]. Proceedings of the National Academy of Sciences of the Unite States of America, 2013, 110(14): 5347-5352. DOI:10.1073/pnas.1219405110 |
| [17] |
Holbourn A, Kuhnt W, Kawamura H, et al. Orbitally paced paleoproductivity variations in the Timor Sea and Indonesian Throughflow variability during the last 460 kyr[J]. Paleoceanography, 2005, 20(3): PA3002. DOI:10.1029/2004PA001094 |
| [18] |
Xu J, Holbourn A, Kuhnt W, et al. Changes in the thermocline structure of the Indonesian outflow during Terminations Ⅰ and Ⅱ[J]. Earth and Planetary Science Letters, 2008, 273(1-2): 152-162. DOI:10.1016/j.epsl.2008.06.029 |
| [19] |
Xu J, Kuhnt W, Holbourn A, et al. Indo-Pacific Warm Pool variability during the Holocene and Last Glacial Maximum[J]. Paleoceanography, 2010, 25(4): PA4230. DOI:10.1029/2010PA001934 |
| [20] |
Sarnthein M, Grootes P M, Holbourn A, et al. Tropical warming in the Timor Sea led deglacial Antarctic warming and atmospheric CO2 rise by more than 500 yr[J]. Earth and Planetary Science Letters, 2011, 302(3-4): 337-348. DOI:10.1016/j.epsl.2010.12.021 |
| [21] |
Holbourn A, Kuhnt W, Xu J. Indonesian Throughflow variability during the last 140 ka:The Timor Sea outflow[J]. Geological Society, London, Special Publications, 2011, 355(1): 283-303. DOI:10.1144/SP355.14 |
| [22] |
张鹏, 徐建, 杨策, 等. 末次冰期以来印尼穿越流出口处古海洋学记录及其意义[J]. 海洋地质与第四纪地质, 2017, 37(3): 129-137. Zhang Peng, Xu Jian, Yang Ce, et al. Paleoceanographic records of Indonesian Throughflow at its exit since the last glacial and their significance[J]. Marine Geology & Quaternary Geology, 2017, 37(3): 129-137. |
| [23] |
Xu J. Change of Indonesian Throughflow outflow in response to East Asian monsoon and ENSO activities since the Last Glacial[J]. Science China:Earth Sciences, 2014, 57(4): 791-801. DOI:10.1007/s11430-014-4845-0 |
| [24] |
Sagawa T, Yokoyama Y, Ikehara M, et al. Shoaling of the western equatorial Pacific thermocline during the Last Glacial Maximum inferred from multispecies temperature reconstruction of planktonic foraminifera[J]. Palaeogeography, Palaeoclimatology, Palaeoecology, 2012, 346-347: 120-129. DOI:10.1016/j.palaeo.2012.06.002 |
| [25] |
Lea D W, Pak D K, Spero H J. Climate Impact of Late Quaternary equatorial Pacific sea surface temperature variations[J]. Science, 2000, 289(5485): 1719-1724. DOI:10.1126/science.289.5485.1719 |
| [26] |
Steinke S, Mohtadi M, Groeneveld J, et al. Reconstructing the southern South China Sea upper water column structure since the Last Glacial Maximum:Implications for the East Asian winter monsoon development[J]. Paleoceanography, 2010, 25(2): PA2219. DOI:10.1029/2009PA001850 |
| [27] |
Dang H, Jian Z, Bassinot F, et al. Decoupled Holocene variability in surface and thermocline water temperatures of the Indo-Pacific Warm Pool[J]. Geophysical Research Letters, 2012, 39(1): L01701. DOI:10.1029/2011GL050154 |
| [28] |
Rosenthal Y, Oppo D W, Linsley B K. The amplitude and phasing of climate change during the last deglaciation in the Sulu Sea, western equatorial Pacific[J]. Geophysical Research Letters, 2003, 30(8): 1428. DOI:10.1029/2002GL016612 |
| [29] |
Visser K, Thunell R, Stott L. Magnitude and timing of temperature change in the Indo-Pacific warm pool during deglaciation[J]. Nature, 2003, 421(6919): 152-155. DOI:10.1038/nature01297 |
| [30] |
Anand P, Elderfield H, Conte M H. Calibration of Mg/Ca thermometry in planktonic foraminifera from a sediment trap time series[J]. Paleoceanography, 2003, 18(2): 1050. DOI:10.1029/2002PA000846 |
| [31] |
Bemis B E, Spero H J. Reevaluation of the oxygen isotopic composition of planktonic foraminifera:Experimental results and revised paleotemperature equations[J]. Paleoceanography, 1998, 13(2): 150-160. DOI:10.1029/98PA00070 |
| [32] |
Sprintall J, Wijffels S E, Molcard R, et al. Direct estimates of the Indonesian Throughflow entering the Indian Ocean:2004-2006[J]. Journal of Geophysical Research, 2009, 114: C07001. DOI:10.1029/2008JC005257 |
| [33] |
Carton J A, Giese B S. A reanalysis of ocean climate using Simple Ocean Data Assimilation(SODA)[J]. Monthly Weather Review, 2008, 136(8): 2999-3017. DOI:10.1175/2007MWR1978.1 |
| [34] |
Murtugudde R, Busalacchi A J, Beauchamp J. Seasonal-to-interannual effects of the Indonesian throughflow on the tropical Indo-Pacific Basin[J]. Journal of Geophysical Research:Oceans, 1998, 103(C10): 21425-21441. DOI:10.1029/98JC02063 |
| [35] |
Cayan D R. Latent and sensible heat flux anomalies over the northern oceans:The connection to monthly atmospheric circulation[J]. Journal of Climate, 1992, 5: 354-369. DOI:10.1175/1520-0442(1992)0052.0.CO;2 |
| [36] |
叶黎明, 翦知湣, 金海燕, 等. 末次盛冰期以来印度尼西亚穿越流对东印度洋上部水体结构的影响[J]. 第四纪研究, 2008, 28(3): 458-464. Ye Liming, Jian Zhimin, Jin Haiyan, et al. Influence of Indonesian Throughflow on easternmost Indian upper ocean structure since Last Glacial Maximum[J]. Quaternary Sciences, 2008, 28(3): 458-464. |
| [37] |
Stott L, Cannariato K, Thunell R, et al. Decline of surface temperature and salinity in the western tropical Pacific Ocean in the Holocene epoch[J]. Nature, 2004, 431(7004): 56-59. DOI:10.1038/nature02903 |
| [38] |
徐建. 壳体大小对浮游有孔虫生物地球化学记录的影响[J]. 矿物岩石地球化学通报, 2010, 29(2): 109-118. Xu Jian. Effect of shell size on planktonic foraminiferal biogeochemical records[J]. Bulletin of Mineralogy, Petrology and Geochemistry, 2010, 29(2): 109-118. |
| [39] |
丁仲礼. 米兰科维奇冰期旋回理论:挑战与机遇[J]. 第四纪研究, 2006, 26(5): 710-717. Ding Zhongli. The Milankovitch Theory of Pleistocene glacial cycles:Challenges and chances[J]. Quaternary Sciences, 2006, 26(5): 710-717. |
| [40] |
Wang Y J, Cheng H, Edwards R L, et al. A high-resolution absolute-dated Late Pleistocene monsoon record from Hulu Cave, China[J]. Science, 2001, 294(5550): 2345-2348. DOI:10.1126/science.1064618 |
| [41] |
Yuan D, Cheng H, Edwards R L, et al. Timing, duration and transitions of the last interglacial Asian monsoon[J]. Science, 2004, 304(5670): 575-578. DOI:10.1126/science.1091220 |
| [42] |
Yancheva G, Nowaczyk N R, Mingram J, et al. Influence of the intertropical convergence zone on the East Asian monsoon[J]. Nature, 2007, 445(7123): 74-77. DOI:10.1038/nature05431 |
| [43] |
Haug G H, Hughen K A, Sigman D M, et al. Southward migration of the intertropical convergence zone through the Holocene[J]. Science, 2001, 293(5533): 1304-1308. DOI:10.1126/science.1059725 |
| [44] |
Haberle S G, Hope G S, van der Kaars S. Biomass burning in Indonesia and Papua New Guinea:Natrual and human induced fire events in the fossil record[J]. Palaeogeography, Palaeoclimatology, Palaeoecology, 2001, 171(3-4): 259-268. DOI:10.1016/S0031-0182(01)00248-6 |
| [45] |
Moy C M, Seltzer G O, Rodbell D T, et al. Variability of El Niño/Southern Oscillation activity at millennial timescales during the Holocene epoch[J]. Nature, 2002, 420(6912): 162-165. DOI:10.1038/nature01194 |
| [46] |
Linsley B K, Rosenthal Y, Oppo D W. Holocene evolution of the Indonesian Throughflow and the Western Pacific Warm Pool[J]. Nature Geoscience, 2010, 3(8): 578-583. DOI:10.1038/NGEO920 |
| [47] |
Zhang P, Xu J, Holbourn A, et al. Indo-Pacific hydroclimate in response to changes of the Intertropical Convergence Zone:Discrepancy on precession and obliquity bands over the last 410 kyr[J]. Journal of Geophysical Research:Atmospheres, 2020, 125: e2019JD032125. DOI:10.1029/2019JD032125 |
2 Institute of Geosciences, Christian-Albrechts-University of Kiel, D-24118 Germany)
Abstract
Indonesian Throughflow(ITF) is the unique conveyor transporting upper waters from the western Pacific to the Indian Ocean and hence regulates heat and fresh water budgets between the oceans. Change in the ITF, including its upper water stratifying, transporting volume and intensity, is closely related to East Asian monsoon and El Niño -Southern Oscillation(ENSO) activities. The Timor Passage is of key importance among exits of the ITF to the Indian Ocean. Study on cores from the Timor Sea thus provides insightful understanding of ITF history. In this study, we stack the records from the Timor Sea that we reconstructed in the past years and investigate changes in the ITF and its paleoceanographic significance. Motivation to stack Timor Sea records is firstly due to the fact that these records are alike in a common trend at a long-term timescale and their differences are very likely analogs of modern differences among coring sites. For instance, sea surface and thermocline temperatures from Core SO18460 were the lowest ones and those from Core SO18473 the highest ones in particular during the last glacial and deglaciation. This feature coincides with what we see in the modern profiles at the coring sites. Secondly, all of the records from which we try to get stacked records were performed in the same laboratory using the same methods, as is helpful for reducing the errors of stacked records due to inter-lab difference. Thirdly, a stacked record expresses more general information of the ITF outflow variability and provides an advantage for comparison with records from adjacent seas.Our stacked Gs.ruber and P.obliquiloculata δ18O records well match those of SONNE cores, in particular SO18460 and SO18462. Obvious deviations are observed of stacked δ18O records from MD01-2378 δ18O records. Both of Gs.ruber and P.obliquiloculata δ18O in Core MD01-2378 are lighter than the stacked records but within the range of ±2σ(note that the error shading in Fig. 2 shows±1σ). Calculating errors using Student's-test at a confidence interval of 90% are 0.02 ‰ in average for both of Gs.ruber and P.obliquiloculata δ18O stacked records. Comparatively, data points of sea surface temperature(SST) and thermocline temperature(TT) of the Timor Sea cores are a bit of scattering at a certain age, in particular for the period prior to 15 ka, possibly due to amplification of signals in colder intervals. Standard Deviation(±1σ) and calculating error at a confidence interval of 90% are in average 0.64℃ and 0.56℃ for stacked SST, and 1.01℃ and 1.24℃ for stacked TT. However, the stacked records well display significant changes in the individual records. For instance, all of the individual SST records show lowest values at about 20~19 ka, which appears at 19.5 ka in the stacked SST. The stacked records of δ18Osw represent records of the studied cores at very good precisions, with standard deviation and calculating error of 0.16 ‰ and 0.04 ‰ for stacked surface δ18Osw, and of 0.22 ‰ and 0.06 ‰ for stacked thermocline δ18Osw.Stacked records of the Timor Sea cores in comparison with records from adjacent seas, the southern South China Sea(SCS), off Luzon Island, center of the Indo-Pacific Warm Pool(IPWP) and the Sulu Sea, show that stacked Timor Sea SST was comparable to SSTs from the center of the IPWP during the last glacial and last deglaciation. A remarkable pattern occurs to the stacked Timor Sea SST during the Holocene is that Timor Sea sustained SSTs over 28℃ merely during the period of 12 ka to 6 ka and then at around 28℃ towards the Late Holocene. This pattern is quite different from SSTs of other cores that are much higher than 28℃ over the entire Holocene. Given 28℃ defining the boundary of the IPWP, it indicates that the IPWP has been encompassing the Timor Sea during 12 ka to 6 ka and then shrank/shifted eastwards in its range to keep the Timor Sea only at its edge in the late Holocene. Taking together similar surface water δ18O(δ18Osw) as well as similar temperatures occurred in the IPWP region during the last glacial, it indicates that uniform surface waters have developed in the IPWP region, except for the southern SCS. It possibly in turn indicates that all of the areas had been within or not within the warm pool during the last glacial. After ca. 14.5~12.5 ka, surface waters very clearly differentiated in between the center of the IPWP and the other areas. Surface waters in the Timor Sea had comparable level of salinity to those off the Luzon Island, and were more similar to surface waters in the Makassar Strait and the southern SCS other than those in the center of the IPWP. Thus, it is very likely that surface waters of the ITF outflow in the Timor Sea had been freshened en route by fresher surface waters in the Makassar Strait, with possible contribution of fresher surface waters from the southern SCS, as indicated by converging in salinity of surface waters in the southern SCS and the Makassar Strait during the Late Holocene. Remarkable features of the stacked Timor Sea TTs are that it reached highest level at 10.5 ka and then significantly decreased with two steps centering at 5.5 ka. The unchanged TTs in the southern SCS and the center of the IPWP indicate a relatively stable upper ocean thermal condition. In contrast, continuous decreasing of the stacked Timor Sea TT during 12 ka to 6 ka would suggest increasing transport of relatively cool thermocline waters from the IPWP. The staked Timor Sea TT then continuously decreased and approached to levels of the TTs in the southern SCS and the center of the IPWP after 6 ka, implying more intensified transport of ITF thermocline waters. Records of thermocline water δ18O reconstructions show that there were similar saline waters in the center of the IPWP, the southern SCS and the Makassar Strait during the last glacial. Comparatively, the Timor Sea had more saline waters. Starting from 12 ka, thermocline waters in the Timor Sea yielded and then kept comparable salinities to the waters from the western Pacific.Comparison of modern hydrology profiles in the Timor Sea with local irradiance and ENSO indices indicates that SST is affected by irradiance and TT is very closely related to ENSO activities. Meanwhile, thermal gradient of upper waters between surface and thermocline is in a good relationship with ENSO activities on a long term. Comparison of stacked Timor Sea records with paleoceanographic and paleoclimatic records from other areas suggests that a La Niña -like state may have occurred during the last glacial, an enhanced La Niña -like state during 12 ka to 6 ka, and an El Niño -like state after 6 ka. In addition to influence of ENSO, the East Asian winter monsoon may also have played a role in affecting the ITF by intrusion of the South China Sea throughflow(SCSTF) waters into the Makassar Strait. In the modern days, winter monsoon driven SCSTF conveys low salinity surface waters from the SCS to the Makassar Strait either in the north via the Sulu Sea or in the south via the Java Sea, obstructing surface flow of the ITF and hence relatively enhancing the ITF thermocline flow. 2020, Vol.40
