X射线荧光(X-ray Fluorescence,简称XRF)扫描技术以其快速、无损、分辨率高等特点被广泛地应用于各类沉积物[1~6]的元素测定,进而用于揭示气候突变事件[7~10]、湖泊水文过程[11]、区域降水变化历史[12~13]以及火山活动[14]等。然而,XRF岩芯扫描得到的元素强度结果会受到岩芯含水量、孔隙度、粒度、岩芯表面结构以及有机质含量等因素的影响,导致元素强度结果不能反映元素的真实变化[15~16],比如Al和Si等原子量较小的轻元素,在被X射线激发之后产生的能量易被孔隙水吸收,导致扫描结果易受岩芯含水量的影响[17]。因此,在利用这些元素变化特征解释地质过程之前需要对由于含水量等因素造成的XRF岩芯扫描结果的准确性进行评估及校正[17]。
目前常用的评估XRF岩芯扫描结果准确性的方法是将XRF岩芯扫描结果与使用传统X射线荧光光谱法(XRF)、电感耦合等离子发射光谱法(ICP-OES/ICP-AES)等独立测试的结果进行相关分析,依据扫描结果与测试结果相关性的高低判断其精度[18~21]。结果表明,不同类型沉积物中,同一种元素的XRF扫描结果精度存在显著差异[2, 19, 22]。因此,需要对由于岩芯含水量等因素引起的扫描结果异常进行校正。目前的校正方法有标准化多项式校准方法(Normalized Polynomial-scaled Calibration,简称NPS)[15]、松脂填充法[23]、对数比(Log-ratio Calibration Equation,简称LRCE)[24]或多元对数比校正方法(Multivariate Log-ratio Calibration,简称MLC)[25]、标准化中位数校准方法(Normalized Median-scaled,简称NMS)[26]以及衰减系数校正法(Water Attenuation Correction,简称WAC)[16]。这些校正方法均能在一定程度上提高元素扫描结果的精度。
对于常用于古气候重建的湖泊沉积物,国内大部分研究仍直接利用XRF岩芯扫描的元素强度结果,或利用元素比值来进行分析[27~30],对扫描结果精度进行评估并校正的研究较少,对扫描结果中部分元素的精度以及能否用于环境变化研究缺乏定量的依据。本文以青藏高原西部高山湖泊阿翁错为研究对象,利用阿翁错湖泊沉积物岩芯,根据XRF扫描结果与传统X射线荧光光谱测试结果的相关性分析,对各元素强度的准确性进行评估。再通过对比标准化多项式校正法[15]、多元对数比校正法[25]以及标准化中位数校正法[26]的校正结果,筛选适合湖泊沉积物元素强度的校正方法,为利用湖泊沉积物的XRF扫描元素结果重建青藏高原西部气候环境变化历史奠定基础。
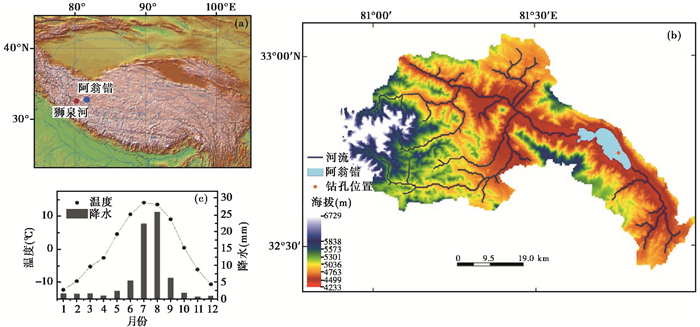
1 研究区概况阿翁错(32.70°~32.82°N,81.63°~81.80°E)位于青藏高原西部日土县境内(图 1),海拔4430 m a.s.l.,湖泊面积约69 km2 (2015年)。湖泊水的补给方式主要包括降水、冰雪融水以及地下水补给[31]。根据2015年野外实测和实验室分析的结果,该湖泊为微咸水湖,盐度为29.5 g/L,pH值为9.2。湖泊中的阳离子主要为Na+>K+>Mg2+>Ca2+,阴离子包括Cl->SO42->HCO3->CO32-。目前湖泊中碳酸盐矿物主要为文石。距离阿翁错150 km的狮泉河气象站的观测数据显示,该地区年均温为0.82 ℃,而年际温差超过20 ℃。年降水为69.11 mm,其中5~9月的降水占全年降水的87.6 %。阿翁错流域的植被类型主要为荒漠草原和高山草原。盆地内发育古近系牛堡组和第四系湖积层,基底主要为侏罗系莎木罗组与木嘎岗日群变质砂岩、变质粉砂岩和板岩[32]。阿翁错为干旱气候背景下的封闭湖泊,沉积物非常适合古气候和古环境变化研究,Li等[31]利用阿翁错湖泊沉积物代用指标支链甘油二烷基甘油四醚类脂物(brGDGTs)及叶蜡脂肪酸氢同位素(δDwax),结合现代过程研究,重建了青藏高原西部全新世以来温度与降水变化历史;但湖泊沉积物的XRF扫描元素结果尚未报道。

|
图 1 阿翁错盆地位置(a,蓝点为阿翁错位置,红点为狮泉河气象站位置)、地形和钻孔位置(b)以及狮泉河气象站1972~2012年期间月均温及月降水量变化(c),图(b)修改自Li等[31] Fig. 1 The location(a, the blue dot is the location of Aweng Co and the red dot is the location of Shiquanhe meteorological station), catchment topography and the core site of Aweng Co (b) and the mean monthly temperature and monthly precipitation (c) from Shiquanhe Station based on observed data of 1971~2012. The topography in (b)is modified based on Li et al. [31] |
2015年7月,在阿翁错湖泊中心水深6 m处利用UWITEC平台获取了2根平行岩芯AWC2015A和AWC2015B(32.745°N,81.757°E;4430 m a.s.l.)。由于AWC2015B孔较连续,因此选择此孔作为研究对象,并将AWC2015A孔411.5 cm以下样品通过岩芯颜色标志层对接到AWC2015B孔,对接之后AWC2015B孔总长度为445 cm。岩芯分为两半,一半采用荷兰生产的Avaateck XRF岩芯扫描仪进行扫描。在扫描之前,首先用聚乙烯小铲对岩芯表面进行平整处理,并对岩芯进行高分辨率拍照。之后在表面覆盖一层厚度为4 μm的Ultralene膜,然后进行XRF岩芯扫描,扫描的分辨率是2 mm。在10 kV、1 mA的条件下探头停留20s获得Al、Si、S、Cl、K、Ca、Ti、Mn和Fe的元素总强度(counts)。以5 mm分辨率对岩芯进行分样,共获得890个样品,冷冻干燥后用于实验分析。样品含水量通过冷冻干燥前后样品质量之差进行计算。以上实验在兰州大学西部环境教育部重点实验室完成。
传统XRF元素分析利用荷兰帕纳科公司生产的Epsilon 3XL X射线荧光光谱仪进行测试。将冷冻干燥后的样品用玛瑙研钵研磨之后,装入特制的容器内,放入仪器进行测试。由于岩芯不同位置含水量不同、岩性不同,为讨论含水量变化等因素对校正结果的影响,此次研究选取两组样品进行测试。第一组测试样品尽可能均匀地分布于整个钻孔,共测得19个样品;第二组选取岩芯130.5~189.5 cm之间的样品连续测试(该段岩芯含水量变化较小,岩性均一),测试分辨率为1 cm,共测得58个样品。测试结果换算为元素的百分含量。以上实验在英国诺丁汉大学地理学院完成。虽然测试分辨率为1 cm,但样品分辨率为0.5 cm,因此将每个样品覆盖的连续3个扫描结果的平均值作为XRF元素强度结果。
利用以下3种校正方法分别对AWC2015B孔XRF岩芯扫描结果中的Al、Si、K、Ca、Ti和Fe元素进行校正。
第一种校正方法为标准化多项式校正方法(NPS)[15],该方法考虑了影响因素随深度变化的情况,校正过程如下:

|
(1) |
其中,PSe,d为深度d层位的元素e经过多项式方法校正的值,Ie,d为深度d层位的元素e的XRF扫描元素强度,a、b、c和a′、b′、c′分别是元素e的强度与含量的多次多项式拟合系数。然后对校正的值进行标准化,如公式(2)所示:

|
(2) |
其中,NPSe,d为深度d层位的元素e经过标准化多项式校正的值,∑Wd为深度d层位的所有元素含量的总和,∑Sd为深度d层位经过公式(1)校正过的所有元素总和。
第二种校正方法为多元对数比校正方法(MLC)[25],该方法基于对数比校正(LRCE)过程,可以同时考虑多种变量,而且包含误差分析过程以及校正样品的自动选择,增强了MLC方法的评估效果。该过程通过软件AvaaXelerate(该软件通过www.ascar.nl获取)实现。
第三种为标准化中位数(NMS)校正方法[26],校正过程如下:

|
(3) |
其中,We,M为传统XRF元素含量测试结果中元素e含量的中位数,Ie,d为元素e在深度d层位的XRF扫描元素强度,Ie,M为整个序列中元素e强度的中位数。然后进行标准化处理,如公式(4)所示:

|
(4) |
其中,NMSe,d为标准化之后的元素e在深度d层位的值,raw sum是深度d层位的所有元素实际含量的总和。
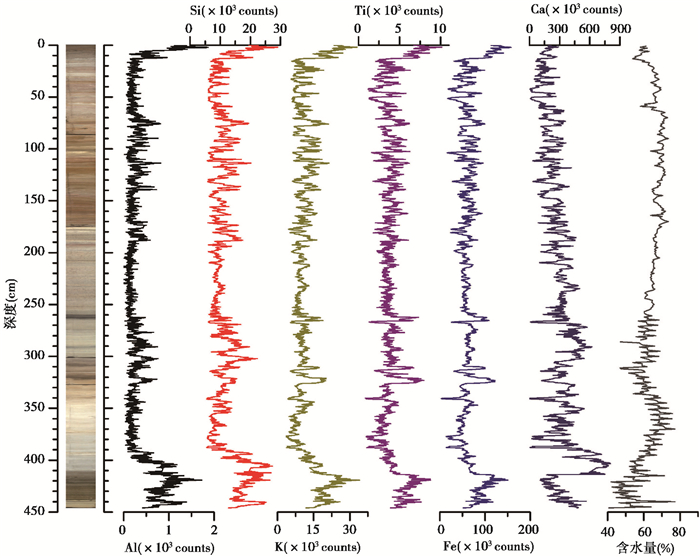
3 结果阿翁错AWC2015B孔沉积物XRF岩芯扫描的元素强度如图 2所示。结果显示Ca元素的信号强度最高,其次为Fe、Si、K和Ti元素,Al元素的强度较低。除Ca元素外,各元素在底部390 cm以下及顶部4 cm以上都出现了大幅波动,其余层位变化幅度较小。Ca元素在钻孔底部413 cm以下元素强度较低,在419~390 cm之间突然升高到整个钻孔的最高值,然后波动降低。岩芯含水量的平均值为63.1 %,底部413 cm以下含水量低于60 %,部分层位甚至低于50 %,为整个岩芯的最低值;413 cm以上岩芯含水量基本维持在60 %以上。

|
图 2 AWC2015B孔XRF岩芯扫描元素结果及岩芯含水量变化 Fig. 2 The counts of each element by XRF scanning and water content in core AWC2015B |
从第一组样品均匀分布的整个序列来看,XRF岩芯扫描元素强度与传统X射线荧光光谱仪(XRF)测得的元素含量的相关分析结果(表 1)显示,Ca、Ti和Fe这3种元素显著相关(n=19,0.30 < r2 < 0.59,P < 0.01),其中Ca和Ti的元素强度与实际含量相关性最高(r2分别为0.59和0.50);而两种结果中Si和K的相关性不显著(表 1)。从第二组部分沉积段(130.5~189.5 cm)的相关分析结果(表 2)来看,两种测试中K、Ca、Ti和Fe这4种元素均显著相关(n=58,0.35 < r2 < 0.63,P < 0.01)。其中Ca和Fe的元素强度与实际含量相关性最高(r2分别为0.63和0.62,表 2)。而XRF岩芯扫描结果中元素Al和Si与传统X射线荧光光谱仪(XRF)测试结果相关性不显著(n=58,r2 < 0.05,表 2)。
| 表 1 整个岩芯各元素强度及不同校正结果与实际含量的相关性(r2) (n=19) Table 1 Correlation(r2)of the measured elemental contents with the XRF-scanned elemental intensities (counts) and the calibrated results using different methods in the core |
| 表 2 130.5~189.5 cm之间各元素强度及不同校正结果与实际含量的相关性(r2) (n=58) Table 2 Correlation (r2) of the measured elemental contents with the XRF-scanned elemental intensities (counts) and the calibrated results using different methods in the section of 130.5~189.5 cm |
经过不同方法的校正之后,各元素的相关性变化不同。首先来看整个钻孔的校正结果(表 1),经过标准化多项式校正之后,Si、K和Ca的r2均有显著提高,其中Si的r2由0.17提高到0.26,Ca的r2由0.59提高到0.84。经过多元对数比方法校正之后,K的r2提高最多(从0.05提高到0.31)。经过中位数方法校正后,只有K的r2提高最多,由0.05提高到0.18。值得注意的是,除经过多元对数比方法校正后,Fe的r2有提高外(从0.30提高到0.48),经过其余两种校正方法校正后,Fe的r2均无提高。Ti元素强度经过3种方法校正后,r2均无提高。
对于连续取样段(表 2),经过标准化多项式方法校正之后,除Ti和Fe元素外,其他元素的r2均有显著提高,其中元素Si的r2由0.04提高到0.57。经过多元对数比方法校正之后,校正结果与实际含量之间均显著相关,其中元素Al和Si的r2提高最多,Al的r2由0.03提高到0.48,Si的r2由0.04提高到0.57。经过标准化中位数方法校正之后,只有Si元素的r2由0.04提高到0.09,其余元素的r2均没有提高。另外,Ti和Fe元素经过3种不同的方法校正之后,r2均无提高。
4 讨论 4.1 XRF岩芯扫描结果准确性评估通过XRF岩芯扫描元素强度结果与XRF元素含量测试结果的相关性分析,发现不论是从整个钻孔进行对比,还是从钻孔的某一部分进行分析,Ca、Ti和Fe这3种元素的两种测试结果都是显著相关的(表 1和2中第一行),说明XRF岩芯扫描结果中Ca、Ti和Fe这3种元素的结果较可靠。而两种测试结果中Al和Si元素的结果相关性不显著,说明XRF岩芯扫描结果中Al和Si元素的结果不可靠,即使是在岩性均一段,也在一定程度上受到了含水量等因素的影响。由于岩芯含水量较高,除岩芯底部外含水量均超过60 %,在Ultralene膜与岩芯表面之间会形成一层水膜,造成Al和Si等轻元素的元素强度显著减小[17],导致测试结果显著偏离Al和Si元素的真实强度。整个钻孔序列的K元素强度与实际含量的相关性不显著(n=19,r2=0.05),而在130.5~189.5 cm之间的K元素强度与实际含量显著相关(n=58,r2=0.35,P < 0.01),说明K的元素强度可能会受到岩性等变化的影响。因此,在阿翁错湖泊沉积物XRF岩芯扫描结果中,Ca、Ti和Fe这3种元素结果较为可靠,而Al、Si和K元素强度结果容易受到其他因素的影响,其元素强度结果并不能反映沉积物中元素变化的真实情况。因此,要使用这些元素的XRF岩芯扫描结果时,需要对其进行校正。
4.2 XRF岩芯扫描结果校正基于3种不同校正方法的校正结果与元素实际含量之间的相关分析表明,Ti和Fe两种元素经过校正后,r2均无明显提高(表 1和2)。由于3种校正方法均考虑了含水量对元素强度的影响,因此,Ti和Fe元素两种测试结果在校正之前高的相关性,以及校正之后相关性无明显提高表明这两种元素受到含水量等因素的影响较小。这与Chen等[15]的研究结果类似,元素Ti在经过含水量校正后,两种测试结果的相关性并无明显提高。因此,这两种元素不需要进行校正。
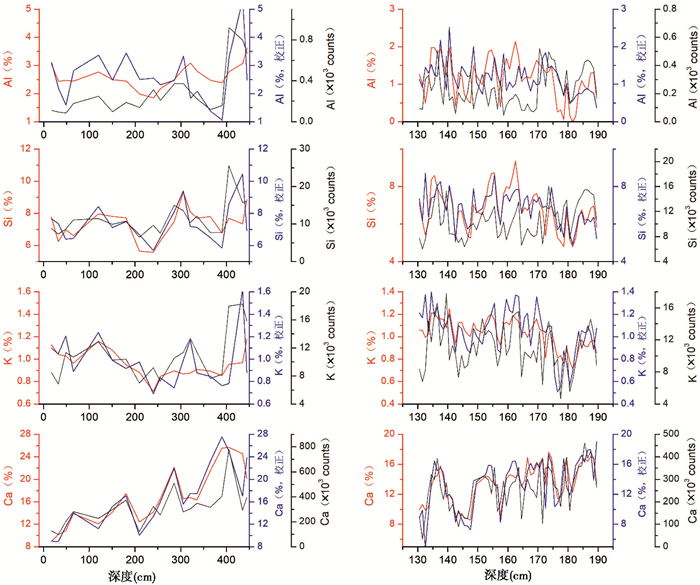
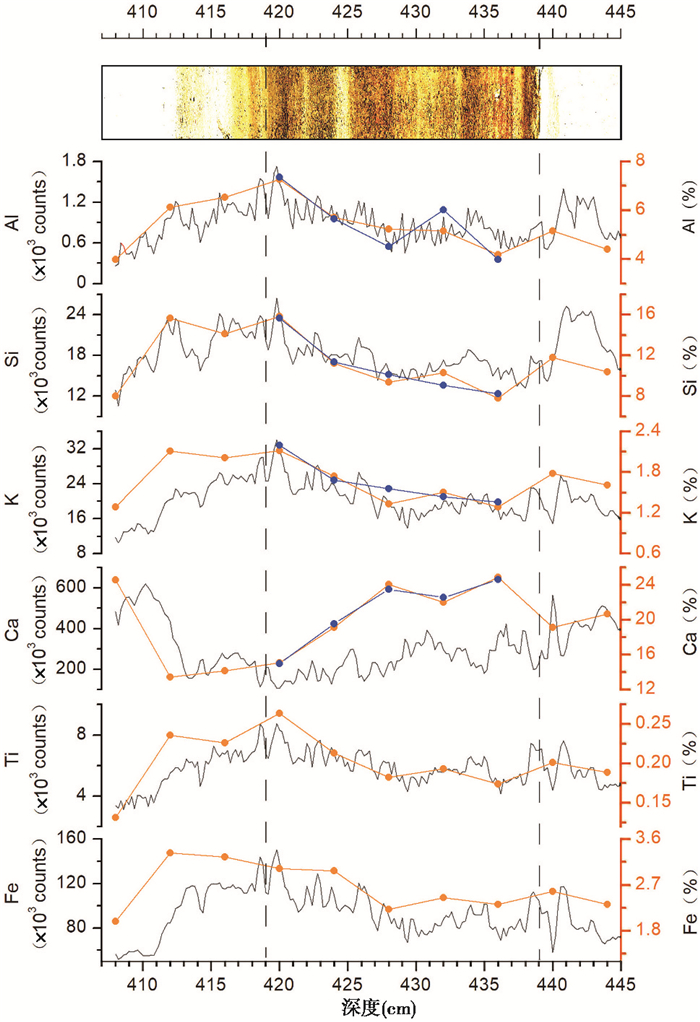
Al、Si、K和Ca在经过不同的校正方法校正后,r2有不同程度的提高。其中标准化多项式校正方法对Si和Ca的整体校正与部分校正的效果最好(表 1和2);对K的部分校正效果也是最好的(表 2);对K进行整体校正后,r2也由0.05提高到0.18(表 1)。表明该方法对Si、K和Ca在整体校正和部分校正时都适用。多元对数比校正方法和标准化中位数校正方法对整体校正和部分校正的结果均有差异,其中多元对数比校正方法在整体校正中对K的校正效果较好,r2由0.05提高到0.31(表 1),在部分校正中对Al的校正效果最好,r2由0.03提高到0.48(表 2);标准化中位数校正法对整体校正和部分校正的校正效果均不如其他两种校正方法。虽然标准化多项式校正方法对Al元素强度的校正结果不是最佳的,但经过标准化多项式方法校正之后(部分校正),Al的r2由0.03提高到0.23。根据不同校正方法对XRF岩芯扫描结果整体校正和部分校正的结果对比,认为标准化多项式方法适用于阿翁错湖泊沉积物XRF岩芯扫描结果的Al、Si、K和Ca元素强度的校正,且说明含水量等因素对扫描结果的影响可能并不是线性的。将Al、Si、K和Ca元素强度经过标准化多项式校正方法的校正结果与实际元素含量曲线进行比较(图 3),发现校正后的元素曲线基本可以反映元素含量的真实变化,尤其是Si和Ca元素强度经过校正之后与元素实际含量变化基本一致(图 3)。虽然标准化多项式校正方法对整体校正和部分校正都适用,但对部分校正的效果明显优于整体校正的效果(表 1和2)。经过整体校正后,Al、Si、K和Ca在435 cm处的校正结果均偏离元素的实际含量(图 3)。这可能是由于在岩芯底部439~419 cm之间岩芯含水量均低于60 % (图 2),为全孔最低部分,造成了沉积物表面出现裂隙(图 4,深色部分为裂隙处,颜色越深,裂隙越深)。由于X光管产生的X射线呈45°角入射,激发的特征X射线呈135°角返回信号检测器,如果存在裂隙,会影响反射信号的接收。通过对比439~419 cm(图 4中虚线)之间岩芯扫描元素强度结果与XRF元素实际含量结果发现,Al、Si、K、Ti和Fe元素强度结果受裂隙影响较小,Ca元素强度受裂隙影响较大,表现为Ca元素强度变化幅度远小于实际含量变化幅度(图 4)。通过标准化多项式校正方法对439~419 cm之间的元素强度进行部分校正,发现校正后的Ca元素变化与实际含量变化一致(图 4),r2由0.77提高到0.99(表 3);Al和Si元素与实际含量之间的相关性也有一定的提高(表 3)。因此,当由于岩芯含水量等变化造成岩芯出现明显裂隙等结构变化时,可将岩芯划分为几部分分别进行校正,从而达到最优的校正效果。

|
图 3 整个岩芯(左侧)和分段(130.5~189.5 cm,右侧)XRF扫描的元素强度(灰色线)、经NPS方法校正后各元素含量(蓝色线)和元素实际含量(橘色线)对比 Fig. 3 Comparisons among the XRF-scanned elemental intensity (grey line), the calibrated result using NPS method(blue line)and the measured elemental content (orange line). The left and the right panels are comparisons of the whole core and the section between 130.5 cm and 189.5 cm, respectively |

|
图 4 岩芯底部各元素强度(灰色实线)、校正结果(蓝色点线)与元素实际含量(橘色点线)对比 岩芯照片经过灰度处理,深色部分为岩芯裂隙处 Fig. 4 Comparisons of the XRF-scanned elemental intensity (grey line), the calibrated intensity (blue dots and line) and the measured elemental content (orange dots and line) at the bottom of the core. Grey-scale processing is applied to make the cracks more visible (dark parts) in the picture of the core |
| 表 3 420~436 cm之间各元素强度及经过标准化多项式方法校正之后与实际含量的相关性(r2) Table 3 Correlation (r2) of the XRF-scanned eiemental intensities and the calibrated elemental results using NPS methods with the measured elemental contents in the section of 420~436 cm |
本文对青藏高原西部阿翁错湖泊沉积物的XRF岩芯扫描结果与传统X射线荧光光谱仪测试结果进行相关性分析,并利用标准化多项式校正法、多元对数比校正法以及标准化中位数校正法对XRF岩芯扫描结果进行校正。得到以下结论:1)XRF岩芯扫描结果中的Ti和Fe元素不受岩芯含水量变化的影响,与传统XRF元素分析结果显著相关,结果可靠,其元素强度结果不需要校正;而Al和Si元素强度受岩芯含水量影响较大,显著偏离元素实际强度变化,与元素实际含量变化相关性不显著,结果不可靠,在利用其进行气候与环境变化重建研究前需对其进行校正。K元素强度受岩芯含水量变化影响较小,Ca元素强度受岩芯裂隙影响较大。2)不同校正方法校正结果对比显示,标准化多项式方法最适用于湖泊沉积物中Al、Si、K和Ca元素强度的校正,且对Si、K和Ca元素强度的校正效果最好,校正后的各元素结果与元素实际含量变化一致。3)由于标准化多项式方法对岩芯部分校正的效果优于整体校正,建议对由于含水量变化等因素造成的结构变化部分的XRF扫描结果进行单独校正,以获得最佳校正效果。
致谢: 感谢兰州大学西部环境教育部重点实验室潘燕辉老师在岩芯扫描过程中的指导与帮助;感谢审稿专家、编辑部杨美芳老师和赵淑君老师建设性的修改意见。
| [1] |
张喜林, 范德江, 王亮, 等. X-射线岩芯扫描系统对海洋沉积物成分测定质量的综合评价和校正[J]. 海洋学报, 2013, 35(6): 86-95. Zhang Xilin, Fan Dejiang, Wang Liang, et al. The calibration and quality evaluation of elemental analysis results of marine sediment measured by an X-ray fluorescence core scanner[J]. Acta Oceanological Sinica, 2013, 35(6): 86-95. |
| [2] |
牛洁, 张文翔, 张虎才, 等. 基于XRF连续扫描的云南抚仙湖沉积物元素特征及环境意义[J]. 光谱学与光谱分析, 2019, 39(7): 2223-2227. Niu Jie, Zhang Wenxiang, Zhang Hucai, et al. The characteristics of geochemical elements in Fuxian Lake sediments and its environmental significance based on XRF core scanning[J]. Spectroscopy and Spectral Analysis, 2019, 39(7): 2223-2227. |
| [3] |
袁悦, 李成龙, 左书豪, 等. 太湖YLL1孔沉积特征揭示的全新世太湖演化史[J]. 第四纪研究, 2019, 39(5): 1133-1147. Yuan Yue, Li Chenglong, Zuo Shuhao, et al. Holocene sedimentary characteristics of the core YLL1 of Taihu Lake revealing evolution history of Taihu Lake basin[J]. Quaternary Sciences, 2019, 39(5): 1133-1147. |
| [4] |
朱少航, 朱立平, 王君波, 等. 西藏玛旁雍错沉积揭示的晚冰期以来环境变化[J]. 第四纪研究, 2019, 39(3): 602-614. Zhu Shaohang, Zhu Liping, Wang Junbo, et al. Environmental changes reflected by core sediments since Late Glacial in Mapam Yumco, southwest Tibet of China[J]. Quaternary Sciences, 2019, 39(3): 602-614. |
| [5] |
Poto L, Gabrieli J, Crowhurst S, et al. Cross calibration between XRF and ICP-MS for high spatial resolution analysis of ombrotrophic peat cores for palaeoclimatic studies[J]. Analytical and Bioanalytical Chemistry, 2015, 407(2): 379-385. |
| [6] |
庞红丽, 高红山, 刘晓鹏, 等. 河流沉积物原位XRF岩芯扫描结果定量估算的初步研究[J]. 第四纪研究, 2016, 36(1): 237-245. Pang Hongli, Gao Hongshan, Liu Xiaopeng, et al. Preliminary study on calibration of X-ray fluorescence core scanner for quantitative element records in the Yellow River sediments[J]. Quaternary Sciences, 2016, 36(1): 237-245. |
| [7] |
Zhao C, Yu Z, Zhao Y, et al. Holocene millennial-scale climate variations documented by multiple lake-level proxies in sediment cores from Hurleg Lake, Northwest China[J]. Journal of Paleolimnology, 2010, 44(4): 995-1008. DOI:10.1007/s10933-010-9469-6 |
| [8] |
Katsuta N, Takano M, Kawakami S I, et al. Advanced micro-XRF method to separate sedimentary rhythms and event layers in sediments:Its application to lacustrine sediment from Lake Suigetsu, Japan[J]. Journal of Paleolimnology, 2007, 37(2): 259-271. DOI:10.1007/s10933-006-9028-3 |
| [9] |
Nowaczyk N R, Liu J, Frank U, et al. A high-resolution paleosecular variation record from Black Sea sediments indicating fast directional changes associated with low field intensities during marine isotope stage(MIS)4[J]. Earth and Planetary Science Letters, 2018, 484: 15-29. DOI:10.1016/j.epsl.2017.12.009 |
| [10] |
崔巧玉, 赵艳. 大兴安岭阿尔山天池湖泊沉积物记录的全新世气候突变[J]. 第四纪研究, 2019, 39(6): 1346-1356. Cui Qiaoyu, Zhao Yan. Climatic abrupt events implied by lacustrine sediments of Arxan Crater Lake, in the central Great Khingan Mountains, NE China during Holocene[J]. Quaternary Sciences, 2019, 39(6): 1346-1356. |
| [11] |
Haberzettl T, Fey M, Lücke A, et al. Climatically induced lake level changes during the last two millennia as reflected in sediments of Laguna Potrok Aike, southern Patagonia(Santa Cruz, Argentina)[J]. Journal of Paleolimnology, 2005, 33(3): 283-302. DOI:10.1007/s10933-004-5331-z |
| [12] |
Heymann C, Nelle O, Dörfler W, et al. Late Glacial to mid-Holocene palaeoclimate development of southern Greece inferred from the sediment sequence of Lake Stymphalia(NE-Peloponnese)[J]. Quaternary International, 2013, 302: 42-60. DOI:10.1016/j.quaint.2013.02.014 |
| [13] |
Metcalfe S E, Jones M D, Davies S J, et al. Climate variability over the last two millennia in the North American monsoon region, recorded in laminated lake sediments from Laguna de Juanacatlán, Mexico[J]. The Holocene, 2010, 20(8): 1195-1206. DOI:10.1177/0959683610371994 |
| [14] |
Kylander M E, Lind E M, Wastegard S, et al. Recommendations for using XRF core scanning as a tool in tephrochronology[J]. The Holocene, 2012, 22(3): 371-375. DOI:10.1177/0959683611423688 |
| [15] |
Chen Q, Kissel C, Govin A, et al. Correction of interstitial water changes in calibration methods applied to XRF core-scanning major elements in long sediment cores:Case study from the South China Sea[J]. Geochemistry, Geophysics, Geosystems, 2016, 17: 1925-1934. DOI:10.1002/2016GC006320 |
| [16] |
Hennekam R, De Lange G. X-ray fluorescence core scanning of wet marine sediments:Methods to improve quality and reproducibility of high resolution paleoenvironmental records[J]. Limnology and Oceanography:Methods, 2012, 10: 991-1003. DOI:10.4319/lom.2012.10.991 |
| [17] |
Tjallingii R, Röhl U, Kölling M, et al. Influence of the water content on X-ray fluorescence core scanning measurements in soft marine sediments[J]. Geochemistry, Geophysics, Geosystems, 2007, 8(2): 1-12. |
| [18] |
张晓楠, 张灿, 吴铎, 等. 基于XRF岩芯扫描的中国西部湖泊沉积物元素地球化学特征[J]. 海洋地质与第四纪地质, 2015, 35(1): 163-174. Zhang Xiaonan, Zhang Can, Wu Duo, et al. Element geochemical characteristics of lake sediments measured by X-ray Fluorescence(XRF)core scanner in Northwest China[J]. Marine Geology & Quaternary Geology, 2015, 35(1): 163-174. |
| [19] |
雷国良, 张虎才, 常凤琴, 等. 湖泊沉积物XRF元素连续扫描与常规ICP-OES分析结果的对比及校正——以兹格塘错为例[J]. 湖泊科学, 2011, 23(2): 287-294. Lei Guoliang, Zhang Hucai, Chang Fengqin, et al. Comparison and correction of element measurements in lacustrine sediments using X-ray fluorescence core scanning with ICP-OES method-A case study of Zigetang Co[J]. Journal of Lake Sciences, 2011, 23(2): 287-294. |
| [20] |
成艾颖, 余俊清, 高春亮, 等. 湖泊沉积物微量元素ICP-AES与XRF分析方法和相关性研究[J]. 光谱学与光谱分析, 2013, 33(7): 1949-1952. Cheng Aiying, Yu Junqing, Gao Chunliang, et al. Study on trace elements of lake sediments by ICP-AES and XRF core scanning[J]. Spectroscopy and Spectral Analysis, 2013, 33(7): 1949-1952. |
| [21] |
李婷, 张虎才, 蔡萌, 等. 抚仙湖全新世自生碳酸盐及其区域气候和湖泊水位指示意义[J]. 第四纪研究, 2019, 39(3): 642-654. Li Ting, Zhang Hucai, Cai Meng, et al. The composition of carbonate matters in the sediments from Lake Fuxian and significance of paleoclimate and water level changes[J]. Quaternary Sciences, 2019, 39(3): 642-654. |
| [22] |
周锐, 李珍, 宋兵, 等. 长江三角洲平原湖沼沉积物XRF岩芯扫描结果的可靠性分析[J]. 第四纪研究, 2013, 33(4): 697-704. Zhou Rui, Li Zhen, Song Bing, et al. Reliability analysis of X-ray fluorescence core-scanning in the Yangtze River delta limnetic sediments[J]. Quaternary Sciences, 2013, 33(4): 697-704. |
| [23] |
Katsuta N, Takano M, Sano N, et al. Quantitative micro-X-ray fluorescence scanning spectroscopy of wet sediment based on the X-ray absorption and emission theories:Its application to freshwater lake sedimentary sequences[J]. Sedimentology, 2019, 66(6): 2490-2510. DOI:10.1111/sed.12603 |
| [24] |
Weltje G J, Tjallingii R. Calibration of XRF core scanners for quantitative geochemical logging of sediment cores:Theory and application[J]. Earth and Planetary Science Letters, 2008, 274(3-4): 423-438. DOI:10.1016/j.epsl.2008.07.054 |
| [25] |
Weltje J G, Bloemsma R M, Tjallingii R, et al. Prediction of geochemical composition from XRF core scanner data: A new multivariate approach including automatic selection of calibration samples and quantification of uncertainties[M]//Croudace W I, Rothwell G R. Micro-XRF Studies of Sediment Cores: Applications of A Non-destructive Tool for the Environmental Sciences. Dordrecht, Netherlands: Springer, 2015: 507-534. doi: 10.1007/978-94-017-9849-5_21.
|
| [26] |
Lyle M, Oliarez Lyle A, Gorgas T, et al. Data report:Raw and normalized elemental data along the Site U1338 splice from X-ray fluorescence scanning[J]. Proceedings of Integrated Ocean Drilling Program, 2012, 320/321: 1-19. DOI:10.2204/iodp.proc.320321.203.2012 |
| [27] |
Hou J, Tian Q, Liang J, et al. Climatic implications of hydrologic changes in two lake catchments on the central Tibetan Plateau since the last glacial[J]. Journal of Paleolimnology, 2017, 58(2): 257-273. DOI:10.1007/s10933-017-9976-9 |
| [28] |
Zhao C, Liu Z, Rohling E J, et al. Holocene temperature fluctuations in the northern Tibetan Plateau[J]. Quaternary Research, 2013, 80(1): 55-65. DOI:10.1016/j.yqres.2013.05.001 |
| [29] |
马雪洋, 陈豆, 阳亚平, 等. 哈拉湖岩芯XRF扫描元素统计分析及其环境意义[J]. 盐湖研究, 2014, 22(4): 1-10. Ma Xueyang, Chen Dou, Yang Yaping, et al. Statistical analysis of XRF scanned elements and their environmental significance in Hala Lake, Qinghai, China[J]. Journal of Salt Lake Research, 2014, 22(4): 1-10. |
| [30] |
赵永涛, 安成邦, 赵家驹, 等. 亚洲内陆干旱区巴里坤湖记录的H1突变事件[J]. 第四纪研究, 2019, 39(4): 916-926. Zhao Yongtao, An Chengbang, Zhao Jiaju, et al. Vegetation and climate history in the arid inland area during the H1:Multi-proxy data of the Balikun Lake[J]. Quaternary Sciences, 2019, 39(4): 916-926. |
| [31] |
Li X, Wang M, Zhang Y, et al. Holocene climatic and environmental change on the western Tibetan Plateau revealed by glycerol dialkyl glycerol tetraethers and leaf wax deuterium-to-hydrogen ratios at Aweng Co[J]. Quaternary Research, 2017, 87: 455-467. DOI:10.1017/qua.2017.9 |
| [32] |
周小琳, 朱利东, 杨文光, 等. 西藏阿翁错盆地古近系牛堡组烃源岩地球化学特征[J]. 成都理工大学学报(自然科学版), 2011, 38(2): 199-203. Zhou Xiaolin, Zhu Lidong, Yang Wenguang, et al. Features of hydrocarbon source rocks of Paleogene Niubao Group in Aweng Co basin, Tibet Plateau, China[J]. Journal of Chengdu University of Technology(Science & Technology Edition), 2011, 38(2): 199-203. |
Abstract
X-ray fluorescence (XRF) scanning technology is widely used in determining the rough content of elements in sediments as it has advantages of rapid measurements, no damage to samples and high resolutions for environmental studies. However, the scanned intensities of some elements are often biased by water content and sedimentary structure of sediments, which need to be assessed and calibrated before being used in environmental researches. In order to evaluate the accuracy and reliability of the XRF scanning data, we chose core sediments from an alpine closed saline lake (salinity is 29.5 g/L and pH is 9.2), Aweng Co (32.70°~32.82°N, 81.63°~81.80°E; 4430 m a.s.l.), in western Tibet to compare the XRF scanning data and the traditional accurate XRF measurements for assessment and calibration. Two sediment cores, AWC2015A and AWC2015B (32.745°N, 81.757°E, 4430 m a.s.l, bedrocks in the catchment are Cretaceous granite and Jurassic metamorphosed sandstone), retrieved from the central part of the lake at a water depth of 6 m using a piston corer on a UWITEC platform in July 2015, were combined to a composite sequence of 445 cm in length. XRF scanning was conducted on one half of the sediment core using the Avaatech XRF core scanner at 2 mm resolution. The accuracy of the XRF scanning data are evaluated by comparing with the results of traditional XRF analyzer (Epsilon 3XL XRF analyzer) with 1 cm-resolution samples from section 130.5~189.5 cm of the core (58 samples) and another 19 samples distributed evenly along the core. The average of three XRF scanning data that cover one traditional XRF data are used to compare in this study. Then calibrations are conducted using three different methods, including the normalized polynomial-scaled (NPS) calibration, the multivariate log-ratio calibration (MLC), and the normalized median-scaled (NMS) calibration.The results show that the XRF-scanned elemental intensities of Ti and Fe are significantly correlated with the measured elemental contents by traditional XRF equipment, indicating the intensities of Ti and Fe are reliable and thus can be used without calibrations. The intensities of Al, Si and K are affected by the water content, and the intensity of Ca is influenced by the cracks in the sediments, suggesting the intensities of Al, Si, K and Ca should be properly calibrated before being used for climatic and environmental change studies. Comparisons of the results calibrated by three different methods suggested that the performance of the NPS calibration is the best and it resulted in consistent variations of the calibrated Al, Si, K and Ca with their measured contents. Separate calibrations are recommended when the structures of the sediment surface changed (e.g. cracks) during the process of scanning, which may be caused by water loss after exposure in the air during the pretreatments. 2020, Vol.40

