2 中国科学院地球环境研究所, 黄土与第四纪地质国家重点实验室, 陕西 西安 710061;
3 南京师范大学地理科学学院, 江苏 南京 210023;
4 虚拟地理环境教育部重点实验室(南京师范大学), 江苏 南京 210023;
5 江苏省地理信息资源开发与利用协同创新中心, 江苏 南京 210023;
6 南京旅游职业学院, 江苏 南京 211100)
厄尔尼诺-南方涛动(ENSO)对中国季风区大气环流有着重要影响[1],古气候重建工作对该区域不同时间尺度气候变化中的ENSO信号进行了研究[2~15]。其中,石笋δ 18O记录因具有分辨率高和定年精确等特点在重建ENSO信号的工作中具有一定的优势[10~15]。例如,Tan[10]发现1870~2000年和尚洞石笋δ 18O记录与南方涛动指数(Southern Oscillation Index,简称SOI)具有很好的相关性。高分辨率的石笋记录甚至可以捕捉到某次具体的厄尔尼诺事件。例如,Liu等[13]利用四川狮子洞一支石笋δ 18O记录成功捕捉到了1997~1998年厄尔尼诺事件,该研究发现石笋δ 18O在厄尔尼诺事件发生年份显著偏正。
中国季风区石笋δ 18O记录中的ENSO信号得到了许多观测证据的证实。西太平洋副热带高压(West Pacific Subtropic High)位置对中国季风区大气环流具有重要影响,谭明[16~17]认为在此影响下远源水汽(来自印度洋)和近源水汽(来自西太平洋)的不同贡献比例导致了中国季风区降水δ 18O在年际或更长时间尺度上的变化,称为“环流效应”。而西太平洋副高的位置变化与ENSO的不同相位状态(厄尔尼诺态和拉尼娜态)密切相关,Tan[10]系统分析了国际原子能机构(IAEA)中国站点降水δ 18O数据,也发现中国季风区降水δ 18O的年际变化主要受ENSO不同相位状态的控制。这一“环流效应”机制得到了不同地点观测研究的支持,例如河南鸡冠洞[18~19]和重庆羊口洞[20]的洞外降水δ 18O均捕捉到了2015~2016年的厄尔尼诺事件,呈现显著偏正的δ 18O值。模型研究[21~22]也显示厄尔尼诺事件确实可通过改变大气环流场导致亚洲季风区降水δ 18O偏正。这些研究证实了中国季风区降水δ 18O与ENSO之间的关系,但对同一洞穴地点的降水δ 18O观测和石笋δ 18O记录研究仍存在不足,无法形成石笋-ENSO信号之间完整的证据链。
1 研究区概况与方法赵侃等[11]报道了1788~1956A.D.湖北永兴洞石笋δ 18O记录,其与附近和尚洞记录(HS4)具有良好重现性,且与有器测记录以来的ENSO信号具有良好的对应关系(图 1)。为进一步证实这一联系,本研究对湖北永兴洞进行了为期3年(2013年6月至2016年7月)的野外观测工作[23],发现该地点大气降水δ 18O确实记录到了2015年厄尔尼诺事件,从而为该洞穴石笋δ 18O记录反演过去ENSO的变化提供了重要证据。

|
图 1 永兴洞石笋YX92[11] (a)、和尚洞石笋HS4[24] (b)δ 18O记录与南方涛动指数(c,15年平滑)对比 SOI数据来源:http://www.bom.gov.au/climate/current/soihtm1.shtml Fig. 1 Comparison between(a)the stalagmite YX92δ 18O sequence[11], (b)HS4δ 18O sequence[24] and (c, 15-year running mean) Southern Oscillation Index(SOI). The data of the SOI are obtained from http://www.bom.gov.au/climate/current/soihtm1.shtml |
永兴洞(29°44′N,109°7′E;海拔约为800m)的地质背景已在之前的研究中详细描述[25~26]。该洞位于湖北省保康县歇马镇,距离和尚洞[24]约150km。该区域受亚热带季风强烈影响,温度和降水量均呈现出显著的季节变化,夏季高温多雨,冬季寒冷少雨。从2013年6月至2016年7月,本文作者对永兴洞洞外δ 18O进行了月尺度的观测,观测方法见文献[23]。
为了确定研究地点降水水汽来源,本研究采用了由美国国家海洋与大气局(National Oceanic and Atmospheric Administration,简称NOAA)空气资源实验室(Air Resources Laboratory)开发的HYSPLIT模型(Hybrid Single Particle Lagrangian Integrated Trajectory Model)对2013~2015年5~9月降水日的水汽轨迹进行后向反演(UTC时间)。本研究使用全球再分析数据NCEP/NCAR中的气候数据系统(CDAS),分析位于850mb(约1500m)水汽的运动轨迹,时间间隔为6 h,追踪时长为240 h。最后,对水汽轨迹进行了聚类分析。
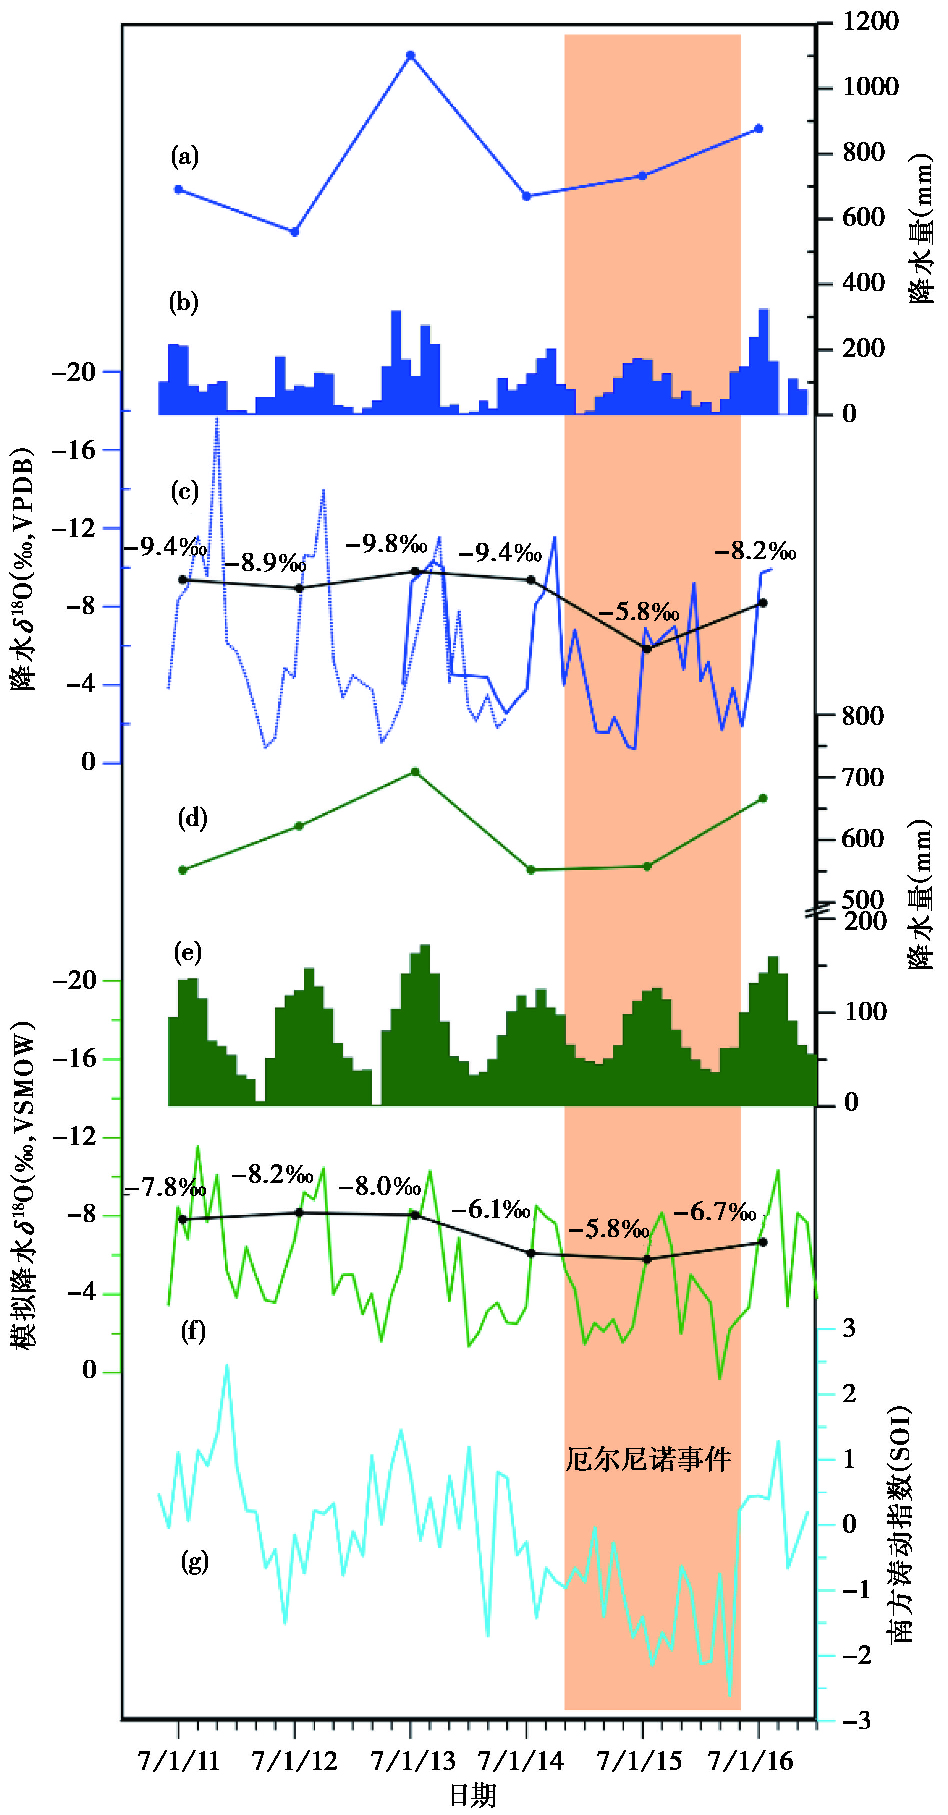
2 结果与讨论35个永兴洞洞外降水样品δ 18O测试结果已在文献[23]中报道,其变化范围为-11.5 ‰ ~-0.7 ‰,其中夏季降水δ 18O偏负,冬季偏正(图 2c,蓝色实线)。将永兴洞降水δ 18O与附近和尚洞降水δ 18O[27]相结合,可以得到覆盖2011年5月至2016年7月的大气降水δ 18O序列(图 2c)。两地点δ 18O值在重合时段(2013年6月至2014年4月)相似(图 2c),证明了数据的可靠性。

|
图 2 2011~2016年永兴洞附近降水量、大气降水δ 18O与南方涛动指数(SOI)对比 (a)宜昌气象站点5~9月总降水量;(b)月降水量;(c)蓝色点线为和尚洞降水δ 18O数据[27],蓝色实线为永兴洞降水δ 18O数据;(d)Yoshimura等[28]模拟5~9月总降水量;(e)模拟月降水量,(f)模拟降水δ 18O值;(g)南方涛动指数(SOI)叠加在曲线(c)和(f)中的数字和黑色线条为5~9月降水δ 18O雨量加权平均值;橘黄色阴影棒表示主要发生在2015年期间的厄尔尼诺事件;SOI数据来源:http://www.bom.gov.au/climate/current/soihtm1.shtml Fig. 2 Comparison of precipitation amount, precipitation δ 18O near Yongxing Cave and Southern Oscillation Index(SOI)from 2011 to 2016. The total precipitation amount of May to September in Yichang is shown in (a) and monthly precipitation amount is shown in (b). Precipitation δ 18O values in Heshang Cave[27](the blue dotted line)and Yongxing Cave(the blue line)are shown in (c). The simulation total precipitation amount[28] of May to September is shown in (d), simulation monthly precipitation amount is shown in (e) and simulation precipitation δ 18O values are shown in (f). SOI is shown in (g). The mean δ 18O values weighted by precipitation amount from May to September are also shown(c and f, black lines and numbers). The interval of El Niño in 2015 is indicated by the orange bar. The data of the SOI are obtained from http://www.bom.gov.au/climate/current/soihtm1.shtml |
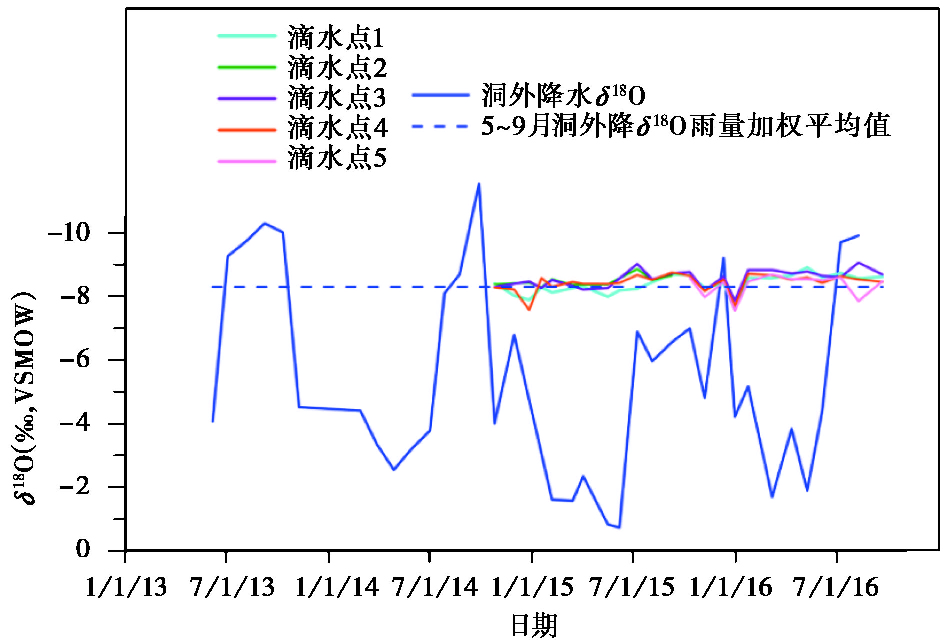
图 2将实地观测数据与Yoshimura等[28]的模拟降水δ 18O数据(模拟地点的经纬度坐标为29°31′N,108°45′E)进行了对比(图 2c和2f),结果表明虽然两组数据在绝对值上存在差异,即夏季降水δ 18O实际观测值比模拟值更偏负,但δ 18O的季节旋回在两组数据中均有显著表现。从年际变化上来看,2011~2015年夏季降水δ 18O值呈现出逐渐偏正的趋势,并在2015年的夏季达到最大值(图 2c和2f)。这与SOI在2011年至2015年逐渐变小的趋势相一致,并且夏季降水δ 18O值在2015年达到最大与此时的超级厄尔尼诺事件(图 2g)相对应。对于永兴洞而言,约70 %的年降水量由5~9月贡献(http://data.cma.cn),之前的研究[23]显示其洞内滴水δ 18O平均值(-8.4 ‰)非常接近5~9月洞外降水δ 18O的雨量加权平均值(-8.3 ‰)(图 3),表明永兴洞洞内滴水主要继承5~9月洞外降水δ 18O信号。因此,本文主要讨论5~9月永兴洞洞外大气降水δ 18O值的年际变化。各年份5~9月份降水δ 18O的雨量加权值在图 2中标出,结果显示实地观测与模型模拟的两组数据均在2015年表现最为偏正,与2015年超级厄尔尼诺事件相对应。赵景耀等[18]和Sun等[19]报道了河南栾川鸡冠洞观测结果,其降水δ 18O数据分别记录到了2010年和2015年厄尔尼诺事件。Chen和Li[20]报道了重庆羊口洞观测结果,2015年厄尔尼诺事件也在其降水δ 18O数据中表现显著。这些洞穴观测工作为永兴洞洞外降水δ 18O响应2015年厄尔尼诺事件提供了支持。

|
图 3 永兴洞洞内滴水δ 18O与洞外降水δ 18O对比 滴水δ 18O主要继承5~9月洞外降水δ 18O信号;数据来源于文献[23] Fig. 3 Comparison between drip water δ 18O and precipitation δ 18O in Yongxing Cave. Drip water δ 18O mainly inherits precipitation δ 18O signals of May to September. The data of δ 18O comes from reference [23] |
“Dansgaard雨量效应”[29]被广泛应用于解释热带地区大气降水δ 18O的月尺度变化以及气候意义[30]。将永兴洞、和尚洞降水δ 18O与附近气象站点月降水量数据进行相关分析,相关系数为-0.35(n=57,p < 0.01),Yoshimura等[28]模拟数据显示二者相关系数为-0.48(n=61,p < 0.01),表明在月尺度上降水δ 18O与降水量确实存在一定相关性。但这种相关性很可能只是统计意义上的,降水量的变化并非是导致降水δ 18O呈现季节变化的根本原因,即存在所谓的“伪雨量效应”[31]。导致中国季风区降水δ 18O呈现季节变化的根本原因可能有二:1)不同季节水汽来源的不同导致了降水δ 18O的季节性变化[27];2)最近的模拟研究表明不同季节水汽源区的对流强度也可导致中国季风区的降水δ 18O显示出显著的季节变化[32]。在年际尺度上,5~9月总降水量与雨量加权平均δ 18O之间变化趋势存在较大差异(图 2a和2c),它们之间的相关系数仅为-0.18(n=6,p>0.05),Yoshimura等[28]的模拟数据相关系数为-0.47(n=6,p>0.05),均未通过95 %置信度检验。本研究监测持续时间较短,不足以充分考察年际尺度上降水δ 18O与降水量之间的关系。但Tan[10]对中国主要气象站点的年降水量与δ 18O进行系统分析后,发现二者并无显著相关性。
从2013~2015年5~9月850mb风场环流图可以看出2014年和2015年研究区域风场与2013年显著不同(图 4a、4c和4e)。2013年研究区域主要受控于西南季风,而2014年和2015年受西南季风影响较小。这可能与逐渐增强的厄尔尼诺态有关,因为在厄尔尼诺年,西太平洋副热带高压将向西向南延伸,从而抑制西南季风对研究区域的降水贡献。为了证实这一推测,本文利用NCEP/NCAR资料和HYSPLIT后向轨迹模拟分析了2013~2015年5~9月降水水汽来源(图 4b、4d和4f)。结果显示2013年夏季67 %的水汽来源于印度洋和南海周边海域,而在2014年和2015年的5~9月,分别只有14 %和15 %的水汽来源于这些区域。这一结果表明在厄尔尼诺逐渐增强年份,西南季风携带的远源水汽逐渐减少是造成降水δ 18O逐渐偏正的重要原因。然而,目前尚无法建立降水δ 18O与水汽来源比例之间的定量关系,因为HYSPLIT后向轨迹模型所分析的水汽路径并未进行雨量加权,因而无法将水汽来源比例简单的等同于其产生的降水量比例。

|
图 4 2013~2015年5~9月850mb风场图(左)和水汽后向轨迹聚类分析(右) 左图中永兴洞位置用黑色五角星表示;右图中括号内的数字表示不同水汽来源的比例;为了与永兴洞降水2013年δ 18O对应,(a)显示的是6~9月风场图,(b)显示的是6~9月水汽后向轨迹聚类分析结果 Fig. 4 850mb wind field (left) and Cluster analysis (right) of backward trajectory of May to September from 2013 to 2016. The location of Yongxing Cave is indicated by the black stars in left figure, and contributions of different moisture sources are also shown in right figure. Considering precipitation δ 18O in Yongxing Cave, 850mb wind field and Cluster analysis of backward trajectory of June to September is shown for 2013 |
由于永兴洞岩溶“库效应”的存在,洞外降水δ 18O的季节和年际变化信号被严重平滑,这些变化在洞内滴水δ 18O中没有显示(图 3)。但洞内滴水δ 18O平均值与5~9月洞外降水的多年雨量加权平均值十分接近,因此在更长时间尺度上ENSO的变化信号可以通过洞外降水传递到洞穴滴水中。之前的研究[23]表明永兴洞洞内新生方解石可能存在不平衡分馏,但从石笋记录YX92和和尚洞记录HS4之间良好的重现性来看(图 1),这一不平衡分馏效应的影响在年代际或更长时间尺度上基本可以忽略,即洞穴滴水δ 18O信号在这些时间尺度上可以传递到石笋中。
3 结论通过对湖北永兴洞洞外降水δ 18O为期3年的观测,发现该地点夏季降水δ 18O在2015年显著偏正,并得到了模拟研究结果的支持。与南方涛动指数对比发现,2015年永兴洞洞外降水δ 18O偏正与厄尔尼诺事件相对应。进一步利用HYSPLIT模型方法对水汽来源路径进行分析,发现2015年夏季来自远源印度洋的水汽显著减少。因此永兴洞洞外降水δ 18O在2015年夏季异常偏正主要是由厄尔尼诺事件引起的大气环流变化导致。根据Tan[10]的总结,在厄尔尼诺发生年份,印度洋海盆和中东太平洋海水温度偏高,西太平洋副热带高压偏南西伸而增强,中国大陆季风区主要为亚热带梅雨锋所控制,西南季风带来的印度洋远源水汽份额减少,而来自西太平洋的水汽份额增大,由于后者输送路程较近,根据“瑞利分馏”原理,降水δ 18O偏正。已有研究表明永兴洞洞内滴水主要继承洞外夏季降水δ 18O信号,并且该洞穴石笋δ 18O与附近洞穴记录具有良好的重现性,据此可进一步推论较长时间尺度(年代际或以上)的ENSO信号可以传递到石笋δ 18O记录中。本研究提供的观测证据表明永兴洞石笋δ 18O记录在重建ENSO主导下的亚洲季风大气环流方面具有重要潜力。
致谢: 感谢匿名审稿专家和编辑部杨美芳老师提出的宝贵修改意见
| [1] |
Wang B, Li J, He Q. Variable and robust East Asian monsoon rainfall response to El Niño over the past 60 years(1957-2016)[J]. Advances in Atmosphere Sciences, 2017, 34(10): 1235-1248. DOI:10.1007/s00376-017-7016-3 |
| [2] |
Hong Y T, Hong B, Lin Q H, et al. Inverse phase oscillations between the East Asian and Indian Ocean summer monsoons during the last 12000 years and paleo-El Niño[J]. Earth and Planetary Science Letters, 2005, 231(3-4): 337-346. DOI:10.1016/j.epsl.2004.12.025 |
| [3] |
Jiang T, Zhang Q, Zhu D, et al. Yangtze floods and droughts(China)and teleconnections with ENSO activities(1470-2003)[J]. Quaternary International, 2006, 144(1): 29-37. DOI:10.1016/j.quaint.2005.05.010 |
| [4] |
Zhang Y G, Ji J, Balsam W L, et al. High resolution hematite and goethite records from ODP 1143, South China Sea:Co-evolution of monsoonal precipitation and El Niño over the past 600, 000 years[J]. Earth and Planetary Science Letters, 2007, 264(1-2): 136-150. DOI:10.1016/j.epsl.2007.09.022 |
| [5] |
李瀚瑛, Sinha Ashish, 程海, 等. 西南印度洋罗德里格斯岛石笋记录的新仙女木事件[J]. 第四纪研究, 2019, 39(4): 1006-1017. Li Hanying, Sinha Ashish, Cheng Hai, et al. The Younger Dryas Event recorded in a speleothem from Rodrigues, Southwestern Indian Ocean[J]. Quaternary Sciences, 2019, 39(4): 1006-1017. |
| [6] |
黄冉, 陈朝军, 李廷勇, 等. 基于石笋记录的晚全新世太平洋东西两岸季风区气候事件对比研究[J]. 第四纪研究, 2019, 39(3): 742-754. Huang Ran, Chen Chaojun, Li Tingyong, et al. Comparison of climatic events in the Late Holocene, based on stalagmite records from monsoon regions near by the East and West Pacific[J]. Quaternary Sciences, 2019, 39(3): 742-754. |
| [7] |
Li Q, Nakatsuka T, Kawamura K, et al. Hydroclimate variability in the North China Plain and its link with El Niño -Southern Oscillation since 1784 A.D.:Insights from tree-ring cellulose δ18O[J]. Journal of Geophysical Research, 2011, 116(D22): D22106. |
| [8] |
Hillman A L, Abbott M B, Finkenbinder M S, et al. An 8, 600 year lacustrine record of summer monsoon variability from Yunnan, China[J]. Quaternary Science Reviews, 2017, 174: 120-132. DOI:10.1016/j.quascirev.2017.09.005 |
| [9] |
Cui A, Ma C, Zhao L, et al. Pollen records of the Little Ice Age humidity flip in the middle Yangtze River catchment[J]. Quaternary Science Reviews, 2018, 193: 43-53. DOI:10.1016/j.quascirev.2018.06.015 |
| [10] |
Tan M. Circulation effect:Response of precipitation δ18O to the ENSO cycle in monsoon regions of China[J]. Climate Dynamics, 2014, 42(3-4): 1067-1077. DOI:10.1007/s00382-013-1732-x |
| [11] |
赵侃, 陈仕涛, 崔英方, 等. 神农架石笋记录的近200年东亚季风变化及其ENSO响应[J]. 地理研究, 2015, 34(1): 74-84. Zhao Kan, Chen Shitao, Cui Yingfang, et al. East Asian monsoon changes and its ENSO response revealed by a 200-year stalagmite record from Yongxing Cave on the Mountain Shengnonjia[J]. Geographical Research, 2015, 34(1): 74-84. |
| [12] |
Chen J, Chen F, Feng S, et al. Hydroclimatic changes in China and surroundings during the Medieval Climate Anomaly and Little Ice Age:Spatial patterns and possible mechanisms[J]. Quaternary Science Reviews, 2015, 107: 98-111. DOI:10.1016/j.quascirev.2014.10.012 |
| [13] |
Liu S, Peng X, Chen Q, et al. The 1997-1998 El Niño event recorded by a stalagmite from Central China[J]. Quaternary International, 2018, 487: 71-77. DOI:10.1016/j.quaint.2017.11.026 |
| [14] |
谭明. 近千年气候格局的环流背景:ENSO态的不确定性分析与再重建[J]. 中国科学:地球科学, 2016, 59(5): 657-673. Tan Ming. Circulation background of climate patterns in the past millennium:Uncertainty analysis and re-reconstruction of ENSO-like state[J]. Science China:Earth Sciences, 2016, 59(6): 1225-1241. |
| [15] |
谭明. 信风驱动的中国季风区石笋δ18O与大尺度温度场负耦合——从年代际变率到岁差周期的环流效应(纪念GNIP建网50周年暨葫芦洞石笋末次冰期记录发表 10周年)[J]. 第四纪研究, 2011, 31(6): 1086-1097. Tan Ming. Trade-wind driven inverse coupling between stalagmite δ18O from monsoon region of China and large scale temperature-Circulation effect on decadal to precessional timescales[J]. Quaternary Sciences, 2011, 31(6): 1086-1097. DOI:10.3969/j.issn.1001-7410.2011.06.16 |
| [16] |
谭明. 环流效应:中国季风区石笋氧同位素短尺度变化的气候意义——古气候记录与现代气候研究的一次对话[J]. 第四纪研究, 2009, 29(5): 851-862. Tan Ming. Circulation effect:Climatic significance of the short term variability of the oxygen isotopes in stalagmites from monsoonal China-Dialogue between paleoclimate records and modern climate research[J]. Quaternary Sciences, 2009, 29(5): 851-862. DOI:10.3969/j.issn.1001-7410.2009.05.01 |
| [17] |
谭明. 中国季风区降水氧同位素年际变化的"环流效应"初探[J]. 第四纪研究, 2010, 30(3): 620-622. Tan Ming. Primary investigation on international changes in the circulation effect of precipitation oxygen isotopes in monsoon China[J]. Quaternary Sciences, 2010, 30(3): 620-622. DOI:10.3969/j.issn.1001-7410.2010.03.21 |
| [18] |
赵景耀, 杨琰, 彭涛, 等. 河南鸡冠洞降水、滴水和现生碳酸钙的δ18O变化特征及其环流意义[J]. 第四纪研究, 2014, 34(5): 1106-1116. Zhao Jingyao, Yang Yan, Peng Tao, et al. Variation of δ18O values in the precipitation, cave drip water and modern calcite deposition in Jiguan Cave, Henan Province and its atmospheric circulation effect[J]. Quaternary Sciences, 2014, 34(5): 1106-1116. |
| [19] |
Sun Z, Yang Y, Zhao J, et al. Potential ENSO effects on the oxygen isotope composition of modern speleothems:Observations from Jiguan Cave, Central China[J]. Journal of Hydrology, 2018, 566: 164-174. DOI:10.1016/j.jhydrol.2018.09.015 |
| [20] |
Chen C J, Li T Y. Geochemical characteristics of cave drip water respond to ENSO based on a 6-year monitoring work in Yangkou Cave, Southwest China[J]. Journal of Hydrology, 2018, 561: 896-907. DOI:10.1016/j.jhydrol.2018.04.061 |
| [21] |
Ishizaki Y, Yoshimura K, Kanae S, et al. Interannual variability of H218O in precipitation over the Asian monsoon region[J]. Journal of Geophysical Research:Atmospheres, 2012, 117(D16): D16308. |
| [22] |
Yang H, Johnson K, Griffiths M, et al. Interannual controls on oxygen isotope variability in Asian monsoon precipitation and implications for paleoclimate reconstructions[J]. Journal of Geophysical Research:Atmospheres, 2016, 121(14): 8410-8428. DOI:10.1002/2015JD024683 |
| [23] |
Wang Q, Wang Y, Zhao K, et al. The transfer of oxygen isotopic signals from precipitation to drip water and modern calcite on the seasonal time scale in Yongxing Cave, Central China[J]. Environmental Earth Sciences, 2018, 77: 474. DOI:10.1007/s12665-018-7607-z |
| [24] |
Hu C, Henderson G M, Huang J, et al. Quantification of Holocene Asian monsoon rainfall from spatially separated cave records[J]. Earth and Planetary Science Letters, 2008, 266(3-4): 221-232. DOI:10.1016/j.epsl.2007.10.015 |
| [25] |
Chen S, Wang Y, Cheng H, et al. Strong coupling of Asian monsoon and Antarctic climates on sub-orbital timescales[J]. Scientific Reports, 2016, 6: 32995. DOI:10.1038/srep32995 |
| [26] |
Liang Y, Chen S, Zhang Z, et al. Abrupt monsoonal shifts over the precessional cycles documented in Yongxing Cave in China during the antepenultimate glacial period[J]. Environmental Earth Sciences, 2018, 77: 228. DOI:10.1007/s12665-018-7410-x |
| [27] |
Duan W, Ruan J, Luo W, et al. The transfer of seasonal isotopic variability between precipitation and drip water at eight caves in the monsoon regions of China[J]. Geochimica et Cosmochimica Acta, 2016, 183: 250-266. DOI:10.1016/j.gca.2016.03.037 |
| [28] |
Yoshimura K, Kanamitsu M, Noone D, et al. Historical isotope simulation using reanalysis atmospheric data[J]. Journal of Geophysical Research, 2008, 113(D19): D19108. |
| [29] |
Dansgaard W. Stable isotopes in precipitation[J]. Tellus Series B:Chemical and Physical Meteorology, 1964, 16(4): 436-468. |
| [30] |
张键, 李廷勇. "雨量效应"与"环流效应":近1 ka亚澳季风区石笋和大气降水δ18O的气候意义[J]. 第四纪研究, 2018, 38(6): 1532-1544. Zhang Jian, Li Tingyong. "Amount effect" vs."Circulation effect":The climate significance of precipitation and stalagmite δ18O in the Asian-Australian monsoon region over the past 1 ka[J]. Quaternary Sciences, 2018, 38(6): 1532-1544. |
| [31] |
李廷勇. 伪雨量效应——一个同位素气候学问题的讨论[J]. 第四纪研究, 2018, 38(6): 1545-1548. Li Tingyong. False amount effect-A discussion on one issue of isotopic climatology[J]. Quaternary Sciences, 2018, 38(6): 1545-1548. |
| [32] |
Cai Z, Tian L, Bowen G. Spatial-seasonal patterns reveal large-scale atmospheric controls on Asian monsoon precipitation water isotope ratios[J]. Earth and Planetary Science Letters, 2018, 503: 158-169. DOI:10.1016/j.epsl.2018.09.028 |
2 State Key Laboratory of Loess and Quaternary Geology, Institute of Earth Environment, Chinese Academy of Sciences, Xi'an 710061, Shaanxi;
3 School of Geography, Nanjing Normal University, Nanjing 210023, Jiangsu;
4 Key Laboratory of Virtual Geographic Environment(Nanjing Normal University), Ministry of Education, Nanjing 210023, Jiangsu;
5 Jiangsu Center for Collaborative Innovation in Geographical Information Resource Development and Application, Nanjing 210023, Jiangsu;
6 Nanjing Institute of Tourism&Hospitality, Nanjing 211100, Jiangsu)
Abstract
Yongxing Cave (31°35'N, 111°14'E; 800 m above sea level) is located in Hubei Province, Central China. The area is strongly influenced by the subtropical monsoon climate, and current meteorological conditions are dominated by distinct seasonal changes of temperature and precipitation. According to recent research, the stalagmite δ18O record in Yongxing Cave shows significant ENSO signals. To verify the relationship between the stalagmite δ18O record in Yongxing Cave and ENSO, precipitation δ18O in Yongxing Cave was monitored monthly from June 2013 to July 2016, and it is found that the precipitation δ18O was more positive from May to September 2015. The HYSPLIT backward trajectory method was used to analyze the water vapor source of precipitation in Yongxing Cave. The results showed that under the influence of El Niño event, the water vapor from the Indian Ocean decreased significantly from May to September 2015, while the water vapor from the West Pacific Ocean, which is near Monsoonal China, increased relatively. Therefore, interannual variability of precipitation δ18O in Yongxing Cave is mainly controlled by Chinese monsoon "circulation effect", which reflects the Indian/Pacific Ocean circulation. Evidence provided here indicates that the stalagmite δ18O records in Yongxing Cave have the potential to provide information on atmospheric circulation linked with ENSO in the Asian monsoon region. 2020, Vol.40

