2 江苏省大规模复杂系统数值模拟重点实验室, 南京师范大学数学科学学院, 江苏 南京 210023;
3 青岛海洋科学与技术国家实验室海洋-气候-同位素模拟开放工作室, 山东 青岛 266237;
4 中国科学院地 球环境研究所, 黄土与第四纪地质国家重点实验室, 陕西 西安 710061)
季风环流是全球大尺度大气环流系统的重要组成部分,同时也是全球大气运动能量、水汽的主要供应地[1]。全球约有70 %的人口生活在季风区,季风区水资源的变化与人类的生存发展密切联系,特别是北半球夏季风降水。因此,深入认识北半球季风的变化规律并理解其成因机制,对于提高北半球季风的预报能力具有重要科学意义[2]。
全新世是末次间冰期以来最温暖和湿润的时期。但是大量研究表明,全新世气候并不是人们想像的那么稳定,而是存在不稳定性[3]。Bond等[4]利用浮冰碎屑(Ice-Rafted Detritus,简称IRD)研究了北大西洋的流冰事件,发现全新世北大西洋存在8次气候突变事件,其中发生在8.2 ka B. P.和4.2 ka B. P.前后的降温是全新世最显著的两次气候突变事件,简称“8.2 ka B. P.事件”[5~8]和“4.2 ka B. P.事件”[9~10]。8.2 ka B. P.事件的主要特征是高纬度明显寒冷,而4.2 ka B. P.事件主要表现为低纬度普遍干旱[11]。这两次突变事件在印度季风区[12~13]、东亚季风区[14]和北非季风区[15]都存在季风减弱的现象。但是两次突变事件的成因机制存在差异,目前大量重建和模拟研究表明,8.2 ka B. P.事件的成因机制主要是由于大量淡水注入北大西洋导致大西洋经向翻转环流(Atlantic Meridional Overturning Circulation,简称AMOC)减弱,使得赤道辐合带(Intertropical Convergence Zone,简称ITCZ)南移,造成包括北半球高纬地区寒冷、低纬地区干旱[16~19],而4.2 ka B. P.事件的成因存在争议。Booth等[20]认为4.2 ka B. P.事件主要由地球轨道参数、太阳辐射变化和火山爆发等外强迫因子所引起,也有学者认为4.2 ka B. P.事件是由气候系统内部变率和外强迫共同作用所引起[21~22]。
气候模拟是研究历史时期气候变化特征及其成因机制的有利工具,针对全新世以来的气候变化作了大量的模拟研究[23~30]。目前关于全新世突变事件下北半球季风降水(Northern Hemisphere Monsoon Precipitation,简称NHMP)变化的研究,大多是基于重建资料对北半球子季风区(印度季风[12~13]、东亚季风[31~33]和北美季风[34])降水变化的研究,很少从北半球整体的角度来分析其季风降水的时空特征。那在8.2 ka B. P.和4.2 ka B. P.这两次典型突变事件下,北半球季风降水的变化特征有什么异同?原因何在?为了回答此问题,急需借助气候模式进行数值模拟试验来分析研究。本文采用威斯康星-麦迪逊大学和美国国家大气研究中心(National Center for Atmospheric Research,简称NCAR)联合完成的过去21000年气候瞬变模拟试验结果[35~37]来对全新世两次典型气候突变事件(8.2 ka B. P.和4.2 ka B. P.)下北半球季风降水的变化特征及其成因进行对比研究。
1 数据与方法 1.1 数据 1.1.1 模拟数据过去21000年的气候瞬变模拟试验(Simulations of Transient Climate Evolution over the last 21000 years,简称TraCE-21ka)是全球首次使用全耦合气候系统模式(Community Climate System Model 3,简称CCSM3)对末次冰盛期以来的气候变化进行的瞬变气候模拟[35~37]。TraCE-21ka使用的是美国国家大气研究中心(National Center for Atmospheric Research,简称NCAR)开发的气候系统模式(CCSM3)[38~39],该模式的大气模块(Community Atmospheric Model 3,简称CAM3)的水平分辨率为T31(约为3.75°×3.75°),海洋模块(Parallel Ocean Program,简称POP)[40]的纬向分辨率为3.6°,经向分辨率可变,在赤道附近约为0.9°,越向极地分辨率越粗。
本研究采用TraCE-21ka的5个模拟试验的输出结果进行分析。这5个试验分别是全强迫试验(TraCE-All Forcing experiment,简称TraCE-AF)、温室气体敏感性试验(TraCE-Greenhouse Gases experiment,简称TraCE-GHG)、地球轨道参数敏感性试验(TraCE-Orbital Forcing experiment,简称TraCE-ORB)、大陆冰盖敏感性试验(TraCE-Ice Sheets and Paleogeography experiment,简称TraCE-ICE)以及淡水注入敏感性试验(TraCE-Meltwater Forcing experiment,简称TraCE-MWF)(表 1);其中TraCE-AF的外强迫条件包括地球轨道参数[41]、温室气体浓度[42]、大陆冰盖[43]和淡水注入[35]等4个单因子。
| 表 1 本研究所采用的5个TraCE-21ka气候模拟试验 Table 1 Five TraCE-21ka climatic modeling experiments used in this study |
本文采用两套全球降水数据对TraCE-21ka的模拟结果进行评估。一套是美国气候预测中心降水集合分析资料(Climate Prediction Center Merged Analysis of Precipitation,简称CMAP)[44];另一套是全球降水气候项目的降水资料(Global Precipitation Climatology Project,简称GPCP)[45](表 2)。为减少这两套降水资料的不确定性,本文采用这两套资料的算术平均(后文简称CMAP-GPCP集成降水数据)来对模拟结果进行评估[46]。
| 表 2 用于验证的观测/再分析资料 Table 2 Observed/reanalyzed datasets used in comparison |
本文对全新世以来两次典型气候突变事件(8.2 ka B. P.和4.2 ka B. P.)进行对比分析,为了很好地得到这两次典型突变事件发生前后的变化特征,本文参照Ning等[21]的做法,选取9200~8800 a B. P.为8.2 ka B. P.事件发生前的时段,8800~8000 a B. P.为8.2 ka B. P.事件发生后的时段;同样地,选取4800~4500 a B. P.为4.2 ka B. P.事件发生前的时段,4500~4000 a B. P.为4.2 ka B. P.事件发生后的时段(图 1),并且将两次典型突变事件发生后的时段减去发生前的时段来表征突变事件前后的气候变化特征。

|
图 1 TraCE-AF模拟的北半球夏季(6~8月)地表气温标准化距平时间序列 黑线为101年滑动平均;斜线区表示突变前的时段,打点区表示突变后的时段(a)8.2 ka B. P.距平(相对于9200~7800 a B. P.);(b)4.2 ka B. P.距平(相对于5000~3600 a B. P.) Fig. 1 Time series of normalized anomalies of summer(JJA)mean surface temperature in the Northern Hemisphere derived from TraCE-AF outputs. The black line represents 101-year running mean, the hatched represents the episode before abrupt climate event, and the stippled represents the episode after abrupt climate event. (a)8.2 ka B. P. anomalies(relative to 9200~8000 a B. P.), (b)4.2 ka B. P. anomalies(relative to 5000~3600 a B. P.) |
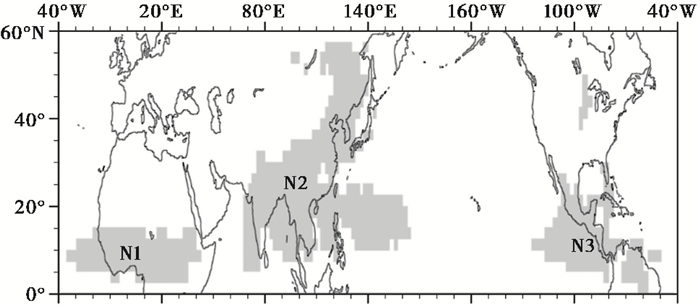
本文采用Wang和Ding[47]对季风区范围的定义方法,即降水年较差(Annual Range,简称AR)超过2.0 mm/天,并且当地夏季降水占全年降水的55 %以上的区域,其中AR指的是夏半年(5~9月)与冬半年(11月~次年3月)的降水之差。图 2中的灰色阴影区即为利用CMAP-GPCP集成降水数据根据上述条件定义的北半球季风区,其中包括了3个子季风区,它们分别是北非子季风区(N1)、亚洲子季风区(N2)和北美子季风区(N3)。本文选取季风区的夏季(6~8月,简称JJA)平均降水率来衡量季风降水的强度[48]。

|
图 2 北半球季风区及北非子季风区(N1)、亚洲子季风区(N2)和北美子季风区(N3)的范围(阴影所示) Fig. 2 Northern Hemisphere monsoon domain, the North African sub-monsoon domain(N1), the Asian sub-monsoon domain(N2), and the North American sub-monsoon domain (N3)(shown in the shaded area) |
如上所述,采用CMAP-GPCP集成降水数据来验证TraCE-AF模拟结果的合理性。由于模拟数据与观测数据分辨率不同,对比之前将CMAP-GPCP集成降水数据插值到TraCE-AF模拟资料的格点上。图 3给出了模拟与观测的年平均降水率、降水年较差和北半球季风区范围。由图 3a和3b可以看出,模拟与观测的年平均降水率空间分布比较类似,二者的空间相关系数为0.92,说明TraCE-AF较好地再现了北半球年平均降水的主要分布特征,两者都显示降水的大值中心分别位于ITCZ、西北大西洋和西北太平洋上;两者的主要差异反映在热带西太平洋地区,该区模拟的降水明显高于观测资料。此外,TraCE-AF较好地模拟出了降水年较差的空间分布特征(图 3c和3d),二者的空间相关系数达到0.77。图 3c和3d还显示,TraCE-AF模拟的北半球季风区的范围与观测较为相似,北美子季风区、北非子季风区和亚洲子季风区均有较好体现,但亚洲子季风区和北美子季风区范围均比观测到的有所减小,而北非子季风区范围比观测到的有所增大。总的来说,TraCE-AF对于北半球年平均降水、降水年较差和季风区范围的模拟是比较合理的。

|
图 3 1979~1990年TraCE-AF模拟(a,c)和观测/再分析资料(b,d;为CMAP-GPCP集成降水数据)夏季降水气候态的对比 (a,b)年平均降水率(mm/天);(c,d)降水年较差(mm/天)和北半球季风区范围(红线中的区域) Fig. 3 Comparison of summer mean precipitation climatology(1979~1990 A.D.)between TraCE-AF simulation(a, c)and observation(Merged CMAP-GPCP; b, d). (a, b)Annual mean precipitation rate(mm/day); (c, d)Annual precipitation range(mm/day)and the Northern Hemisphere monsoon domain(red line) |
图 4为两次典型突变事件前后北半球夏季地表气温变化的空间分布。从图 4a中可以看出,8.2 ka B. P.事件发生后,北半球30°N以北的亚欧大陆、北美西部的地表气温明显下降,其中最大降温位于(50°N,140°E)的鄂霍茨克海以西地区,温度降低约1.34 ℃,而在中高纬的北美中部地区、低纬的萨赫勒地区、印度半岛和南美北部委内瑞拉的地表气温有所上升。而4.2 ka B. P.事件发生后(见如图 4b),中高纬度地区地表气温显著下降,最大负值区位于北大西洋,呈现出类似北大西洋多年代际振荡(Atlantic Multi-decadal Oscillation,简称AMO)负位相变化的空间分布型,但在低纬的萨赫勒地区、印度半岛和墨西哥北部地区的地表温度有所增加。对比图 4a和4b可以发现,8.2 ka B. P.事件下北美中部有明显的增温,而在4.2 ka B. P.事件下该地区的地表气温下降;此外,在欧亚大陆中高纬度地区,8.2 ka B. P.事件下的降温幅度明显大于4.2 ka B. P.事件,而8.2 ka B. P.事件后北大西洋的降温幅度明显小于4.2 ka B. P.事件。

|
图 4 TraCE-AF模拟的8.2 ka B. P. (a)和4.2 ka B. P. (b)这两次典型突变事件前后(突变后的时段减去突变前的时段)北半球夏季地表气温(℃)变化的空间分布 Fig. 4 Spatial distribution of changes(episode after abrupt climate event minus episode before abrupt climate event)of summer mean surface temperature(℃)in the Northern Hemisphere for two typical abrupt climate events(8.2 ka B. P. (a)and 4.2 ka B. P. (b)) derived from TraCE-AF outputs |
图 5为两次典型突变事件前后北半球季风降水变化的空间分布。如图 5a所示,在8.2 ka B. P.事件下,在亚洲季风区西部,印度季风降水几乎一致减少,这与Dixit等[12]的重建结果类似;而在亚洲季风区的东北部,东亚季风降水以30°N为界,呈现出“南涝北旱”的空间分布型,这与Wang等[31]、Tan等[32]重建资料显示的中国东北部干旱、南部洪涝的结果一致;西北太平洋季风的降水明显增多。在北美季风区,降水基本上一致偏少,仅墨西哥中部地区的降水量有所增加。在北非季风区,西部的降水明显减少,而中东部的降水从西向东呈现“-+-+”的分布格局,表现出非均一变化特征。4.2 ka B. P.事件下,北半球季风降水变化的空间型与8.2 ka B. P.事件相似(图 5b),二者的空间相关系数为0.67,达到了95 %的置信度。但是8.2 ka B. P.事件降水的变化幅度明显大于4.2 ka B. P.事件,特别是在北美季风区的降水减少达到0.66 mm/天,比4.2 ka B. P.事件下的减少量(0.32 mm/天)增加了一倍

|
图 5 TraCE-AF模拟的8.2 ka B. P. (a)和4.2 ka B. P. (b)这两次典型突变事件前后(突变后的时段减去突变前的时段)北半球夏季降水(mm/天)变化的空间分布,红线为季风区 Fig. 5 Spatial distribution of changes(episode after abrupt climate event minus episode before abrupt climate event)of summer mean precipitation(mm/day)in the Northern Hemisphere after two typical abrupt climate events(8.2 ka B. P. (a)and 4.2 ka B. P. (b)) derived from TraCE-AF outputs. The red line represents monsoon domain |
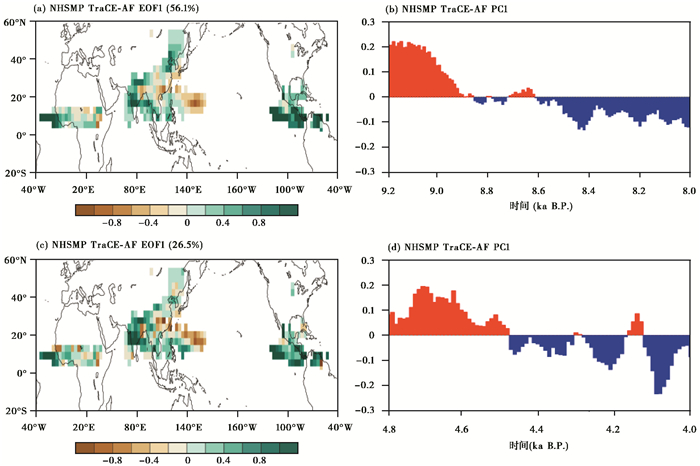
为了进一步探究全新世两次典型突变事件发生后的北半球季风降水的空间特征的变化,本文分别对(9200~8000 a B. P.和4800~4000 a B. P.)的北半球季风降水进行经验正交函数(Empirical Orthogonal Function,简称EOF)分解。图 6为北半球夏季风降水EOF的第一模态及其时间序列(First Principal Component,简称PC1)。图 6a为8.2 ka B. P.事件期间(9200~8000 a B. P.)北半球季风降水变化的主模态,方差贡献率为56.1 %,通过了North[49]检验。由图 6a和6b可见,PC1在9200~8800 a B. P.期间为正距平时,除了北美季风区降水分布呈现较为一致的正距平外,在北非季风区的西部降水为一致的正距平,而东部为正负距平相间的分布型,位于亚洲季风区西部的印度季风降水表现为正距平,东北部的东亚季风降水为南北反向变化的分布型,而东部的西北太平洋季风降水则为较密集的负距平区,然而PC1在8800~8000 a B. P.期间转为负距平时,北半球季风降水的空间型与9200~8800 a B. P.正好相反。图 6c为4.2 ka B. P.事件前后北半球夏季降水空间变化的主模态,第一模态方差贡献率为26.5 %,并且通过了North检验,可以看出降水的空间分布形态与8.2 ka B. P.事件相似,二者的空间相关系数为0.73,达到了95 %的置信度。然而,在4.2 ka B. P.事件下,亚洲子季风区和北非子季风区的空间变化的非均质性有所增大。

|
图 6 TraCE-AF模拟的9200~8000 a B. P.(a,b)和4800~4000 a B. P.(c,d)这两次典型突变事件前后北半球季风降水EOF分解的第一模态及其时间序列 Fig. 6 The leading EOF mode and the corresponding principal component of NHMP during two typical abrupt climate events(9200~ 8000 a B.P. (a,b) and 4800~4000 a B. P. (c,d))derived from TraCE-AF outputs |
为了分析两次典型突变事件前后北半球季风降水变化的原因,本文分析了北半球夏季海平面气压场和850 hPa风场(图 7),从图 7a可以看出,8.2 ka B. P.事件发生后,在南半球马斯克林群岛附近的海平面气压有异常偏低,同时存在异常的气旋式环流,说明此时马斯克林高压和索马里急流有所减弱,不利于水汽输送到印度半岛,从而使得印度季风降水偏少。在西北太平洋上存在一个异常气旋式环流,说明此时西太平洋副高减弱,使得东亚地区的偏南气流减弱,不利于水汽向北推进,有利于东亚南部降水偏多,因此造成了东亚季风区“南涝北旱”的降水分布型。同时,北大西洋副高也有所减弱,使得自墨西哥湾向北美东部的水汽输送减少,导致了北美季风降水一致偏少。在北非季风区西部由异常的偏东风主导,风由陆地吹向海洋,使得该区域降水偏少。对比图 7a和7b可知,4.2 ka B. P.事件前后大气环流场变化的分布型非常相似,但是环流强度的变化明显弱于8.2 ka B. P.事件。

|
图 7 TraCE-AF模拟的8.2 ka B. P. (a)和4.2 ka B. P. (b)这两次典型突变事件前后(突变后的时段减去突变前的时段)北半球夏季海平面气压场(填色,hPa)和850hPa风场(箭头,m/s)变化的空间分布 Fig. 7 Spatial distribution of changes(episode after abrupt climate event minus episode before abrupt climate event)of summer mean sea level pressure(shaded, hPa)and 850 hPa wind field(vector, m/s)in the Northern Hemisphere after two typical abrupt climate events(8.2 ka B. P. (a)and 4.2 ka B. P. (b))derived from TraCE-AF outputs |
为了研究两次突变事件下北半球季风降水变化的原因,本文进一步分析了各个单因子敏感性试验模拟的两次典型突变事件期间北半球季风降水的变化,如果TraCE-AF试验结果与某个单因子敏感性试验得到的结果接近,我们认为是由该单因子强迫所导致的变化;反之,TraCE-AF试验结果与各个单因子敏感性试验得到的结果均不同,我们认为是由气候系统内部变率所引起的变化。
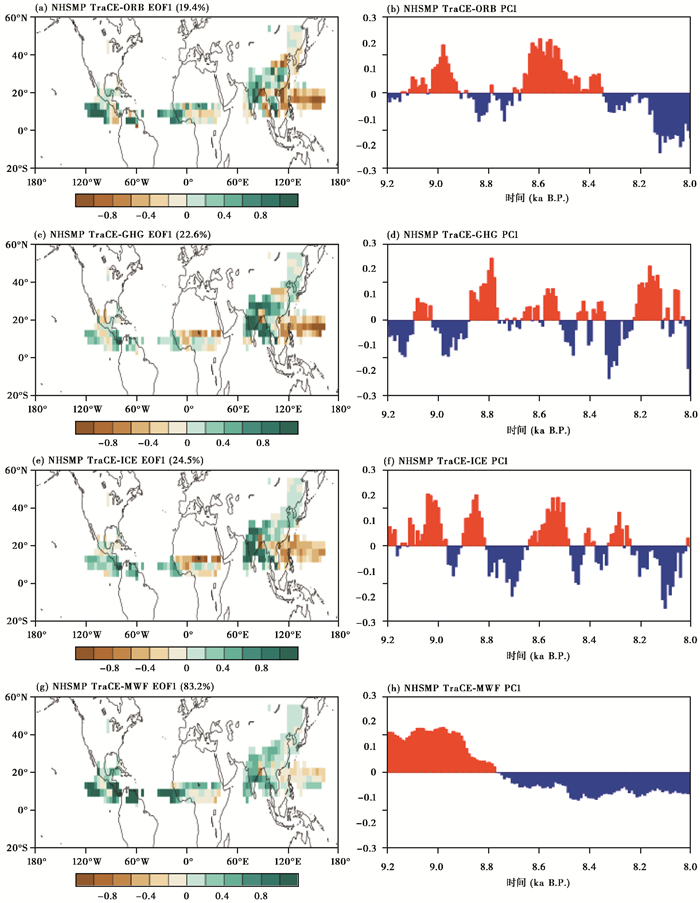
如上所述,本文对两个突变事件期间(9200~8000 a B. P.与4800~4000 a B. P.)4个单因子试验模拟的北半球季风降水分别进行EOF分解,并将结果与TraCE-AF对比分析。图 8为8.2 ka B. P.事件期间(9200~8000 a B. P.),各个单因子敏感性试验模拟的北半球季风降水的EOF第一模态(EOF1)及其时间序列(PC1)。从时间序列上看,在地球轨道参数强迫、温室气体强迫和大陆冰盖强迫作用下,北半球季风降水呈现较弱的减少趋势,而在淡水注入强迫作用下,北半球季风降水呈现明显的减弱趋势(图 8h),与TraCE-AF试验中的北半球季风降水减小趋势一致(图 6b),进一步计算了TraCE-ORB、TraCE-GHG、TraCE-ICE和TraCE-MWF这4个试验的PC1与TraCE-AF试验的PC1的相关系数,分别为0.30、0.33、0.13和0.87,这说明8.2 ka B. P.事件与淡水注入密切相关。从空间分布型(EOF1)来看,TraCE-AF的季风降水EOF1与TraCE-MWF试验下的EOF1分布最为接近,TraCE-AF的季风降水EOF1与TraCE-MWF、TraCE-ICE、TraCE-GHG及TraCE-ORB的季风降水EOF1的空间相关系数依次为0.74、0.50、0.44和0.46,这也说明在8.2 ka B. P.事件与淡水注入密切相关,是由于淡水注入北大西洋之后,引起AMOC的减弱,从而导致北半球季风减弱[5~6]。

|
图 8 8.2 ka B. P.事件(9200~8000 a B. P.)TraCE单因子试验模拟的北半球季风降水EOF分解的第一模态及其时间序列 (a,b)TraCE-ORB;(c,d)TraCE-GHG;(e,f)TraCE-ICE;(g,h)TraCE-MWF Fig. 8 The leading EOF mode and the corresponding principal component of NHMP during 8. 2 ka B. P. event(9200~8000 a B. P.) from TraCE single forcing experiment |
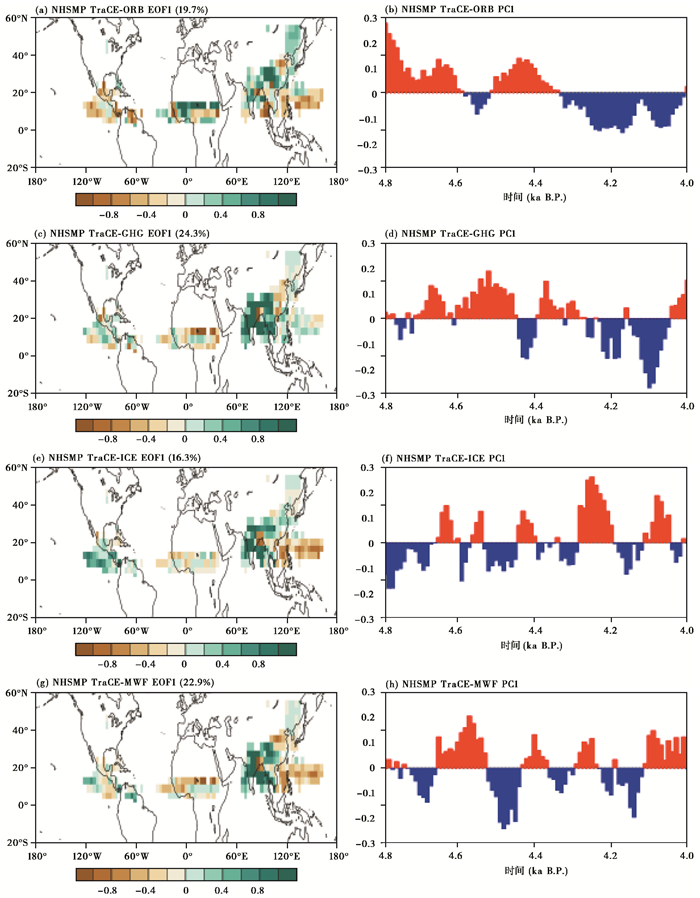
同样地,图 9为4.2 ka B. P.事件期间(4800~4000 a B. P.),4个单因子敏感性试验模拟的北半球季风降水的EOF1及其PC1。从图 9的时间序列上看,在地球轨道参数强迫下,北半球季风降水呈现下降的趋势(图 9b),并且计算了其与TraCE-AF试验的PC1相关系数为0.55,说明4.2 ka BP事件与地球轨道参数有关。而温室气体强迫、大陆冰盖和淡水注入强迫下降水没有明显的趋势(图 9d、9f和9h),进一步计算与TraCE-GHG、TraCE-ICE和TraCE-MWF这4个试验的PC1相关系数,分别为0.46、-0.42和-0.13,而在此期间,温室气体浓度与大陆冰盖几乎没有太大变化,说明4.2 ka B. P.事件不仅与地球轨道参数紧密联系,还与气候系统内部变率有关,这主要是通过大气低层的类北大西洋涛动(North Atlantic Oscillation,简称NAO)与高层的大气环球遥相关(Circum-Global Teleconnection,简称CGT)的相互作用,使得北半球的降水减少[22]。从空间分布型(EOF1)来看,TraCE-ICE与的TraCE-AF的EOF1最为相似,空间相关系数为0.49,而与TraCE-ORB的EOF1的空间相关系数仅为-0.03,对比图 9a和9e,二者的主要差别在北美季风区存在相反的变化趋势,可能是由于地球轨道参数对于气候系统内部变率的调制作用,这也说明4.2 ka B. P.事件主要受到地球轨道参数和气候系统内部变率的共同影响。

|
图 9 4.2 ka B. P.事件(4800~4000 a B. P.)TraCE单因子试验模拟的北半球季风降水EOF分解的第一模态和时间序列 (a,b)TraCE-ORB;(c,d)TraCE-GHG;(e,f)TraCE-ICE;(g,h)TraCE-MWF Fig. 9 The leading EOF mode and the corresponding principal component of NHMP during 4.2 ka B. P. event(4800~4000 a B. P.) from TraCE single forcing experiment |
本文利用气候系统模式模拟的TraCE-AF试验以及各个单因子敏感性试验结果,研究了全新世两次典型突变事件下北半球季风降水的变化特征及其成因,主要结论如下:
(1) TraCE-AF模拟与观测资料的年平均降水率分布比较相似,二者的相关系数达到0.92,但在热带西太平洋地区模拟的降水明显高于观测资料,TraCE-AF还较好地模拟出降水年较差的空间分布。此外,TraCE-AF模拟的北半球季风区的范围与观测也较为接近,北美子季风区、北非子季风区和亚洲子季风区均有较好体现,但亚洲子季风区和北美子季风区范围均比观测的有所减小,而北非子季风区范围比观测到的有所增大。
(2) 两次典型突变事件下北半球夏季地表气温变化的空间分布存在差异,8.2 ka B. P.事件欧亚大陆中高纬度地区的降温幅度明显大于4.2 ka B. P.事件的降温幅度,而8.2 ka B. P.事件后北大西洋的降温幅度明显大于4.2 ka B. P.事件后该区域的降温幅度。此外,8.2 ka B. P.事件下北美中部有明显的增温,而在4.2 ka B. P.事件下该地区为降温。
(3) 两次典型突变事件下北半球季风降水变化的空间型类似,主要表现为:在北美季风区和北非季风区西部的降水分布呈现较为一致的负距平,在亚洲季风区西部的印度季风降水为全区一致的负距平,东北部的东亚季风降水为南北反向变化的分布型。
(4) 两次典型突变事件下环流场变化的空间型相似,突变事件发生后,南半球马斯克林高压减弱,越赤道气流变弱,这使得印度季风降水减少。受到西太平洋副高减弱的影响,东亚东部的偏南气流较弱,有利于形成“南涝北旱”的降水分布型。北美季风区受到北大西洋副高减弱的影响,不利于从墨西哥湾向北美东部的水汽输送,导致北美季风降水一致偏少。北非季风区西部由异常的东风主导,风由陆地吹向海洋,使得该区域的降水偏少。但是4.2 ka B. P.事件的环流强度变化明显弱于8.2 ka B. P.事件。
(5) 影响两次典型突变事件的北半球季风降水变化的因子存在差异,8.2 ka B. P.事件下北半球季风降水变化主要是淡水注入所致,而4.2 ka B. P.事件主要受到地球轨道参数和气候系统内部变率的共同影响。
上述结论只是对TraCE-21ka模拟试验结果的初步分析,关于气候突变事件下不同外强迫因子对于北半球季风降水的影响机理还需要进一步分析研究。最后,本文仅使用单个气候模式的模拟结果进行分析,可能存在不确定性,还需要更多的模拟结果加入对本文进行验证。
致谢: 感谢审稿专家不厌其烦地为本文提出的宝贵修改意见和建议,感谢编辑部杨美芳老师对文章悉心地编辑和指导!
| [1] |
An Z S, Wu G X, Li J P, et al. Global monsoon dynamics and climate change[J]. Annual Review of Earth and Planetary Sciences, 2015, 43(1): 29-77. DOI:10.1146/annurev-earth-060313-054623 |
| [2] |
Wang B, Liu J, Kim H J, et al. Recent change of the global monsoon precipitation(1979-2008)[J]. Climate Dynamics, 2012, 39(5): 1123-1135. DOI:10.1007/s00382-011-1266-z |
| [3] |
O'Brien S R, Mayewski P A, Meeker L D, et al. Complexity of Holocene climate as reconstructed from a Greenland ice core[J]. Science, 1995, 270(5244): 1962-1964. DOI:10.1126/science.270.5244.1962 |
| [4] |
Bond G, Showers W, Cheseby M, et al. A pervasive millennial-scale cycle in North Atlantic Holocene and glacial climates[J]. Science, 1997, 278(5341): 1257-1266. DOI:10.1126/science.278.5341.1257 |
| [5] |
Alley R B, Agustsdottir A M. The 8 k event:Cause and consequences of a major Holocene abrupt climate change[J]. Quaternary Science Reviews, 2005, 24(10): 1123-1149. DOI:10.1016/j.quascirev.2004.12.004 |
| [6] |
Beget J E. Radiocarbon-dated evidence of worldwide Early Holocene climate change[J]. Geology, 1983, 11(7): 389-393. DOI:10.1130/0091-7613(1983)11<389:REOWEH>2.0.CO;2 |
| [7] |
deMenocal P B. Cultural responses to climate change during the Late Holocene[J]. Science, 2001, 292(5517): 667-673. DOI:10.1126/science.1059827 |
| [8] |
董进国, 吉云松, 钱鹏. 黄土高原洞穴石笋记录的8.2 ka B. P.气候突变事件[J]. 第四纪研究, 2013, 33(5): 1034-1036. Dong Jinguo, Ji Yunsong, Qian Peng. "8.2 ka B. P. Event" of Asian monsoon in a stalagmite record[J]. Quaternary Sciences, 2013, 33(5): 1034-1036. DOI:10.3969/j.issn.1001-7410.2013.05.20 |
| [9] |
Staubwasser M, Sirocko F, Grootes P M, et al. Climate change at the 4.2 ka BP termination of the Indus valley civilization and Holocene South Asian monsoon variability[J]. Geophysical Research Letters, 2003, 30(8): 1425. DOI:10.1029/2002GL016822 |
| [10] |
吴文祥, 刘东生. 4000 a B. P.前后降温事件与中华文明的诞生[J]. 第四纪研究, 2001, 21(5): 443-451. Wu Wenxiang, Liu Tungsheng. 4000 a B. P. event and its implications for the origin of ancient Chinese civilization[J]. Quaternary Sciences, 2001, 21(5): 443-451. DOI:10.3321/j.issn:1001-7410.2001.05.008 |
| [11] |
王绍武. 全新世北大西洋冷事件:年代学和气候影响[J]. 第四纪研究, 2009, 29(6): 1146-1153. Wang Shaowu. Holocene cold events in the North Atlantic:Chronology and climatic impact[J]. Quaternary Sciences, 2009, 29(6): 1146-1153. |
| [12] |
Dixit Y, Hodell D A, Sinha R, et al. Abrupt weakening of the Indian summer monsoon at 8.2 kyr B. P.[J]. Earth and Planetary Science Letters, 2014, 391: 16-23. DOI:10.1016/j.epsl.2014.01.026 |
| [13] |
Dixit Y, Hodell D A, Petrie C A. Abrupt weakening of the summer monsoon in Northwest India 4100 yr ago[J]. Geology, 2014, 42(4): 339-342. DOI:10.1130/G35236.1 |
| [14] |
Morrill C, Overpeck J T, Cole J E. A synthesis of abrupt changes in the Asian summer monsoon since the last deglaciation[J]. The Holocene, 2003, 13(4): 465-476. DOI:10.1191/0959683603hl639ft |
| [15] |
Lamb H F, Gasse F, Benkaddour A, et al. Relation between century-scale Holocene arid intervals in tropical and temperate zones[J]. Nature, 1995, 373(6510): 134-137. DOI:10.1038/373134a0 |
| [16] |
Haug G H, Hughen K A, Sigman D M. Southward migration of the Intertropical Convergence Zone through the Holocene[J]. Science, 2001, 293(5533): 1304-1308. DOI:10.1126/science.1059725 |
| [17] |
Renssen H, Goosse H, Fichefet T, et al. The 8.2 kyr BP event simulated by a Global Atmosphere-Sea-Ice-Ocean Model[J]. Geophysical Research Letters, 2001, 28(8): 1567-1570. DOI:10.1029/2000GL012602 |
| [18] |
Bauer E, Ganopolski A, Montoya M. Simulation of the cold climate event 8200 years ago by meltwater outburst from Lake Agassiz[J]. Paleoceanography, 2004, 19(3): PA3014. DOI:10.1029/2004PA001030 |
| [19] |
Matero I S O, Gregoire L J, Ivanovic R F, et al. The 8.2 ka cooling event caused by Laurentide ice saddle collapse[J]. Earth and Planetary Science Letters, 2017, 473: 205-214. DOI:10.1016/j.epsl.2017.06.011 |
| [20] |
Booth R K, Jackson S T, Forman S L, et al. A severe centennial-scale drought in mid-continental North America 4200 years ago and apparent global linkages[J]. The Holocene, 2005, 15(3): 321-328. DOI:10.1191/0959683605hl825ft |
| [21] |
Ning L, Liu J, Bradley R S, et al. Comparing the spatial patterns of climate change in the 9th and 5th millennia BP from TRACE-21 model simulations[J]. Climate of Past, 2019, 15(1): 41-52. DOI:10.5194/cp-15-41-2019 |
| [22] |
Yan M, Liu J, Ning L. Physical processes of cooling and megadrought in 4.2 ka BP event:results from TraCE-21ka simulations[J]. Climate of Past, 2019, 15(1): 265-277. DOI:10.5194/cp-15-265-2019 |
| [23] |
张肖剑, 靳立亚. 全新世南亚高压南北移动及其与亚洲夏季风降水的关系[J]. 第四纪研究, 2018, 38(5): 1244-1254. Zhang Xiaojian, Jin Liya. Meridional migration of the South Asian High and its association with Asian summer monsoon precipitation during the Holocene[J]. Quaternary Sciences, 2018, 38(5): 1244-1254. |
| [24] |
王志远, 王江林, 张诗茄, 等. 不同时间尺度影响下的北半球夏季风空间特征及其可能影响机制[J]. 第四纪研究, 2018, 38(6): 1494-1506. Wang Zhiyuan, Wang Jianglin, Zhang Shijia, et al. Impact of different timescales on the characteristics and mechanisms of the Northern Hemisphere Summer Monsoon:Based on the CESM results[J]. Quaternary Sciences, 2018, 38(6): 1494-1506. |
| [25] |
焦腾腾, 李佳瑞, 陈婕, 等. 全新世北大西洋海面温度变化趋势:观测-模拟对比研究[J]. 第四纪研究, 2016, 36(3): 747-757. Jiao Tengteng, Li Jiarui, Chen Jie, et al. Changing trends of sea surface temperatures in the North Atlantic during the Holocene:A study of model-data comparison[J]. Quaternary Sciences, 2016, 36(3): 747-757. |
| [26] |
张志平, 黄伟, 陈建徽, 等. 全新世东亚夏季风演化的多尺度周期变化及其可能机制探讨[J]. 第四纪研究, 2017, 37(3): 498-509. Zhang Zhiping, Huang Wei, Chen Jianhui, et al. Multi-time scale analysis of East Asian summer monsoon and its possible mechanism during Holocene[J]. Quaternary Sciences, 2017, 37(3): 498-509. |
| [27] |
吴海斌, 李琴, 于严严, 等. 全新世中期中国气候格局定量重建[J]. 第四纪研究, 2017, 37(5): 982-998. Wu Haibin, Li Qin, Yu Yanyan, et al. Quantitative climate reconstruction in China during the mid-Holocene[J]. Quaternary Sciences, 2017, 37(5): 982-998. |
| [28] |
张仲石, 燕青, 张冉, 等. 第四纪北半球冰盖发育与东亚气候的遥相关[J]. 第四纪研究, 2017, 37(5): 1009-1016. Zhang Zhongshi, Yan Qing, Zhang Ran, et al. Teleconnection between Northern Hemisphere ice sheets and East Asian climate during Quaternary[J]. Quaternary Sciences, 2017, 37(5): 1009-1016. |
| [29] |
燕青, 张仲石, 张冉, 等. 过去千年北大西洋热带气旋生成潜势的模拟研究:基于PMIP3气候模式[J]. 第四纪研究, 2017, 37(5): 1141-1150. Yan Qing, Zhang Zhongshi, Zhang Ran, et al. Simulation of tropical cyclone genesis potential over the North Atlantic in the last millennium based on PMIP3 models[J]. Quaternary Sciences, 2017, 37(5): 1141-1150. |
| [30] |
韩春凤, 刘健, 王志远. 过去2000年亚洲夏季风降水百年尺度变化及其区域差异的模拟分析[J]. 第四纪研究, 2016, 36(3): 732-746. Han Chunfeng, Liu Jian, Wang Zhiyuan. Simulated analysis of Asian summer monsoon precipitation on centennial time scale and its regional differences over the past 2000 years[J]. Quaternary Sciences, 2016, 36(3): 732-746. |
| [31] |
Wang Y, Cheng H, Edwards L R, et al. The Holocene Asian monsoon:Links to solar changes and north Atlantic climate[J]. Science, 2005, 308(5723): 854-857. DOI:10.1126/science.1106296 |
| [32] |
Tan L, Cai Y, Cheng H, et al. Centennial to decadal-scale monsoon precipitation variations in the upper Hanjiang River region, China over the past 6650 years[J]. Earth and Planetary Science Letters, 2018, 482: 580-590. DOI:10.1016/j.epsl.2017.11.044 |
| [33] |
吴文祥, 刘东生. 4000 a B. P.前后东亚季风变迁与中原周围地区新石器文化的衰落[J]. 第四纪研究, 2004, 24(3): 278-284. Wu Wenxiang, Liu Tungsheng. Variation in East Asia monsoon around 4000 a B. P. and the collapse of Neolithic culture around central plain[J]. Quaternary Sciences, 2004, 24(3): 278-284. DOI:10.3321/j.issn:1001-7410.2004.03.006 |
| [34] |
Metcalfe S E, Barron J A, Davies S J. The Holocene history of the North American Monsoon:'known knowns' and 'known unknowns' in understanding its spatial and temporal complexity[J]. Quaternary Science Reviews, 2015, 120: 1-27. DOI:10.1016/j.quascirev.2015.04.004 |
| [35] |
He F. Simulation Transient Climate Evolution of the Last Deglaciation with CCSM 3[D]. Wisconsin: The PhD Dissertation of University of Wisconsin-Madison, 2011: 1-185.
|
| [36] |
Liu Z, Otto-Bliesner B, He F, et al. Transient simulation of last deglaciation with a new mechanism for Bølling-Allerød warming[J]. Science, 2009, 325(5938): 310-314. DOI:10.1126/science.1171041 |
| [37] |
He F, Shakun J D, Clark P U, et al. Northern Hemisphere forcing of Southern Hemisphere climate during the last deglaciation[J]. Nature, 2013, 494(7435): 81-85. DOI:10.1038/nature11822 |
| [38] |
Collins W D, Rasch P J, Boville B A, et al. Description of the NCAR Community Atmosphere Model(CAM3.0)[R]. Technical Report NCAR/TN-464+STR, 2004. http://www.cesm.ucar.edu/models/atm-cam/docs/description.
|
| [39] |
Collins W D, Rasch P J, Boville B A, et al. The formulation and atmospheric simulation of the Community Atmosphere Model Version 3(CAM3)[J]. Journal of Climate, 2006, 19(11): 2144-2161. DOI:10.1175/JCLI3760.1 |
| [40] |
Smith R D, Gent P R. Reference Manual for the Parallel Ocean Program(POP), Ocean Component of the Community Climate System Model(CCSM2.0 and 3.0)[R]. Technical Report LA-UR-02-2484, 2002. http://www.ccsm.ucar.edu/models/ccsm3.0/pop.
|
| [41] |
Berger A L. Long-term variations of daily insolation and Quaternary climatic changes[J]. Journal of Meteorology, 1978, 35(12): 2362-2367. DOI:10.1175/1520-0469(1978)035<2362:LTVODI>2.0.CO;2 |
| [42] |
Joos F, Spahni R. Rates of change in natural and anthropogenic radiative forcing over the past 20, 000 years[J]. Proceedings of the National Academy of Sciences of the United States of America, 2008, 105(5): 1425-1430. DOI:10.1073/pnas.0707386105 |
| [43] |
Peltier W R. Global glacial isostasy and the surface of the ice-age Earth:The ICE-5G(VM2)Model and GRACE[J]. Annual Review of Earth and Planetary Sciences, 2004, 20(32): 111-149. DOI:10.1146/annurev.earth.32.082503.144359 |
| [44] |
Xie P, Arkin P A. Global precipitation:A 17-year monthly analysis based on gauge observations, satellite estimates, and numerical model outputs[J]. Bulletin of the American Meteorological Society, 1997, 78(11): 2539-2558. DOI:10.1175/1520-0477(1997)078<2539:GPAYMA>2.0.CO;2 |
| [45] |
Huffman G J, Adler R F, Bolvin D T, et al. Improving the global precipitation record:GPCP Version 2.1[J]. Geophysical Research Letters, 2009, 36(17): L17808. DOI:10.1029/2009GL040000 |
| [46] |
Lee J Y, Wang B. Future change of global monsoon in the CMIP 5[J]. Climate Dynamics, 2014, 42(1): 101-119. DOI:10.1007/s00382-012-1564-0 |
| [47] |
Wang B, Ding Q. Changes in global monsoon precipitation over the past 56 years[J]. Geophysical Research Letters, 2006, 33(6): 272-288. DOI:10.1029/2005GL025347 |
| [48] |
Wang B, Ding Q. Global monsoon:Dominant mode of annual variation in the tropics[J]. Dynamics of Atmospheres and Oceans, 2008, 44(3): 165-183. DOI:10.1016/j.dynatmoce.2007.05.002 |
| [49] |
North G R, Bell T L, Cahalan R F, et al. Sampling errors in the estimation of Empirical Orthogonal Functions[J]. Monthly Weather Review, 1982, 110(7): 699-706. DOI:10.1175/1520-0493(1982)110<0699:SEITEO>2.0.CO;2 |
2 Jiangsu Provincial Key Laboratory for Numerical Simulation of Large Scale Complex Systems/School of Mathematical Science, Nanjing Normal University, Nanjing 210023, Jiangsu;
3 Open Studio for the Simulation of Ocean-Climate-Isotope, Pilot National Laboratory for Marine Science and Technology(Qingdao), Qingdao 266237;
4 State Key Laboratory of Loess and Quaternary Geology, Institute of Earth Environment, Chinese Academy of Science, Xi'an 710061, Shaanxi)
Abstract
Based on the results of TraCE-21ka simulated by Community Climate System Model version 3 (CCSM3), the spatial pattern of the Northern Hemisphere summer (JJA) temperature and monsoon precipitation changes of two typical abrupt climate changes in the "8.2 ka B. P. event" (9200~8800 a B.P. versus 8800~8000 a B. P.) and the "4.2 ka B. P. event" (4800~4500 a B.P. versus 4500~4000 a B. P.) were analyzed. Through comparing with four single-forcing experiments (Orbital Forcing, Atmospheric Greenhouse Gases, Ice Sheets and Meltwater Forcing), the possible mechanism of the changes of Northern Hemisphere summer monsoon precipitation were discussed as well. The results showed that:(1) The surface temperature dropped significantly over the mid-high latitudes of the Eurasian continent when two typical abrupt climate events occurred, but the 8.2 ka B. P. event cooled greater than the 4.2 ka B. P. event. In addition, there is significant temperature increase in the central North America under the 8.2 ka B. P. event, but the area is cooling down in the 4.2 ka B. P. event. (2) The spatial distribution of monsoon precipitation in the Northern Hemisphere was similar for two typical abrupt climate events. The precipitation of the North American monsoon, west of North African monsoon and the Indian monsoon presented consistent reduction. The East Asian monsoon precipitation presented a dipole pattern of "Southern-flood and Northern-drought". (3) The spatial pattern of the atmospheric circulation was similar for two typical abrupt climate events, but the intensity of the atmospheric circulation of the 4.2 ka B. P. event is significantly weaker than the 8.2 ka B. P. event. (4) The Northern Hemisphere monsoon precipitation change for the 8.2 ka B. P. event was mainly caused by freshwater injection, while the Northern Hemisphere monsoon precipitation was mainly affected by the changes of orbital forcing and internal variability for the 4.2 ka B. P. event. 2019, Vol.39

