2 南京师范大学数学科学学院, 江苏省大规模复杂系统数值模拟重点实验室, 江苏 南京 210023;
3 青岛海洋科学与技术试点国家实验室海洋-气候-同位素模拟开放工作室, 山东 青岛 266237;
4 中国 科学院地球环境研究所, 黄土与第四纪地质国家重点实验室, 陕西 西安 710061)
气候变化存在着多种时间尺度谱,分析短尺度变化必须考虑长尺度变化的背景[1]。全新世是距今最近的地质年代,与当今人类生存的气候环境最为接近,见证了当今人类社会的发展与繁荣,是国际过去全球变化(Past Global Changes,简称PAGES)研究的重要时段之一[2]。
近年来,随着一系列高分辨率、高测年精度的古气候记录的建立,人们对于全新世气候变化的理解逐渐深入,全新世气候变化的复杂性逐渐为人所知,一系列千年-百年尺度全新世气候快速变化事件得到了广泛关注[3~5]。Bond等[6]根据冰筏碎屑沉积物(Ice-Rafted Debris,简称IRD)指出全新世期间北大西洋存在8次冷事件,由近及远编号为事件1到8。后人研究显示小冰期属于类似的冷事件,编号为0[7]。这9次冷事件的信号在全球许多区域重建的气候代用指标序列中都有体现[8]。一些较大规模的全新世冷事件如8.2 ka B. P.、4.2 ka B. P.事件发生前后在全球许多地方都检测到了相关信号[9~10],这说明全新世冷事件具有全球性。
通常认为一次全新世冷事件能够维持100~200年[7, 11],其间全球不同区域表现出一定的空间差异。Wanner等[8]发现全新世6次冷事件期间全球气温、湿度/降水的时空变化特征差异很大。Mayewski等[12]综合分析了来自全球不同地区大约50条古气候代用资料,发现全新世曾出现过6次显著的气候快速变化事件,大多数气候快速变化事件期间极地偏冷而热带偏干。因此,探索全新世冷事件的时空差异需要具有一定时间长度、较高精度和分布范围较广的古气候资料做支撑,然而全球范围内能用于重建高分辨率长时间古气候序列的代用材料种类十分有限,且空间分布不均,对数百年至千年尺度气候快速变化事件的范围及其空间差异的研究还存在很大的不确定性。
模拟试验在一定程度上能够弥补气候代用资料重建序列存在的问题,模拟试验被广泛地应用于历史时期气候变化特征及其成因机制的研究中[13~17],针对全新世冷事件时期的气候状况也开展了一些模拟试验[18~19]。前人利用数值模拟试验结果对全新世典型冷事件如8.2 ka B. P.事件、4.2 ka B. P.事件发生时全球较大空间范围内的气候变化特征及其成因机制进行了一些研究和探索[20~30],对几次典型冷事件之间的对比分析也开展了一些工作[31~32],但迄今为止,对整个全新世期间在半球甚至全球较大空间尺度上冷事件的发生情况及其空间格局的研究还很欠缺。
本文拟使用TraCE-21ka试验模拟的全新世温度和降水情况,定义并提取了全新世北半球的典型冷事件,比较每次冷事件的规模,分析了每次冷事件期间温度与降水的空间分布,并结合多个单因子敏感性试验结果及其外强迫序列,初步探讨了部分典型冷事件的成因。
1 资料与方法 1.1 模式与模拟资料通用气候系统模式CCSM(The Community Climate System Model)是由美国国家大气研究中心NCAR(National Center for Atmospheric Research)推出的气候模式,由大气、海洋、陆地表面和海冰四个子模式通过“中央耦合器”耦合而成[33]。多年来此模式已被广泛地应用于海洋与气候研究的各个领域[15~16]。CCSM3是CCSM的第三个版本,被应用于国际耦合模式比较计划第三阶段(CMIP3)中,也是联合国政府间气候变化专业委员会第4次评估报告[34](IPCC AR4)中使用的主要气候模式之一。关于CCSM3的详细介绍可以参考其官网(http://www.cesm.ucar.edu/models/ccsm3.0)。
TraCE-21ka是利用CCSM3模式进行的过去21000年气候数值模拟试验,包括一个全强迫试验和4个单因子敏感性试验。全强迫试验使用的外强迫因子包括轨道强迫[35](Orbital Forcing)、大气温室气体[36](Atmospheric Greenhouse Gases)、大陆冰盖[37](Ice Sheets and Paleogeography)和淡水注入[19](Meltwater Forcing)4种,其中大气温室气体包含二氧化碳(CO2)、甲烷(CH4)和一氧化二氮(N2O) 3种,图 1显示了4种外强迫因子的时间序列,这4个单因子敏感性试验分别使用了1种外强迫因子。所有试验在T31_gx3v5分辨率下进行,分析各气候要素所用数据的水平分辨率均为3.75°×3.75°,即经向48格点,纬向96格点。关于这套模拟试验更详细的情况可见参考文献[19]。

|
图 1 TraCE-21ka使用的外强迫序列 时间序列分别为:(a)大气温室气体强迫[36],包括CO2(红实线,单位为μL/L)、N2O(红虚线,单位为10-3μL/L)和CH4(黑实线,单位为10-3μL/L);(b)北半球的淡水注入强迫[19](以每千年内北半球的海平面高度变化量来表示,单位为m/ka);(c)大陆冰盖强迫[37](以北半球冰量总体积表示,单位为106 km3);(d)轨道强迫[35],包括黄赤交角(红实线,单位为°)、偏心率(黑实线)和岁差(黑虚线) Fig. 1 External forcings used in TraCE-21ka simulation Time series: (a)Atmospheric greenhouse gases forcings[36], including CO2(red solid line, unit:μL/L), N2O(red dashed line, unit:10-3μL/L)and CH4(black solid line, unit:10-3μL/L); (b)Meltwater flux into the Northern Hemisphere Ocean[19](expressed as global sea level change in meters per 1000 years, unit: m/ka); (c)Ice sheets and paleogeography forcing[37](expressed as total ice volume in the Northern Hemisphere, unit:106 km3); (d)Oribtal forcing[35], including obliquity(red line, unit: degree), eccentricity(black solid line)and precession(black dashed line) |
利用这套资料围绕过去21 ka特别是末次冰消期以来的全球气候完成了大量研究[19, 38~45],已开展了有关全新世8.2 ka B. P.和4.2 ka B. P.两次冷事件期间全球气候空间形态及其成因机制方面的工作[29, 32]。本文模拟资料/模拟序列/模拟结果均指代这套数据中的全强迫试验结果;北半球范围为0°~90°N,全新世时段选取为12~0 ka B. P.。
1.2 重建资料古气候要素的定量化是认识气候变化规律的关键节点之一[46]。前人研究利用海洋沉积物、湖泊沉积物、花粉、冰芯等地质记录,完成了全新世期间北半球许多区域温度要素的重建与集成[47]。为了说明TraCE-21ka对全新世北半球冷事件的模拟情况,需选择一批重建序列,与模拟序列中的冷事件年份进行对比。
首先,全新世冷事件持续的时间一般在百年尺度,应尽可能选取具有较高时间分辨率的重建序列;第二,重建资料的研究时段应覆盖大部分或整个全新世,以保证重建序列精度在较长时间尺度上的统一性;第三,全新世期间全球范围内冷事件发生存在着不同步的情况,用于对比的重建序列地点应尽可能覆盖全球;第四,应尽量选取公开刊物中影响因子较高,研究者在该领域有较多积累的研究文献[48];最后,不同环境感应体对于不同气候变化的敏感程度不同,记录的气候情况侧重不完全一致,使重建序列也有差异,应尽量选取不同环境感应体制作的重建序列。依据这些标准,最终选取以下重建/集成序列与模拟资料进行对比(表 1)。表中的时间分辨率为平均时间分辨率,以序列的时间范围长度除以序列包含的样点数估算。
| 表 1 用于与模拟资料对比的重建/集成序列 Table 1 Reconstructions and integrated datasets for model-data comparison |
由于重建数据的初始分辨率不一致,因此为便于比较,采用三次样条插值法先将所有重建/集成数据和模式数据的时间分辨率插值为1年,然后用平滑先验法[54](Lambda=10000)处理插值后的气候序列,以获得较长时间尺度的气候信号,所有温度序列均经过距平处理(减去同一序列在整个全新世的平均温度)。在此基础上,定义并计算了全新世北半球典型冷事件的发生年份及其规模,运用合成分析方法得到冷事件发生时温度与降水的空间格局。
2 全新世北半球典型冷事件的定义及规模 2.1 典型冷事件的定义及模拟与重建对比本文关注的全新世典型冷事件是指全新世期间降温最显著、温度最低的时段。具体定义标准为:1)气温在此年份取得极小值;2)气温在此年份的前后各250年,共500年内取得最小值。图 2给出了根据此定义,全新世期间TraCE-21ka模拟的北半球平均温度序列(下称模拟序列,图 2g)及6条北半球重建/集成温度序列(图 2a~2f)中的典型冷事件情况。

|
图 2 重建/集成序列与模拟序列中的全新世北半球典型冷事件 时间序列分别为:(a)北半球集成温度[47],(b)北美欧洲花粉集成温度[53],(c)格陵兰岛冰芯重建温度[49],(d)北美花粉重建温度[51],(e)瑞典摇蚊重建温度[52],(f)北大西洋浮冰指数,以岩石碎屑颗粒的百分比表示[6, 50],(g)TraCE-21ka[19]模拟的北半球平均温度序列;所有温度序列均为相对整个序列的距平,图顶部的数值标记了模拟序列中的冷事件;(a)~ (g)中的浅灰色条包括了模拟序列中各冷事件年份的前后各200年,深灰色竖线指示了各时间序列中的冷事件 Fig. 2 Holocene cold events in the Northern Hemisphere from reconstructions, integrated datasets and simulation Time series are (a) Northern Hemisphere integrated temperature[47], (b)North America and Europe temperature integrated from pollen[53], (c)Temperature reconstructed from Greenland ice core[49], (d)North America temperature reconstructed from pollen[51], (e)Swedish temperature reconstructed from chironomid[52], (f) North Atlantic drifted ice index[6, 50], (expressed as percentages of lithic grains or ice-rafted debris, unit: %) and (g)Northern Hemisphere integrated temperature in TraCE-21ka simulation[19]. All temperature time series are anomalies calculated relative to the mean over the whole period. Numbers on the top of figure mark cold events in simulation, light gray bars in (a)~(g) cover 200 years before and after each cold event in simulation, dark grey vertical lines in each panel indicate respective cold events in time series |
由图 2可见,整个全新世期间,各重建/集成序列中发生了6~12次典型冷事件,TraCE-21ka模拟的北半球平均温度序列(图 2g)显示了10次冷事件,由远到近分别是:9.7 ka B. P.、8.3 ka B. P.、7.3 ka B. P.、6.2 ka B. P.、5.2 ka B. P.、4.2 ka B. P.、3.4 ka B. P.、2.1 ka B. P.、1.0 ka B. P.和0.2 ka B. P.。参照前文的定义,这些年份指代了全新世期间各重建/集成/模拟序列在较长时间尺度上冷事件的最冷年,因此与前人研究中获得的冷事件时间[6, 8, 55]大体相近而并不一定完全一致。模拟结果中的每相邻两次冷事件间隔千年左右,属于千年尺度冷事件,与重建/集成序列中的冷事件间隔情况接近[6~8, 12, 55]。各重建/集成序列指示的冷事件的发生时间也并不完全一致,这可能是由冷事件发生时的空间差异所引起的。表 2统计对比了模拟与重建的每次冷事件发生年份的差异情况。第一列为模拟序列中的冷事件年份,其他列为重建和模拟序列冷事件相差的年份。“+”表示重建的冷事件发生的比模拟的冷事件晚,“-”表示重建的冷事件发生的比模拟的冷事件早,“0”表示重建的冷事件与模拟的冷事件几乎同时发生,空白表示重建的冷事件与模拟的冷事件发生年份相差超过200年。
| 表 2 模拟与重建的冷事件发生年份比较(单位:ka) Table 2 Comparison between time of Holocene cold events in the Northern Hemisphere from reconstructions, integrated datasets and TraCE-21ka simulation(unit: ka) |
许多研究认为4.2 ka B. P.和8.2 ka B. P.是全新世最典型的两次冷事件,并依据这两次事件将整个全新世分为早全新世、中全新世、晚全新世3段[56]。这两次冷事件在模拟序列中都有所体现。Marcott[47]、GISP2[49]序列和模拟序列在8.3 ka B. P.前后几乎同时呈现为冷事件发生,比通常认为的8.2 ka B. P.事件时间略早了几十年,在一些序列中这次事件也反映在8.2 ka B. P.和8.3 ka B. P.之间[57~58],这次事件是模拟序列和GISP2序列显示的全新世早期最剧烈的一次降温事件,而在Marcott序列中此事件降温幅度并未显著超过其他冷事件。4.2 ka B. P.前后,Jeremiah[53]、Viau[51]和Bond[50]序列中有冷事件发生,其中Jeremiah序列与模拟序列的冷事件时间完全一致,Viau和Bond序列的冷事件时间与模拟序列的差在0.1 ka以内。尽管冷事件发生时间高度一致,但这3条序列在4.2 ka B. P.事件中的降温幅度并未显著超过全新世其他冷事件,说明4.2 ka B. P.冷事件信号在这些序列中并不显著。
与4.2 ka B. P.和8.2 ka B. P.这两次冷事件类似,模拟序列中其他冷事件的前后200年中至少有一条重建/集成序列中发生了冷事件。全新世的3个时段内模拟序列与重建/集成序列的冷事件都对应较好。早全新世期间,Marcott、Jeremiah、GISP2、Viau和模拟的温度在较长时间尺度上均呈现持续上升趋势,只有Bond序列表现为剧烈震荡。9.8 ka B. P.前后,Bond序列中有振幅较大的冷事件出现,约0.1 ka后,模拟结果中有冷事件发生,又约0.2 ka后GISP2序列中显示发生了冷事件,GISP2和模拟结果中显示的这次冷事件降温幅度都很小。中全新世期间,Jeremiah、Viau和模拟序列均表现为气温小幅上升,GISP2序列表现为温度小幅波动,Marcott序列表现为温度略有下降,Lake850的温度序列先上升后大幅下降再小幅回升,Bond序列呈大幅波动变化态势,模拟序列显示有7.3 ka B. P.、6.2 ka B. P.和5.2 ka B. P.共3次冷事件。7.3 ka B. P.前后约200年内,Marcott、GISP2、Viau序列变化很小,有小幅度降温事件发生;6.2 ka B. P.前后约200年内,Jeremiah、GISP2、Viau序列变化很小,温度同时达到极小值;5.2 ka B. P.前后约200年内,GISP2、Viau序列变化很小,Lake850序列有较大降温,温度同时达到极小值。晚全新世期间,Marcott温度序列呈显著下降趋势,Jeremiah、GISP2略微下降,Lake850和Bond序列波动剧烈,总体表现为先下降后上升,Viau和模拟序列变化平稳,无明显变化趋势。小冰期后期,GISP2、Viau和模拟序列温度略微上升。模拟序列在晚全新世共有3.4 ka B. P.、2.1 ka B. P.、1.0 ka B. P.和0.2 ka B. P.共4次冷事件。3.4 ka B. P.前后约200年内,Jeremiah、Lake850和Bond序列取得极小值;2.1 ka B. P.前后约200年内,Viau、Lake850和Bond序列均取得极小值;模拟结果显示,北半球在1.0 ka B. P.前后发生了冷事件,而前人研究中普遍将包括该时段在内的900~1300年认为是北半球甚至全球范围的暖期[17, 59~67],称为中世纪暖期(Medieval Warm Period,简称MWP),模拟结果与前人研究在这一时段的冷暖情况相背。大量研究表明,太阳活动和火山活动是MWP形成的主要原因[61, 63, 68~70]。模式结果显示1.0 ka B. P.前后发生冷事件,可能与试验中未加入太阳辐射与火山活动外强迫的作用有关。0.2 ka B. P.前后约200年内,GISP2、Viau序列取得极小值,这次冷事件的时间与小冰期中后期基本对应[72]。
2.2 冷事件的规模按照上述标准,对模拟资料中北半球每个空间格点的温度序列进行冷事件提取,忽略将球面投影到平面的面积变换,以格点数量占北半球格点总数的比例作为全新世期间北半球冷事件规模的粗略估算,计算了全新世期间每年及前后各50年共101年内发生冷事件的累计格点百分比,以此作为该年份冷事件规模,如图 3所示。

|
图 3 全新世北半球冷事件规模(蓝线)及模拟序列中的冷事件年份(深灰色竖线) Fig. 3 Scale of Holocene cold events(blue lines)and year of cold events in the Northern Hemisphere from TraCE-21ka simulation(dark gray vertical lines) |
由图 3可见,模拟结果显示全新世北半球共发生10次大规模冷事件,相邻2次大规模冷事件间隔千年左右。冷事件空间规模最大的年份(蓝线中取极大值的年份)与北半球平均温度序列中的冷事件年份(深灰色竖线)几乎完全一致,佐证了上文中认为模拟结果存在10次典型冷事件的判断,10次典型冷事件的发生时间分别为9.7 ka B. P.、8.3 ka B. P.、7.3 ka B. P.、6.2 ka B. P.、5.2 ka B. P.、4.2 ka B. P.、3.4 ka B. P.、2.1 ka B. P.、1.0 ka B. P.和0.2 ka B. P.。全新世期间,北半球的冷事件规模在2.1 ka B. P.前后达到最大,该年份前后百年内北半球有超过60 %的空间格点有冷事件发生;除2.1 ka B. P.外,0.2 ka B. P.前后的冷事件规模也超过50 %;而8.3 ka B. P.前后的冷事件规模相对较小,在24 %左右。所有典型冷事件前后百年内北半球都有超过24 %的空间格点有冷事件发生。
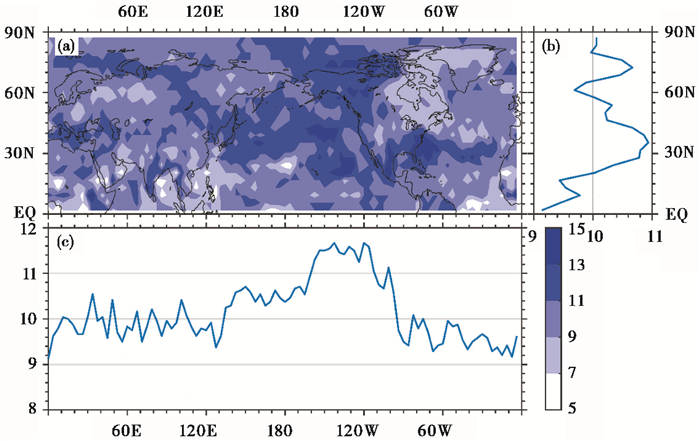
3 典型冷事件的空间特征 3.1 冷事件频次的空间差异全新世期间,北半球冷事件数量在空间上存在显著差异。图 4显示了全新世期间北半球各地(模式中的每个空间格点)发生的冷事件数量空间分布(图 4a)以及冷事件数量的纬向平均(图 4b)和经向平均(图 4c)情况。整个全新世期间,北半球各地发生冷事件总数在5~16次之间,平均在10次左右。

|
图 4 模拟的全新世北半球冷事件数量(a)空间分布及其(b)纬向平均、(c)经向平均情况(单位:次) Fig. 4 Total amount of simulated cold events during Holocene (a) in the Northern Hemisphere and its (b) zonal mean, (c)meridional mean(unit: times) |
北美洲弗罗里达半岛以东海区及太平洋中部约130°W、22°N附近区域在整个全新世发生了超过14次冷事件,是北半球发生冷事件次数最多的两个区域;北美洲西北部和温带太平洋在较大范围内有超过12次冷事件发生,是冷事件发生的相对活跃区域;北美洲东北部哈德逊湾向北一直到格陵兰岛,低纬大西洋、孟加拉湾、中国南海和菲律宾海附近较大范围内平均发生的冷事件次数少于8次,是冷事件发生的相对不活跃区域。由纬向平均冷事件数可以看出(图 4b),35°N附近有最多冷事件发生,接近11次。冷事件数以35°N纬线为中心向南北两侧逐渐减少,向南在赤道附近达到最低值约9次,向北在60°N附近达到最低值约9.7次,再向北,冷事件数剧烈上升,到72°N附近较多,有10.7次,再往北,冷事件数量减少。由经向平均冷事件数可以看出(图 4c),100°~160°W经度范围内的冷事件数最多,达到甚至超过了11次,而0°~20°W经度范围内的冷事件数最少,约9.2次。
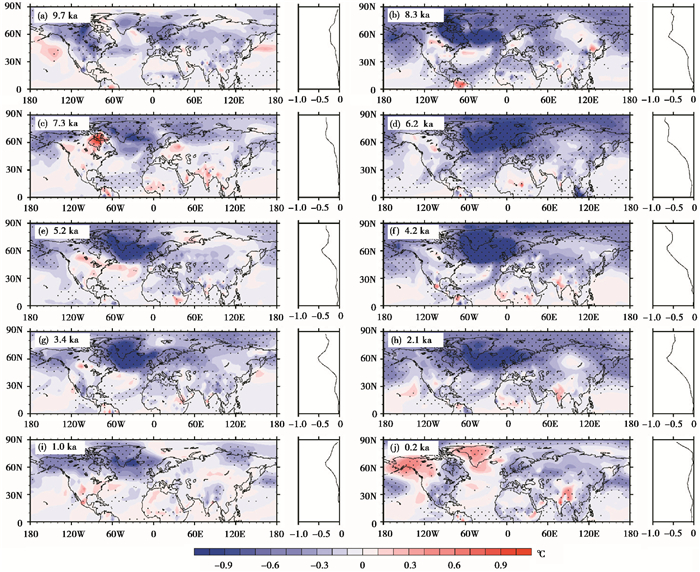
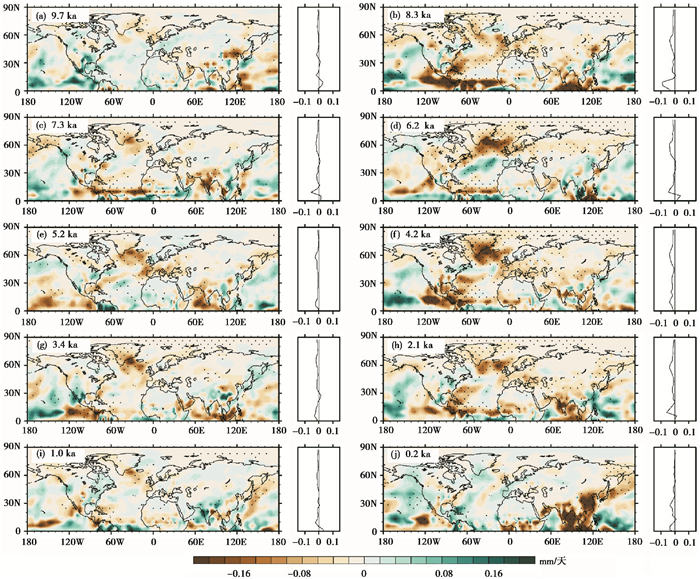
3.2 冷事件下温度和降水的空间差异对前文中提到的10次典型冷事件(9.7 ka B. P.、8.3 ka B. P.、7.3 ka B. P.、6.2 ka B. P.、5.2 ka B. P.、4.2 ka B. P.、3.4 ka B. P.、2.1 ka B. P.、1.0 ka B. P.和0.2 ka B. P.),探究每次冷事件发生时北半球温度和降水变化的空间差异。将与10次冷事件相邻的、冷事件规模取极小值的年份选取为冷事件前和冷事件后的中心年份。取冷事件时,冷事件前和冷事件后中心年份的前后50年共101年,分别计算3个时期的气候平均态,将冷事件前和冷事件后气候平均态的平均值作为非冷事件时期的气候态。图 5和图 6显示了10次典型冷事件时期与相邻非冷事件时期年平均温度和降水的合成差值场。图 7显示了前9次典型冷事件时期与非冷事件时期前后温度和降水变化差值场的集合平均。

|
图 5
10次冷事件时期与非冷事件时期温度的合成差值场(冷事件时期-非冷事件时期)
(a)9.7 ka B. P.;(b)8.3 ka B. P.;(c)7.3 ka B. P.;(d)6.2 ka B. P.;(e)5.2 ka B. P.;(f)4.2 ka B. P.;(g)3.4 ka B. P.;(h)2.1 ka B. P.;(i)1.0 ka B. P.;(j)0.2 ka B. P. 单位:℃;打点表示合成场通过置信度为95 %的T检验 Fig. 5 The changes of temperature between 10 cold event periods and non-cold event periods(cold event period minus non-cold event period) Unit: ℃. Regions pass the T test with a 95 % confidence level are marked with dots |

|
图 6
10次冷事件时期与非冷事件时期降水的合成差值场(冷事件时期-非冷事件时期)
(a)9.7 ka B. P.;(b)8.3 ka B. P.;(c)7.3 ka B. P.;(d)6.2 ka B. P.;(e)5.2 ka B. P.;(f)4.2 ka B. P.;(g)3.4 ka B. P.;(h)2.1 ka B. P.;(i)1.0 ka B. P.;(j)0.2 ka B. P. 单位:mm/天;打点表示合成场通过置信度为95 %的T检验 Fig. 6 The changes of precipitation between 10 cold event periods and non-cold event periods(cold event period minus non-cold event period) Unit: mm/day. Regions pass the T test with a 95 % confidence level are marked with dots |

|
图 7 前9次冷事件时期与非冷事件时期温度(a,单位:℃)和降水(b,单位:mm/天)差值的合成场(冷事件时期-非冷事件时期) 打点表示合成场通过置信度为95 %的T检验 Fig. 7 Ensemble changes of temperature (a, unit: ℃) and precipitation (b, unit: mm/day) between all cold event periods and non-cold event periods in the first 9 cold events(cold event period minus non-cold event period) Regions pass the T test with a 95 % confidence level are marked with dots |
图 5显示,10次冷事件发生时,北半球大范围降温,中高纬地区温度显著降低,赤道及低纬地区温度略微下降或变化不显著。前9次冷事件(9.7 ka B. P.到1.0 ka B. P.,图 5a~5i)发生时,北半球温度变化的空间形态十分相似,从赤道往北直到62°N附近,随纬度升高温度降幅逐渐增加,降温幅度最大的纬度在62°N附近,降温幅度最大的区域集中在北美洲东北部、格陵兰岛南部的北大西洋海域以及挪威海附近,呈现为类似北大西洋多年代际震荡[73](Atlantic Multi-decadal Oscillation,简称AMO)负位相的空间模态。9.7 ka B. P.的冷事件发生时,北美洲东北部的降温幅度最大,格陵兰岛南部的北大西洋海域以及挪威海附近温度降低但并不显著;8.3 ka B. P.的冷事件发生时,北美洲哈德逊湾附近的降温较为显著,达到甚至超过了同一时期北大西洋海域的降温幅度;此后,从7.3 ka B. P.直到1.0 ka B. P.的7次冷事件发生时(图 5c~5i),北半球降温幅度最大的区域都集中在格陵兰岛南部的北大西洋海域以及挪威海附近,其中7.3 ka B. P.和1.0 ka B. P.两次冷事件发生时的大幅降温区域(温度下降超过1 ℃)相比其他几次冷事件时的空间范围稍小。前9次冷事件发生时,在北半球低纬地区有零星小范围区域的温度升高,但没有较大范围的显著增温;在最后一次冷事件(0.2 ka B. P.,图 5j)发生时,北美洲西北部和格陵兰岛及其毗邻海域的较大空间范围内温度显著升高,温度降幅最大的区域位于中纬和极地地区,温度变化的空间形态与前9次冷事件时有较大差异,但整体仍以降温为主。
图 6显示,10次冷事件发生时,北半球大范围变干,低纬地区降水显著减少,中高纬地区降水只在较小范围内变化显著。每次冷事件发生时,北半球降水减少最剧烈的区域基本分布在10°N附近,包括低纬太平洋、低纬大西洋、低纬印度洋和中国南海在内的广大海域,但具体每次冷事件发生时变干程度最大的区域不完全一致。从8.3 ka B. P.开始的8次冷事件(8.3 ka到1.0 ka,图 6b~6i)发生时,中高纬格陵兰岛南部的北大西洋海域降水显著减少,但都小于同一冷事件发生时显著降温的空间范围。在前9次冷事件(9.7 ka到1.0 ka,图 6a~6i)中,东亚地区全区的降水变化较小或不显著,内部不同区域的降水变化呈现区域差异。而在最后一次冷事件(0.2 ka B. P.,图 6j)发生时,东亚地区全区一致显著变干,格陵兰岛南部的北大西洋海域降水增加(但未通过显著性检验),降水变化的空间形态与前9次冷事件时有较大差异。相比其他冷事件,8.3 ka B. P.冷事件发生时,北半球变干的空间规模最大,变干幅度较大,是全新世变干最剧烈的一次冷事件。
由于最后一次冷事件时与非冷事件时的北半球温度与降水变化的空间形态与前9次冷事件的差异较大,因此仅计算了前9次冷事件与非冷事件时温度和降水差值的合成场,如图 7所示。冷事件发生时,北半球温度大范围显著降低,温度变化呈现明显的纬度地带性差异(图 7a):赤道附近温度降幅很小;从赤道向北直到62°N,随纬度升高温度降幅逐渐增加,在62°N附近温度平均降低约0.5 ℃,62°N是北半球受冷事件影响下温度降幅最大的纬度;从62°N向北,随纬度升高降温幅度又略微减小,但降温幅度整体仍超过中低纬区域。降温最显著的区域位于北大西洋地区。冷事件发生时,北半球大规模变干(图 7b),低纬10°N附近海域降水减少最为显著。高纬地区,格陵兰岛南部的北大西洋海域显著变干,降水显著减少的区域与降温最显著区域基本对应,该区域在全新世前9次冷事件期间的温度和降水变化具有较好的时空一致性。
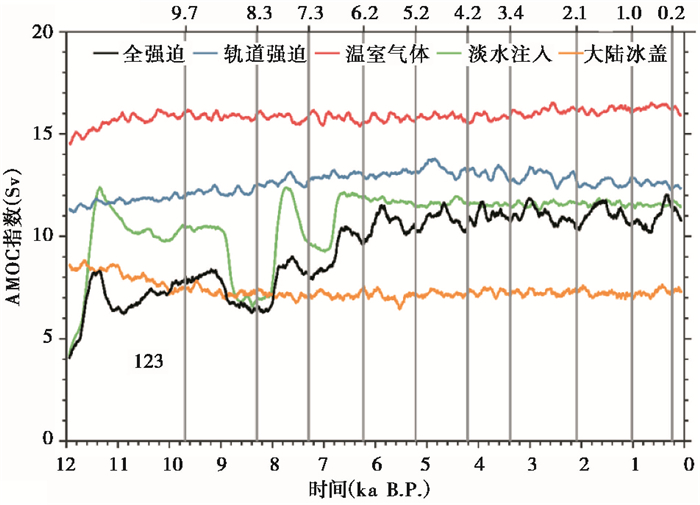
4 典型冷事件的成因与机制初探许多研究认为,8.2 ka B. P.事件与淡水注入北大西洋,导致北大西洋经圈翻转流(Atlantic Meridional Overturning Circulation,简称AMOC)减弱有关[7, 24~25, 32, 74]。为了探索AMOC在其他冷事件形成时是否也有类似的作用,计算了全新世期间全强迫试验中模拟的AMOC指数(图 8中的黑线)。

|
图 8 TraCE-21ka的5个模拟试验中的AMOC指数 灰竖线指示了全强迫试验中的10次冷事件,所有指数序列的时间分辨率为110年 Fig. 8 AMOC Index from 5 experiments in TraCE-21ka simulation Gray vertical lines mark 10 cold events in all forcing simulation, and the resolution of all series is 110 year |
在全强迫试验模拟的10次冷事件中,8.3 ka B. P.、7.3 ka B. P.、6.2 ka B. P.、5.2 ka B. P.、4.2 ka B. P.、3.4 ka B. P.、2.1 ka B. P.、1.0 ka B. P.共8次冷事件时的AMOC强度比前后时段均偏弱,AMOC减弱使得向北输送到北大西洋地区的热量减少,导致北大西洋地区偏干冷,与8次冷事件时北大西洋海域的温度与降水变化空间形态对应良好。为了探究这8次冷事件的成因,我们对比了全强迫试验与4个单因子敏感性试验共5个试验中模拟的AMOC指数(图 8)。由图 8可见,8.3 ka B. P.时,淡水注入敏感性试验的AMOC指数明显偏低,而其他敏感性试验的AMOC减弱不明显,结合这一时期的外强迫因子序列(9.0~8.0 ka B. P.在北美洲哈德逊海峡附近注入淡水),可能是淡水注入导致了8.3 ka B. P.的AMOC减弱,从而造成北美洲哈德逊湾附近的剧烈降温;7.3 ka B. P.前后,淡水注入强迫敏感性试验的AMOC强度处于较弱水平,结合这一时期的外强迫因子序列(7.60~6.85 ka B. P.在北极,北美洲圣劳伦斯河和哈德逊海峡附近注入淡水),淡水注入可能导致了AMOC减弱,引发了冷事件;3.4 ka B. P.前后,轨道强迫单因子敏感性试验与全强迫试验的AMOC减弱幅度几乎一致,可能是轨道强迫导致了这一时期的AMOC减弱,引发了冷事件。其他5次冷事件(6.2 ka B. P.、5.2 ka B. P.、4.2 ka B. P.、2.1 ka B. P.和1.0 ka B. P.)发生时,各敏感性试验的AMOC指数减弱的幅度和持续的时间都远小于全强迫试验的结果,无法将AMOC减弱归结到具体某个外强迫因子上。8次冷事件发生时,格陵兰岛南部的北大西洋海域以及挪威海附近剧烈降温的情况相对一致,而外强迫情况存在差异(8~6 ka B. P.有淡水注入强迫,轨道强迫中岁差的变化周期在2万年,8次冷事件前后共经历了约半个周期),相邻冷事件的时间间隔在千年左右,不能与任何外强迫的周期相对应,地球系统内部变率对8次冷事件发生时北大西洋海域的气候剧烈变化可能也有一定影响。
除这8次冷事件(8.3~1.0 ka B. P.)外,在9.7 ka B. P.和0.2 ka B. P.两次冷事件发生时,AMOC并未减弱,北大西洋海域也没出现显著的变冷及变干现象,冷事件的成因与另外这8次冷事件可能不完全相同。9.7 ka B. P.前后,大气温室气体、大陆冰盖、轨道强迫的外强迫序列变化都很小,模拟时在北极,北美洲圣劳伦斯河和哈德逊海峡附近注入少量淡水,只有全强迫试验和淡水注入单因子敏感性试验在这一时期前后略微降温(图略),这次冷事件可能与淡水注入有关。0.2 ka B. P.前后,以CO2为主的大气温室气体强迫微小波动,随后迅速升高(图 1a中的红线),全强迫试验和温室气体单因子敏感性试验的温度序列(图略)捕捉到了这个微小的变化,并表现为一次冷事件,而这次冷事件在其他单因子敏感性试验中都未出现,这次冷事件可能与大气温室气体强迫的波动有关。各单因子敏感性试验模拟结果的温度变化极小,因缺少表示气候系统内部变率的控制试验模拟结果,无法排除地球系统内部变率对于这两次冷事件发生造成的影响。
5 结论本文利用基于CCSM3开展的过去21000年的TraCE-21ka全强迫试验模拟资料,提取出全新世北半球典型冷事件,对北半球典型冷事件的规模及其温度、降水空间格局进行了分析,并初步探讨了典型冷事件的成因。主要结论如下:
(1) 模拟的冷事件年份与气候重建/集成序列的冷事件年份较为接近,模拟序列中冷事件时间的前后200年中至少有一条重建/集成序列有冷事件发生,模拟资料可以被应用于冷事件研究。
(2) 模拟结果显示,全新世期间北半球发生了10次典型冷事件,分别发生在9.7 ka B. P.、8.3 ka B. P.、7.3 ka B. P.、6.2 ka B. P.、5.2 ka B. P.、4.2 ka B. P.、3.4 ka B. P.、2.1 ka B. P.、1.0 ka B. P.和0.2 ka B. P.前后。
(3) 每次冷事件发生时,北半球大范围降温,温度变化呈现明显的纬度地带性差异,中高纬地区温度显著降低,北半球大范围变干,低纬地区降水显著减少,低纬10°N附近海域降水减少最为显著。
(4) 从8.3 ka B. P.开始到1.0 ka B. P.的8次冷事件发生时,北半球温度和降水的空间变化较为相似,格陵兰岛南部北大西洋海域的降温和变干最为显著,冷事件由AMOC变弱导致。最后一次冷事件(0.2 ka B. P.)时,温度与降水变化的空间形态与前9次冷事件发生时有较大差异,表现为北大西洋海域增暖以及东亚地区一致偏干。
(5) 淡水注入引发了8.3 ka B. P.和7.3 ka B. P.的冷事件,3.4 ka B. P.与9.7 ka B. P.的冷事件可能与轨道强迫有关,0.2 ka B. P.冷事件可能与大气温室气体波动有关,气候系统内部变率对冷事件可能也存在影响。
需要注意的是,上述结论是采用基于通用气候系统模式CCSM3进行的TraCE-21ka模拟试验结果所得出的,本文结论在采用其他地球/气候模式或其他外强迫序列驱动的模拟资料中是否仍然适用,还有待进一步研究。此外,由于缺少控制试验数据,暂时不能明确气候系统内部变率对全新世北半球典型冷事件的发生所起的作用。
致谢: 感谢审稿专家和编辑部杨美芳老师的宝贵意见。
| [1] |
方修琦, 葛全胜, 郑景云. 全新世寒冷事件与气候变化的千年周期[J]. 自然科学进展, 2004, 14(4): 456-461. Fang Xiuqi, Ge Quansheng, Zheng Jingyun. Holocene cold events and the millennial cycle of climate change[J]. Progress in Natural Science, 2004, 14(4): 456-461. DOI:10.3321/j.issn:1002-008X.2004.04.015 |
| [2] |
PAGES. Science Plan and Implementation Strategy(IGBP Report No.57)[M]. Stockholm: IGBP Secretariat, 2009: 1-67.
|
| [3] |
Denton G H, Karlén W. Holocene climatic variations——Their pattern and possible cause[J]. Quaternary Research, 1973, 3(2): 155-205. DOI:10.1016/0033-5894(73)90040-9 |
| [4] |
O'Brien S R, Mayewski P A, Meeker L D, et al. Complexity of Holocene climate as reconstructed from a Greenland ice core[J]. Science, 1995, 270(5244): 1962-1964. DOI:10.1126/science.270.5244.1962 |
| [5] |
Wanner H, Beer J, Bütikofer J, et al. Mid-to Late Holocene climate change:An overview[J]. Quaternary Science Reviews, 2008, 27(19-20): 1791-1828. DOI:10.1016/j.quascirev.2008.06.013 |
| [6] |
Bond G, Showers W, Cheseby M, et al. A pervasive millennial-scale cycle in North Atlantic Holocene and glacial climates[J]. Science, 1997, 278(5341): 1257-1266. DOI:10.1126/science.278.5341.1257 |
| [7] |
王绍武. 全新世北大西洋冷事件:年代学和气候影响[J]. 第四纪研究, 2009, 29(6): 1146-1153. Wang Shaowu. Holocene cold events in the North Atlantic chronology and climatic impact[J]. Quaternary Sciences, 2009, 29(6): 1146-1153. |
| [8] |
Wanner H, Solomina O, Grosjean M, et al. Structure and origin of Holocene cold events[J]. Quaternary Science Reviews, 2011, 30(21-22): 3109-3123. DOI:10.1016/j.quascirev.2011.07.010 |
| [9] |
Alley R B, Agustsdottir A M. The 8 k event:Cause and consequences of a major Holocene abrupt climate change[J]. Quaternary Science Reviews, 2005, 24(10-11): 1123-1149. DOI:10.1016/j.quascirev.2004.12.004 |
| [10] |
Booth R K, Jackson S T, Forman S L, et al. A severe centennial-scale drought in mid-continental North America 4200 years ago and apparent global linkages[J]. The Holocene, 2005, 15(3): 321-328. DOI:10.1191/0959683605hl825ft |
| [11] |
Alley R B, Mayewski P A, Sowers T, et al. Holocene climatic instability:A prominent, widespread event 8200 yr ago[J]. Geology, 1997, 25(6): 483-486. DOI:10.1130/0091-7613(1997)025<0483:HCIAPW>2.3.CO;2 |
| [12] |
Mayewski P A, Rohling E E, Curt Stager J, et al. Holocene climate variability[J]. Quaternary Research, 2004, 62(3): 243-255. DOI:10.1016/j.yqres.2004.07.001 |
| [13] |
韩春凤, 刘健, 王志远. 过去2000年亚洲夏季风降水百年尺度变化及其区域差异的模拟分析[J]. 第四纪研究, 2016, 36(3): 732-746. Han Chunfeng, Liu Jian, Wang Zhiyuan. Simulated analysis of Asian summer monsoon precipitation on centennial time scale and its regional differences over the past 2000 years[J]. Quaternary Sciences, 2016, 36(3): 732-746. |
| [14] |
焦腾腾, 李佳瑞, 陈婕, 等. 全新世北大西洋海面温度变化趋势:观测-模拟对比研究[J]. 第四纪研究, 2016, 36(3): 747-757. Jiao Tengteng, Li Jiarui, Chen Jie, et al. Changing trends of sea surface temperatures in the North Atlantic during the Holocene:A study of model-data comparison[J]. Quaternary Sciences, 2016, 36(3): 747-757. |
| [15] |
韩春凤, 刘健, 王志远. 通用地球系统模式对亚洲夏季风降水的模拟能力评估[J]. 气象科学, 2017, 37(2): 151-160. Han Chunfeng, Liu Jian, Wang Zhiyuan. Evaluation of community earth system model in simulating Asian summer monsoon precipitation[J]. Journal of the Meteorological Sciences, 2017, 37(2): 151-160. |
| [16] |
姜大膀, 田芝平. 末次冰盛期和全新世中期东亚地区水汽输送的模拟研究[J]. 第四纪研究, 2017, 37(5): 999-1008. Jiang Dabang, Tian Zhiping. Last Glacial Maximum and mid-Holocene water vapor transport over East Asia:A modeling study[J]. Quaternary Sciences, 2017, 37(5): 999-1008. |
| [17] |
燕青, 张仲石, 张冉, 等. 过去千年北大西洋热带气旋生成潜势的模拟研究:基于PMIP3气候模式[J]. 第四纪研究, 2017, 37(5): 1141-1150. Yan Qing, Zhang Zhongshi, Zhang Ran, et al. Simulation of tropical cyclone genesis potential over the North Atlantic in the last millennium based on PMIP 3 models[J]. Quaternary Sciences, 2017, 37(5): 1141-1150. |
| [18] |
靳立亚, 陈发虎. 千百年尺度气候快速变化及其数值模拟研究进展[J]. 地球科学进展, 2007, 22(10): 1054-1065. Jin Liya, Chen Fahu. Progress in rapid climate changes and their modeling study in millennial-and centennial scales[J]. Advances in Earth Science, 2007, 22(10): 1054-1065. DOI:10.3321/j.issn:1001-8166.2007.10.010 |
| [19] |
He F. Simulating Transient Climate Evolution of the Last Deglaciation with CCSM3[D]. Wisconsin: The Ph.D Thesis of University of Wisconsin-Madison, 2011: 1-185.
|
| [20] |
Manabe S, Stouffer R J. Study of abrupt climate change by a coupled ocean-atmosphere model[J]. Quaternary Science Reviews, 2000, 19(1): 285-299. |
| [21] |
Renssen H, Goosse H, Fichefet T, et al. The 8.2 kyr B P event simulated by a Global Atmosphere-Sea Ice-Ocean Model[J]. Geophysical Research Letters, 2001, 28(8): 1567-1570. DOI:10.1029/2000GL012602 |
| [22] |
Goosse H, Renssen H, Selten F M, et al. Potential causes of abrupt climate events:A numerical study with a three-dimensional climate model[J]. Geophysical Research Letters, 2002, 29(18): 1-7. |
| [23] |
Renssen H, Goosse H, Fichefet T. Modeling the effect of freshwater pulses on the Early Holocene climate:The influence of high-frequency climate variability[J]. Paleoceanography, 2002, 17(2): 10-11. |
| [24] |
Bauer E, Ganopolski A, Montoya M. Simulation of the cold climate event 8200 years ago by meltwater outburst from Lake Agassiz[J]. Paleoceanography, 2004, 19: PA3014. DOI:10.1029/2004PA001030 |
| [25] |
Wiersma A P, Renssen H. Model-data comparison for the 8.2 ka B P event:Confirmation of a forcing mechanism by catastrophic drainage of Laurentide Lakes[J]. Quaternary Science Reviews, 2006, 25(1-2): 63-88. DOI:10.1016/j.quascirev.2005.07.009 |
| [26] |
Renssen H, Goosse H, Fichefet T. Simulation of Holocene cooling events in a coupled climate model[J]. Quaternary Science Reviews, 2007, 26(15-16): 2019-2029. DOI:10.1016/j.quascirev.2007.07.011 |
| [27] |
Morrill C, Wagner A J, Otto-Bliesner B L, et al. Evidence for significant climate impacts in monsoonal Asia at 8.2 ka from multiple proxies and model simulations[J]. Journal of Earth Environment, 2011, 2(3): 426-441. |
| [28] |
Morrill C, Ward E M, Wagner A J, et al. Large sensitivity to freshwater forcing location in 8.2 ka simulations[J]. Paleoceanography, 2014, 29(10): 930-945. DOI:10.1002/2014PA002669 |
| [29] |
Yan M, Liu J, Ning L. Physical processes of cooling and mega-drought during the 4.2 ka BP event:Results from TraCE-21ka simulations[J]. Climate of the Past, 2018, 15: 265-277. DOI:10.5194/cp-15-265-2019 |
| [30] |
Zhang Y, Renssen H, Seppä H, et al. Holocene temperature trends in the extratropical Northern Hemisphere based on inter-model comparisons[J]. Journal of Quaternary Science, 2018, 33(4): 464-476. DOI:10.1002/jqs.v33.4 |
| [31] |
徐韵, 陈星. 基于中等复杂地球系统模式的全新世气候突变事件模拟试验[J]. 第四纪研究, 2007, 27(3): 392-400. Xu Yun, Chen Xing. Simulation of abrupt climate events in Holocene with an earth-system model of intermediate complexity[J]. Quaternary Sciences, 2007, 27(3): 392-400. DOI:10.3321/j.issn:1001-7410.2007.03.011 |
| [32] |
Ning L, Liu J, Bradley R S, et al. Comparing the spatial patterns of climate change in the 9th and 5th millennia BP from TRACE-21 model simulations[J]. Climate of the Past, 2019, 15(1): 41-52. DOI:10.5194/cp-15-41-2019 |
| [33] |
Collins W D, Bitz C M, Blackmon M L, et al. The community climate system model version 3(CCSM3)[J]. Journal of Climate, 2006, 19(11): 2122-2143. DOI:10.1175/JCLI3761.1 |
| [34] |
Bernstein L, Bosch P, Canziani O, et al. IPCC, 2007:Climate Change 2007:Synthesis Report[M]. Geneva: IPCC, 2008: 1-112.
|
| [35] |
Berger A. Long-term variations of daily insolation and Quaternary climatic changes[J]. Journal of the Atmospheric Sciences, 1978, 35(12): 2362-2367. DOI:10.1175/1520-0469(1978)035<2362:LTVODI>2.0.CO;2 |
| [36] |
Joos F, Spahni R. Rates of change in natural and anthropogenic radiative forcing over the past 20, 000 years[J]. Proceedings of the National Academy of Sciences of the United States of America, 2008, 105(5): 1425-1430. DOI:10.1073/pnas.0707386105 |
| [37] |
Peltier W R. Global glacial isostasy and the surface of the ice-age Earth:The ICE-5 G(VM2)model and GRACE[J]. Annual Review of Earth and Planetary Sciences, 2004, 32: 111-149. DOI:10.1146/annurev.earth.32.082503.144359 |
| [38] |
Liu Z, Otto-Bliesner B L, He F, et al. Transient simulation of last deglaciation with a new mechanism for Bølling-Allerød warming[J]. Science, 2009, 325(5938): 310-314. DOI:10.1126/science.1171041 |
| [39] |
Marcott S A, Clark P U, Padman L, et al. Ice-shelf collapse from subsurface warming as a trigger for Heinrich events[J]. Proceedings of the National Academy of Sciences of the United States of America, 2011, 108(33): 13415-13419. DOI:10.1073/pnas.1104772108 |
| [40] |
Carlson A E, Ullman D J, Anslow F S, et al. Modeling the surface mass-balance response of the Laurentide Ice Sheet to Bølling warming and its contribution to Meltwater Pulse 1 A[J]. Earth and Planetary Science Letters, 2012, 315: 24-29. DOI:10.1016/j.epsl.2011.07.008 |
| [41] |
He F, Shakun J D, Clark P U, et al. Northern Hemisphere forcing of Southern Hemisphere climate during the last deglaciation[J]. Nature, 2013, 494: 81-85. DOI:10.1038/nature11822 |
| [42] |
Liu Z, Lu Z, Wen X, et al. Evolution and forcing mechanisms of El Niño over the past 21, 000 years[J]. Nature, 2014, 515: 550-553. DOI:10.1038/nature13963 |
| [43] |
Liu Z, Zhu J, Rosenthal Y, et al. The Holocene temperature conundrum[J]. Proceedings of the National Academy of Sciences of the United States of America, 2014, 111(34): E3501-E3505. DOI:10.1073/pnas.1407229111 |
| [44] |
Yang H, Zhao Y, Liu Z, et al. Heat Transport compensation in atmosphere and ocean over the past 22, 000 years[J]. Scientific Reports, 2015, 5: 16661. DOI:10.1038/srep16661 |
| [45] |
Liu Y, Zhang M, Liu Z, et al. A possible role of dust in resolving the Holocene temperature conundrum[J]. Scientific Reports, 2018, 8: 4434. DOI:10.1038/s41598-018-22841-5 |
| [46] |
吴海斌, 李琴, 于严严, 等. 全新世中期中国气候格局定量重建[J]. 第四纪研究, 2017, 37(5): 982-998. Wu Haibin, Li Qin, Yu Yanyan, et al. Quantitative climate reconstruction in China during the mid-Holocene[J]. Quaternary Sciences, 2017, 37(5): 982-998. |
| [47] |
Marcott S A, Shakun J D, Clark P U, et al. A reconstruction of regional and global temperature for the past 11, 300 years[J]. Science, 2013, 339(6124): 1198-1201. DOI:10.1126/science.1228026 |
| [48] |
侯光良, 方修琦. 中国全新世气温变化特征[J]. 地理科学进展, 2011, 30(9): 1075-1080. Hou Guangliang, Fang Xiuqi. Characteristics of Holocene temperature change in China[J]. Progress in Geography, 2011, 30(9): 1075-1080. |
| [49] |
Alley R B. The Younger Dryas cold interval as viewed from central Greenland[J]. Quaternary Science Reviews, 2000, 19(1): 213-226. |
| [50] |
Bond G, Kromer B, Beer J, et al. Persistent solar influence on North Atlantic climate during the Holocene[J]. Science, 2001, 294(5549): 2130-2136. DOI:10.1126/science.1065680 |
| [51] |
Viau A E, Gajewski K, Sawada M C, et al. Millennial-scale temperature variations in North America during the Holocene[J]. Journal of Geophysical Research, 2006, 111: D09102. DOI:10.1029/2005JD006031 |
| [52] |
Larocque I, Hall R I. Holocene temperature estimates and Chironomid community composition in the Abisko Valley, Northern Sweden[J]. Quaternary Science Reviews, 2004, 23(23): 2453-2465. |
| [53] |
Marsicek J, Shuman B N, Bartlein P J, et al. Reconciling divergent trends and millennial variations in Holocene temperatures[J]. Nature, 2018, 554: 92-96. DOI:10.1038/nature25464 |
| [54] |
Kitagawa G, Higuchi T, Kondo F N. Smoothness prior approach to explore mean structure in large-scale time series[J]. Theoretical Computer Science, 2003, 292(2): 431-446. DOI:10.1016/S0304-3975(02)00180-9 |
| [55] |
Magny M, Haas J N. A major widespread climatic change around 5300 cal. yr BP at the time of the Alpine Iceman[J]. Journal of Quaternary Science, 2004, 19(5): 423-430. DOI:10.1002/(ISSN)1099-1417 |
| [56] |
Walker M J C, Berkelhammer M, Björck S, et al. Formal subdivision of the Holocene Series/Epoch:A discussion paper by a working group of INTIMATE(Integration of ice-core, marine and terrestrial records)and the subcommission on Quaternary stratigraphy(International Commission on Stratigraphy)[J]. Journal of Quaternary Science, 2012, 27(7): 649-659. DOI:10.1002/jqs.v27.7 |
| [57] |
Clark P U, Webb R S, Keigwin L D. Mechanisms of Global Climate Change at Millennial Time Scales[M]. New York: American Geophysical Union, 1999: 35-38.
|
| [58] |
Nesje A, Matthews J A, Dahl S O, et al. Holocene glacier fluctuations of Flatebreen and winter-precipitation changes in the Jostedalsbreen region, Western Norvay, based on glaciolacustrine sediment records[J]. The Holocene, 2001, 11(3): 267-280. DOI:10.1191/095968301669980885 |
| [59] |
Lamb H H. Climatic History and the Future, vol 2:Climate:Present, Past and Future[M]. London, England: Methuen and Co. Ltd, 1977: 423-473.
|
| [60] |
Hughes M K, Diaz H F. Was there a "Medieval Warm Period", and if so, where and when?[J]. Climatic Change, 1994, 26(2-3): 109-142. DOI:10.1007/BF01092410 |
| [61] |
Stuiver M, Braziunas T F, Grootes P M, et al. Is there evidence for solar forcing of climate in the GISP2 oxygen isotope record?[J]. Quaternary Research, 1997, 48(3): 259-266. DOI:10.1006/qres.1997.1931 |
| [62] |
Broecker W S. Was the Medieval Warm Period global?[J]. Science, 2001, 291(5508): 1497-1499. DOI:10.1126/science.291.5508.1497 |
| [63] |
Jones P D, Osborn T J, Briffa K R. The evolution of climate over the last millennium[J]. Science, 2001, 292(5517): 662-667. DOI:10.1126/science.1059126 |
| [64] |
Soon W, Baliunas S, Idso C, et al. Reconstructing climatic and environmental changes of the past 1000 years:A reappraisal[J]. Energy & Environment, 2003, 14(2-3): 233-296. |
| [65] |
李亮, 马春梅, 鹿化煜, 等. 江西中部玉华山沼泽泥炭记录的过去两千年气候变化初步研究[J]. 第四纪研究, 2017, 37(3): 548-559. Li Liang, Ma Chunmei, Lu Huayu, et al. A preliminary study of the climate change since 2 ka archived by a peat core from Yuhua Mountain in the middle Jiangxi Province[J]. Quaternary Sciences, 2017, 37(3): 548-559. |
| [66] |
李康康, 秦小光, 张磊, 等. 罗布泊(楼兰)地区1260-1450 A.D.期间的绿洲环境和人类活动[J]. 第四纪研究, 2018, 38(3): 720-731. Li Kangkang, Qin Xiaoguang, Zhang Lei, et al. The ancient oasis and human activity in Lop Nur(Loulan)region during 1260-1450 A.D.[J]. Quaternary Sciences, 2018, 38(3): 720-731. |
| [67] |
Jones P D, Mann M E. Climate over past millennia[J]. Reviews of Geophysics, 2004, 42(2): 1-42. |
| [68] |
严蜜, 王志远, 刘健. 中国过去1500年典型暖期气候的模拟研究[J]. 第四纪研究, 2014, 34(6): 1166-1175. Yan Mi, Wang Zhiyuan, Liu Jian. Simulation of the characteristics and mechanisms of Chinese typical warm periods over the past 1500 years[J]. Quaternary Sciences, 2014, 34(6): 1166-1175. |
| [69] |
靳春寒, 刘健, 王志远. 中国中世纪暖期温度年代际变化特征及成因分析[J]. 第四纪研究, 2016, 36(4): 970-982. Jin Chunhan, Liu Jian, Wang Zhiyuan. Study on the characteristics and causes of interdecadal temperature changes in China during the MWP[J]. Quaternary Sciences, 2016, 36(4): 970-982. |
| [70] |
刘斌, 刘健, 王志远. 中世纪暖期南北半球气候变化特征与成因的模拟对比[J]. 地理研究, 2016, 35(9): 1659-1671. Liu Bin, Liu Jian, Wang Zhiyuan. Inter-hemispheric comparison of characteristics and causes of climate change during the Medieval Warm Period based on CESM simulation[J]. Geographical Research, 2016, 35(9): 1659-1671. |
| [71] |
牛蕊, 周立旻, 孟庆浩, 等. 贵州草海南屯泥炭记录的中全新世以来的气候变化[J]. 第四纪研究, 2017, 37(6): 1357-1369. Niu Rui, Zhou Limin, Meng Qinghao, et al. The paleoclimate variations of the Nantun peat in the Caohai area since the Middle Holocene[J]. Quaternary Sciences, 2017, 37(6): 1357-1369. |
| [72] |
Grove J M. The Little Ice Age[M]. London and New York: Methuen, 1988: 1-510.
|
| [73] |
Schlesinger M E, Ramankutty N. An oscillation in the global climate system of period 65-70 years[J]. Nature, 1994, 367: 723-726. DOI:10.1038/367723a0 |
| [74] |
Matero I S O, Gregoire L J, Ivanovic R F, et al. The 8.2 ka cooling event caused by Laurentide ice saddle collapse[J]. Earth and Planetary Science Letters, 2017, 473: 205-214. DOI:10.1016/j.epsl.2017.06.011 |
2 Jiangsu Provincial Key Laboratory for Numerical Simulation of Large Scale Complex Systems/School of Mathematical Science, Nanjing Normal University, Nanjing 210023, Jiangsu;
3 Open Studio for the Simulation of Ocean-Climate-Isotope, Qingdao National Laboratory for Marine Science and Technology, Qingdao 266237, Shandong;
4 State Key Laboratory of Loess and Quaternary Geology, Institute of Earth Environment, Chinese Academy of Sciences, Xi'an 710061, Shaanxi)
Abstract
The climate pattern and cause during the Holocene cold event periods is a hot issue in past climate change research. Transient Climate Evolution of the last 21000 years simulated by the CCSM 3 is used to define and choose the typical cold events in all forcing experiment in the Northern Hemisphere during the Holocene. Magnitudes and the spatial characteristics of temperature and precipitation anomalies in each typical cold event are analyzed. By comparing four external forcings (Orbital Forcing, Atmospheric Greenhouse Gases, Ice Sheets and Paleogeography and Meltwater Forcing) used in all forcing simulation and corresponding 4 single forcing sensitive experiments, causes of cold events are also discussed. The results show that the cold events simulated by TraCE-21ka match well with those found in reconstructions or integrated temperature data sets, TraCE-21ka can reproduce the cold events during Holocene properly. During the Holocene, 10 typical cold events occurred at 9.7 ka B. P., 8.3 ka B. P., 7.3 ka B. P., 6.2 ka B. P., 5.2 ka B. P., 4.2 ka B. P., 3.4 ka B. P., 2.1 ka B. P., 1.0 ka B. P. and 0.2 ka B. P. in the Northern Hemisphere in simulation. Holocene cold event periods are characterized by temperature decrease and precipitation reduction over the Northern Hemisphere, and the temperature decreases significantly in the middle and high latitudes of the Northern Hemisphere while precipitation reduces most around 10°N, the temperature shows distinct latitude-belt distribution characteristics. The spatial characteristics of temperature and precipitation are similar in 8 events from 8.3 ka B. P. to 1.0 ka B. P., with significant decrease in temperature and precipitation from North Atlantic Ocean to the south of Greenland. Cold events at 9.7 ka B. P. and 3.4 ka B. P. may be related to the orbital forcing, Meltwater Forcing caused cold events at 8.3 ka B. P. and 7.3 ka B. P., and cold events at 0.2 ka B. P. may be related to the Atmospheric Greenhouse Gases. The internal variability of the climate system may have some effect on cold events. 2019, Vol.39

