2 加利福尼亚州立大学多明戈兹山分校, 美国 加利福尼亚 90747;
3 Department of Earth Sciences, University of Minnesota, Minneapolis, MN 55455, USA;
4 因斯布鲁克大学地质系, 奥地利 因斯布鲁克 6020)
新仙女木(Younger Dryas,简称YD)事件发生在约12.9~11.7 ka B. P.(B.P.为相对于公元1950年,下同),为末次冰消期气候升温过程中一次剧烈的突变降温事件[1~2]。作为全球性事件,一般认为YD时期北大西洋径向翻转环流(Atlantic Meridional Overturning Circulation,简称AMOC)因大量淡水注入而减弱[3~4],伴随大气、海洋能量的重新分配,北半球高纬温度降低[2],亚洲季风减弱[5~13];而南半球高纬温度升高[14]、南美降水增加[15],季风增强[16]。
相较于两极高纬地区以及亚热带地区,热带地区YD时期各项地质记录呈现多样性与复杂性。以印度洋及其周边地区为例,在YD时期,印度洋呈现北部海表温度降低,南部海表温度升高的特征,其上空的哈德利环流(the Hadley Circulation)的位置和强度也相应地重新调整[17]。在北半球,热带辐合带(Intertropical Convergence Zone,简称ITCZ)作为哈德利环流的上升支,整体显示向南移动[5, 17~18]且在南部停留时间增加[19]。靠近赤道地区,气候变化的复杂性开始显现。Partin等[20]总结印度洋东岸印太暖池地区记录,发现YD时期反映降水的记录有些显示夏季干旱,而有些则无明显变化,仅有一支9°S的石笋记录显示夏季湿润[21~22];反映温度的记录在赤道以北有些显示降温,有些则无明显变化,而赤道以南的记录均显示无明显变化[20]。印度洋西岸东非赤道附近干旱[23~29],而更南部湿润[30~34]。然而,东非热带地区多气候代用指标似乎显示出气候变化或代用指标本身的复杂性。以Malawi湖湖泊钻孔(10°S,34.2°E)为例,研究人员通过重建代用指标生物硅沉积速率(BSi MAR),指出YD时期ITCZ南移至采样点以南,引起Malawi湖北部东北风增强[24],同时另一代用指标叶蜡碳同位素记录支持这一假说并确认此时C4植被盛行,气候干旱[25]。然而同一湖泊的叶蜡氘氢元素比值(δDwax)则显示无显著变化[35],表明水汽传输在这一时期基本没有变化。
尽管东非的多指标气候记录如此复杂,但其与ITCZ的关系一直是气候变化研究的热点问题之一[29~34]。在现代,ITCZ指热带地区水汽辐合上升最为强烈的窄带状区域,这里对流云层深厚,降雨最多[36~37]。在季节尺度上,ITCZ的位置,与南北半球温度梯度有关,偏向于温暖一侧。现代ITCZ的平均位置在印度洋及其周边地区与其在大西洋和太平洋地区有很大不同。不管在冬季还是夏季,ITCZ在大西洋和太平洋地区的位置均位于赤道以北且移动幅度小于10个纬度;而在印度洋地区则不相同,ITCZ的平均位置在6月、7月、8月可达20°N,在12月、1月、2月可南移至8°S[37],在东非马达加斯加地区向南摆动甚至可达10°~15°S[38~39]。在印度洋及其周边地区,ITCZ季节间剧烈的南北移动可跨越近30个纬度,直接深刻影响着非洲、南亚、东亚、东南亚和澳大利亚的气候[38~43]。
虽然东非大陆已有众多记录指示南半球夏季ITCZ的变化,可尚未有来自西南印度洋高分辨率的记录反映ITCZ在海洋上的表现。本文利用位于南半球夏季ITCZ南部边界的罗德里格斯岛洞穴石笋,重建过去13.3 ka B. P.至10.8 ka B. P.西南印度洋的水汽变化历史。利用高分辨、高精度定年的石笋PATA-1氧同位素(δ18O)记录讨论YD时期西南印度洋上的水汽变化特征,通过与印度洋西部、东部和北部的气候记录对比,探索印度洋周边YD事件时期的气候变化规律。
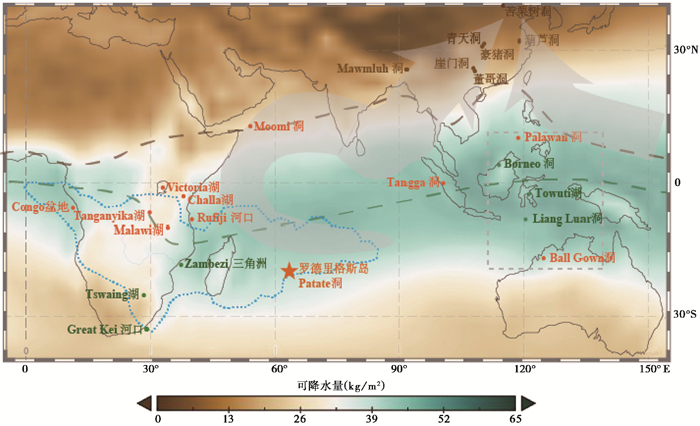
1 研究区域、材料与方法罗德里格斯岛(19°42′ S,63°24′E; 约400 m a.s.l.,以下简称罗岛)是一个面积约为108 km2的火山岛,位于印度洋西南部,东距毛里求斯约600 km,距离东非大陆沿岸约2500 km,是远离大陆深入海洋内部的海岛(图 1)。这里年均降水约为1010 mm,其中68 %的降水来自于湿润季节(11月至次年4月),2月降水最多,8月降水最少。罗岛常年受东风或东南信风控制,但随季节变化水汽来源会略有差异。湿润季节除了来自东(东南)方向的水汽外,还会有部分水汽来自于西北方向;而干旱季节除了来自东(东南)方向的水汽外,还会有部分水汽来自于西南方向[40]。罗岛降水和水汽来源的变化主要受其北部的ITCZ和南部的马斯克林高压控制[40]。2月,ITCZ的南移和马斯克林高压的减弱南退,使得东(南)风减弱并增加了罗岛降水;与此相反,在8月,ITCZ北移和马斯克林高压的增强北进,使得东(南)风增强并抑制了罗岛降水[44]。ITCZ形成的低压槽,在非洲东部也属于季风槽[38~39],其中心区域的南移会使来自西北部的水汽增加,为罗岛带来显著降水[40]。除此之外热带太平洋海气耦合变化,即ENSO也会影响印度洋西岸的降水[45],当热带太平洋处于El Niño态(La Niña态)时,来自罗岛西北部的水汽会异常增加(减少),进而使得罗岛降水增加(减少)[40]。现代水汽路径分析表明, 当ITCZ南移或El Niño事件发生时,在2月异常湿润的年份中(1983年、1992年、1998年、2007年、2010年、2016年)来自西北方向的水汽占2月总水汽通量的比例可达约24 %; 而当ITCZ北移或La Niña事件发生时,在2月异常干旱的年份中(1989年、1997年、1999年、2000年、2006年、2015年)来自西北方向的水汽占2月总水汽通量的比例几乎为0[40]。
|
图 1
YD时期印度洋周边地区古气候记载的干湿气候特征
图中表示1950年至2015年南半球夏季(12月至次年2月)可降水量(kg/m2)分配图(NCEP/NCAR再分析数据,http://www.esrl.noaa.gov/psd/),颜色偏绿(黄)表示可降水量多(少);绿色虚线表示现代南半球夏季ITCZ的位置,褐色虚线表示北半球夏季ITCZ的位置;灰色箭头示意亚洲 夏季风传输路径;蓝色虚线代表南非季风降水区(根据Wang等[39]修改) 灰色矩形虚线边框示意印太暖池记录对比范围;圆点为文中用以对比的记录;棕色点表示YD时期季风减弱,橘黄色点表示气候偏干,墨绿色点表示气候偏湿润;橘色五角星表示罗德里格斯岛 Fig. 1 Synthesisof published paleoclimate data during the YD event surrounding the Indian Ocean basin |
用于本研究的石笋(编号:PATA-1)采集于罗岛西南部的Patate洞穴(19°45′30″S,63°23′11″E;约20 m a.s.l.)。洞穴内部温度约为22.5 ℃,湿度约为95 % (2015年6月采集样品时测量)。样品长约334 mm,宽约95 mm,沿中心生长轴切开并抛光,大部分样品呈白色,半透明状,部分层段混有黄色、暗红色、褐色纹层。本文研究集中于100 mm到169 mm。
本研究样品分析主要包括U-Th年代测定和代用指标δ18O测量。U-Th年代测定在西安交通大学同位素实验室完成。利用直径0.9 mm牙钻在石笋抛光面沿生长轴钻取粉末样用于U-Th定年。该实验主要包含两部分:1)化学分析,分离碳酸盐粉末样品中的U和Th[46];2)上机测试,使用仪器为多接收等离子体电感耦合质谱仪(赛默飞公司,仪器型号:Neptune plus)[47~48]。δ18O测量在奥地利因斯布鲁克大学同位素实验室完成。利用微钻取样仪(New Wave公司,仪器型号:MicroMill)沿石笋生长轴每隔0.1 mm连续采集粉末样(每个约80 μg),共684个样品,通过在线自动进样装置(Gasbench Ⅱ)和同位素质谱仪(DeltaPlusXL)联机测试[49~50]。结果以δ18O(‰,VPDB)表示,计算公式为δ18O=[(18O/16O样品)/(18O/16O标准)-1]×1000,分析误差(±1σ)优于0.1 ‰。
2 结果 2.1 年龄模型本文共获得19个高精度U-Th年龄(表 1),结果显示该样品铀含量较低(约150×10-9g/g),但较为纯净(232Th均值< 300×10-12g/g),整体测年误差(±2σ)约为90 a,所有年龄在误差范围内均符合生长层序,只有134.5 mm处的年龄偏离年龄模型拟合中值较远。
| 表 1 罗岛Patate洞石笋PATA-1的230Th定年结果(所有误差均为2 σ) Table 1 230Th dating results of stalagmite in Rodrigues Island (The error is 2σ error) |
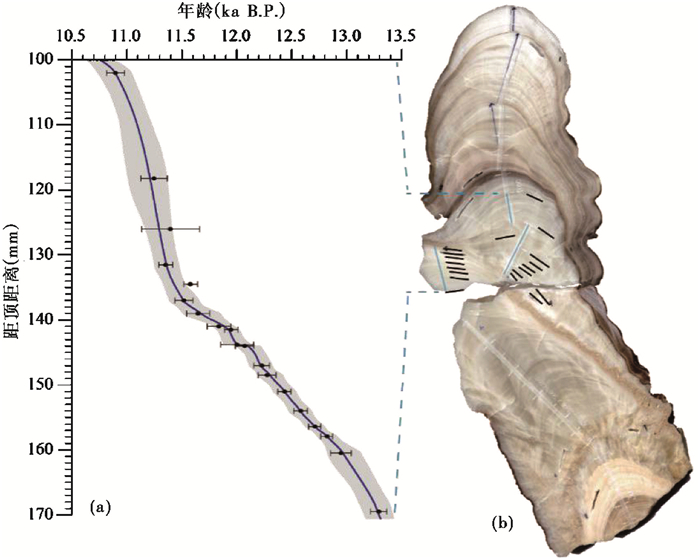
169~100 mm样品研究范围内可见沉积纹层,整体呈现乳白色,浅黄色条纹接连,在样品150 mm处存在显著黄色条带,样品生长轴发生显著偏移,但测年结果显示无间断。利用COPRA(Constructing Proxy Records from Ages)[52]建立年代模型(图 2)。从169 mm到137 mm,样品生长时段为13.3 ka B. P.到11.5 ka B. P.,生长较为缓慢,平均生长速率为0.02 mm/a;从137 mm到100 mm,样品生长时段为11.5 ka B. P.到10.8 ka B. P.,生长较快,平均生长速率为0.05 mm/a。
|
图 2 PATA-1的年龄模型以及样品扫描图 (a)利用COPRA[52]建立的年龄模型结果,其中蓝线表示模型结果中心值,灰色条带表示模型2σ误差范围,黑色圆点和误差棒表示定年点和2σ误差;(b)样品扫描图,图中浅蓝色条带表明本文所报道氧同位素采集处,样品上黑色条带为U-Th年龄采样点,共19个 Fig. 2 Age model and sample image of stalagmite PATA-1 (a) Age model (blue line) reconstructed by COPRA[52] with 2σ error indicated by the grey envelope. The U-Th ages are shown by black error bars(2σ). (b) The image of stalagmite PATA-1. Light bluelines indicate tracks for milking δ18O subsamples. Black bars show 19 U-Th dating sample positions |
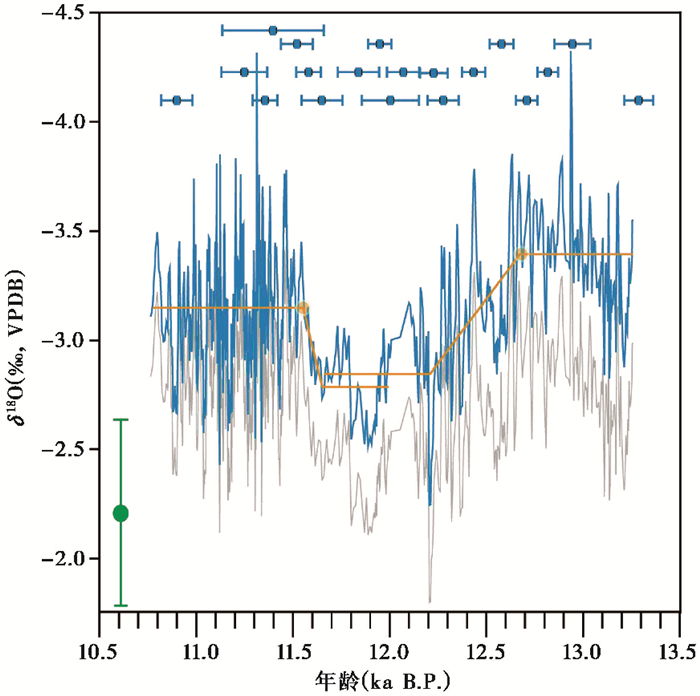
石笋PATA-1的氧同位素分析共获得684个数据,根据该石笋的年龄模型重建了10.8~13.3 ka B. P.的氧同位素古气候记录,平均分辨率为3.7 a(图 3中灰线)。该石笋6.1~3.3 ka B. P.时段的碳氧同位素记录与另一根来自罗岛邻近La Vierge洞穴(19°45′26″S,63°22′13″E;约32 m a.s.l.)的同时段石笋LAVI-4记录已发表[40]。虽然在罗岛尚未有YD时段的其他石笋记录可做重复性检验,但PATA-1和LAVI-4在6.0~3.4 ka B. P.之间的高度一致性[40]表明PATA-1的δ18O处于或接近平衡分馏,受动力学分馏影响小,可以反映降水的氧同位素(δ18Op)变化。罗岛石笋δ18O初始信号来源于海水,其波动变化受全球冰量影响。所谓冰量效应是指全球海水δ18O受两极冰盖扩张与收缩影响,在冰期-间冰期尺度上存在循环波动变化,在冰期(间冰期)时,海水δ18O偏正(偏负)。为去除冰量效应影响,本文利用Spratt等[53]的研究结果(海平面每上升100 m,海水δ18O下降0.82 ‰),预估海水δ18O的校正范围从13 ka B. P.的0.54 ‰近似线性变化为10 ka B. P.的0.20 ‰。将测量的石笋δ18O值减去对应时段海水δ18O校正值得到冰量校正后的石笋δ18O值,其结果为图 3中蓝线所示,后文讨论都基于冰量校正后的石笋δ18O值。
|
图 3 PATA-1的氧同位素记录及定年点 灰线为原始δ18O记录,蓝线为冰量效应校正后的δ18O记录,黄线为拐点分析结果;蓝色圆点和误差棒表示定年点和2σ误差;绿色圆点及误差棒表示石笋PATA-1在6.1~3.3 ka B. P.时段δ18O的均值及1σ Fig. 3 The δ18O record of PATA-1 and dating points The original δ18O record is in the grey line. The ice volume corrected δ18O record is in the blue line. The analyses of inflection points are indicated by yellow lines and dots. Blue error bars(2σ)show 19 U-Th dating results. The mean value and 1σ variation of δ18O values between 6.1 ka B. P. and 3.3 ka B. P. in the PATA-1record is shown by the green error bar |
从13.3 ka B. P.到10.8 ka B. P.,罗岛石笋δ18O均值为-3.14 ‰。利用Rampfit[54]检测序列中发生突变的位置,结果显示:从13.3 ka B. P.到12.6 ka B. P.,石笋δ18O显示逐渐偏负的趋势,均值为-3.40 ‰ (图 3),平均生长速率为0.022 mm/a;从12.6 ka B. P.到11.5 ka B. P.,平均生长速率为0.016 mm/a。突变分析显示,在此期间石笋δ18O呈谷状结构,从约12.68 ka B. P.开始,δ18O振荡幅度增大,经过约470年,δ18O在12.21 ka B. P.达到极大值(-2.2 ‰),此后在均值-2.8 ‰上下剧烈波动。δ18O在11.89 ka B. P.达到最大值(-2.51 ‰)后开始呈现阶梯式偏负变化,经过约100年的变化于11.79 ka B. P.达到极小值后,进入δ18O显示略微偏正趋势的平台期,持续约260年。之后从11.65 ka B. P.经过约100年于11.55 ka B. P.达到稳定。从11.5 ka B. P.到10.8 ka B. P.,石笋平均生长速率为0.047 mm/a,石笋δ18O在-3.15 ‰附近高频振荡。石笋生长速率受洞穴温度、滴水中钙离子浓度、二氧化碳分压、洞穴上层储水层厚度等多种因素影响。实验表明当温度升高、钙离子浓度增大、储水层厚度增加时,石笋的生长速率均会增加[55]。在热带地区有限的温度变化下,YD时期与全新世早期生长速率的剧烈差异可能和与降水量紧密相关的洞穴上层储水层厚度有关[56]。降水多,储水层较厚,使得罗岛石笋生长快速;相反,降水少,储水层变薄,使得罗岛石笋生长减缓。
3 讨论 3.1 罗岛石笋氧同位素的气候意义现代观测显示罗岛及其周边区域的降水量与δ18Op的关系呈现明显的季节性特征:雨季降水多δ18Op偏负,旱季降水少δ18Op偏正。模拟结果在年际和年代际尺度证实降水与δ18Op同样表现出显著的,类似“雨量效应”的特点,即降水增多时δ18Op偏负[40]。Li等[40]发现当南半球夏季ITCZ位置偏南或者热带太平洋处于El Niño态时,会有更多来自西北方向的水汽,使得罗岛降水偏多、δ18Op偏负;当南半球夏季ITCZ位置偏北或者热带太平洋处于La Niña态时,来自西北方向的水汽减少,罗岛降水偏少、δ18Op偏正。综上,我们推测罗岛石笋氧同位素继承大气降水δ18Op信息,反映降水变化,与局地或更大尺度水气环流变化相关。
3.2 YD时期罗岛水汽变化历史在13.3~10.8 ka B. P.期间,PATA-1石笋δ18O显示出多十年-百年尺度振荡,整体没有明显长期趋势。在该时段,经过冰量校正后石笋PATA-1的δ18O值远低于其在全新世6.1~3.3 ka B. P.的波动范围(-2.21 ±0.43 ‰,1σ)(图 3),这表明相对于中全新世,罗岛在13.3~10.8 ka B. P.的降水更多。一般认为,相对于温暖的全新世,南半球夏季ITCZ的位置在仍然寒冷的冰消期较为偏南[18]。也就是说,这一时段ITCZ南移,可能使得罗岛更为接近南半球夏季ITCZ中心区域,从而导致更为丰沛的降水。
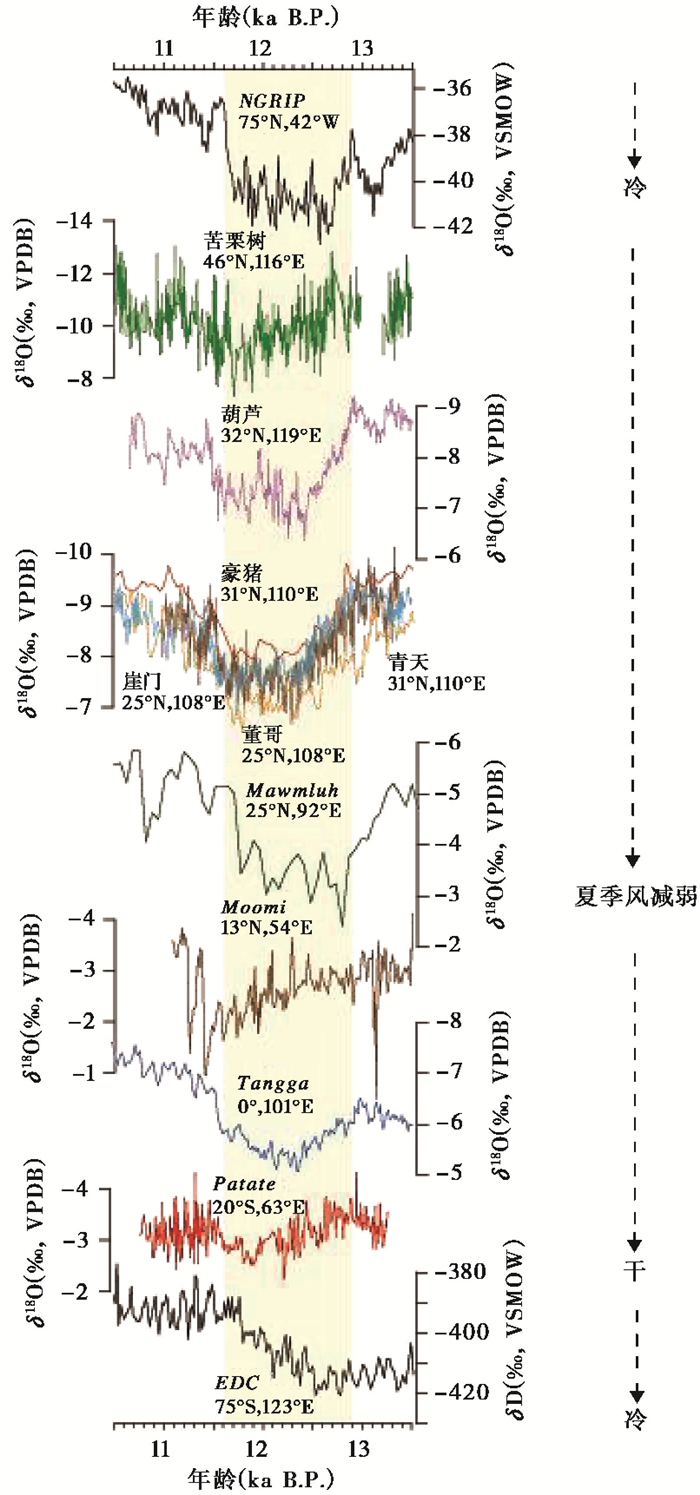
然而若将视线聚焦于更短时间尺度,在12.6~11.5 ka B. P.期间,石笋δ18O相较两侧时段呈现偏重的“谷状”结构,显示气候略微偏干。这一时期对应北半球YD事件,格陵兰冰芯记录显示YD事件的起始和结束时间为约12.9 ka B. P.和约11.7 ka B. P.[2]。如果以PATA-1石笋δ18O的突变点为标准来判断YD事件对西南印度洋气候变化的影响,则YD事件在罗岛记录中持续的时间长度似乎短于其在北极冰芯记录中的时长。按照ITCZ趋于向更为温暖的半球移动,北极冰芯记录显示YD时期温度突然降低,而南极冰芯记录显示缓慢逐步增温(图 4),在“北推南拉”的状态下,千年尺度上ITCZ理应继续南移。现代气象资料显示当ITCZ南移时,罗岛降水增加,δ18Op偏负[40],那么为何在YD时期,ITCZ南移,罗岛的氧同位素值不降反升,显示相对干旱的气候状态呢?为探讨这一问题,我们收集了印度洋北部、东部和西部的多点地质记录,意图了解YD时期气候的时空变化规律,进而理解气候变化过程和机制。
|
图 4
罗岛石笋δ18O与两极冰芯以及与亚洲夏季风沿线石笋记录对比图
从上至下依次为:格陵兰冰芯δ18O记录[1]、苦栗树洞[57]、葫芦洞[58~59]、豪猪洞[60](橘色)、青天洞[61~62](褐色)、董哥洞[63](黄色)、崖门洞[64](蓝色)、Mawmluh洞[9]、Moomi洞[10]、Tangga洞[65]和Patate洞(本研究);δD记录来自于南极冰芯EDC[14];黄色条带覆盖YD时期,右侧箭头指示对应指标的含义 图中所有石笋记录均按文中所述进行了冰量校正 Fig. 4 Rodriguesδ18O record compared with other paleoclimate records From top to bottom: Greenland ice core δ18O record (NGRIP)[1]; speleothem δ18O records from Kulishu Cave[57], Hulu Cave[58~59], Haozhu Cave[60] (orange), Qingtian Cave[61~62] (brown), Dongge Cave[63] (yellow), Yamen Cave[64] (blue), Mawmluh Cave[9], Moomi Cave[10], Tangge Cave[65]and Patate Cave(this study); δD record from ice core EDC, Antarctic[14]. Yellow bar marks the YD event with arrows at the right indicating record interpretations. All stalagmite δ18O records are ice volume correctedbased on the method described in the text |
与冰芯记录缓慢进入(约240 a)、快速退出(约100 a)的特征[1~2]相似,罗岛YD时期的气候也表现缓慢进入(约470 a),快速退出(约100 a)的特征(图 3和图 4)。这一特征与多条来自北半球亚热带及热带地区石笋记录相一致,例如:中国区域的北京苦栗树洞[57]、南京葫芦洞[58~59]、湖北豪猪洞[60]、湖北青天洞[61~62]、贵州董哥洞[63]和贵州崖门洞[64],印度的Mawmluh洞[9]、也门索科特拉岛Moomi洞[10]以及印尼Tangga洞[65](图 4)。这一对比结果与之前认知的北半球亚洲夏季风减弱南半球南美季风增强[16]所呈现的跷跷板效应不同,位于亚洲季风起源区[66]的南半球罗岛石笋记录与同样受亚洲季风影响的北半球石笋记录[9~10, 57~65]在YD事件中表现相似,反映出同一气候系统在千年尺度气候事件,至少在YD事件中,南北半球的某种一致性。
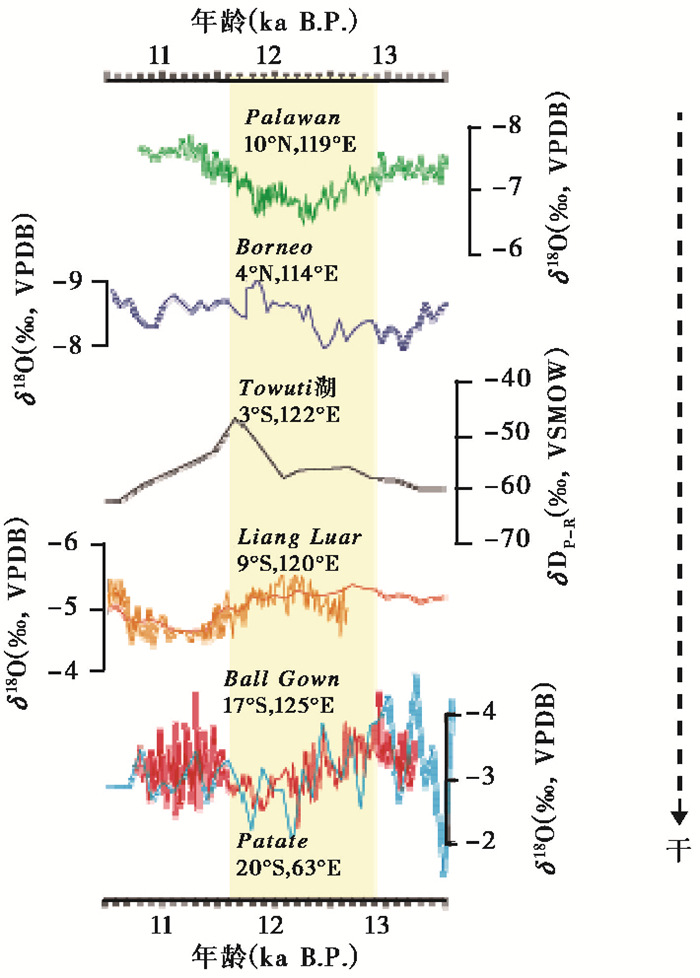
印太暖池地区,YD时期气候变化呈现多样性[20]。本文选择印太暖池地区受亚洲夏季风影响较小且位于陆表的几个典型洞穴和湖泊记录[20-22, 67-69]进行对比(范围覆盖10°N~18°S,110°~140°E) (图 1和图 5)。罗岛石笋记录与菲律宾Palawan洞石笋记录[20]在YD时期缓进缓出的特征不同,与澳大利亚Ball Gown洞穴石笋δ18O记录[67]相似,三者在YD时期均表现为降水减少。而在Palawan洞穴和Ball Gown洞穴之间的Borneo洞穴[68]、Towuti湖记录[69]以及更南部的Liang Luar洞穴[21~22]则显示降水增加十分微弱或印尼-澳大利亚夏季风略微增强。在印太暖池研究区域内罗岛气候特征与其边缘地区气候变化有相似之处,而与赤道附近的不同。
|
图 5
罗岛石笋δ18O与印度洋东岸印太暖池(10°N~18°S,110°~140°E)典型记录对比图
从上至下依次为:δ18O记录来自于Palawan洞穴[20]和Borneo洞穴[68],δDP-R记录来自于Towuti湖[69],δ18O记录来自于Liang Luar洞穴[21~22]、Ball Gown洞[67]和Patate洞(本研究);黄色条带覆盖YD时期,右侧箭头指示对应指标的含义 图中所有石笋记录均按文中所述进行了冰量校正 Fig. 5 Rodriguesδ18O record compared with YD records from the Indo-Pacific warming pool (10°N~18°S, 110°~140°E) From top to bottom: Speleothem δ18O records from Palawan Cave[20] and Borneo Cave[68]; δDP-R record from Lake Towuti[69]; Speleothem δ18O records from Liang Luar Cave[21~22], Ball Gown Cave[67] and Patate Cave(this study). Yellow bar marks the YD event. Arrow at the right side shows record interpretations. All stalagmite δ18O records are ice volume corrected based on the method described in the text |
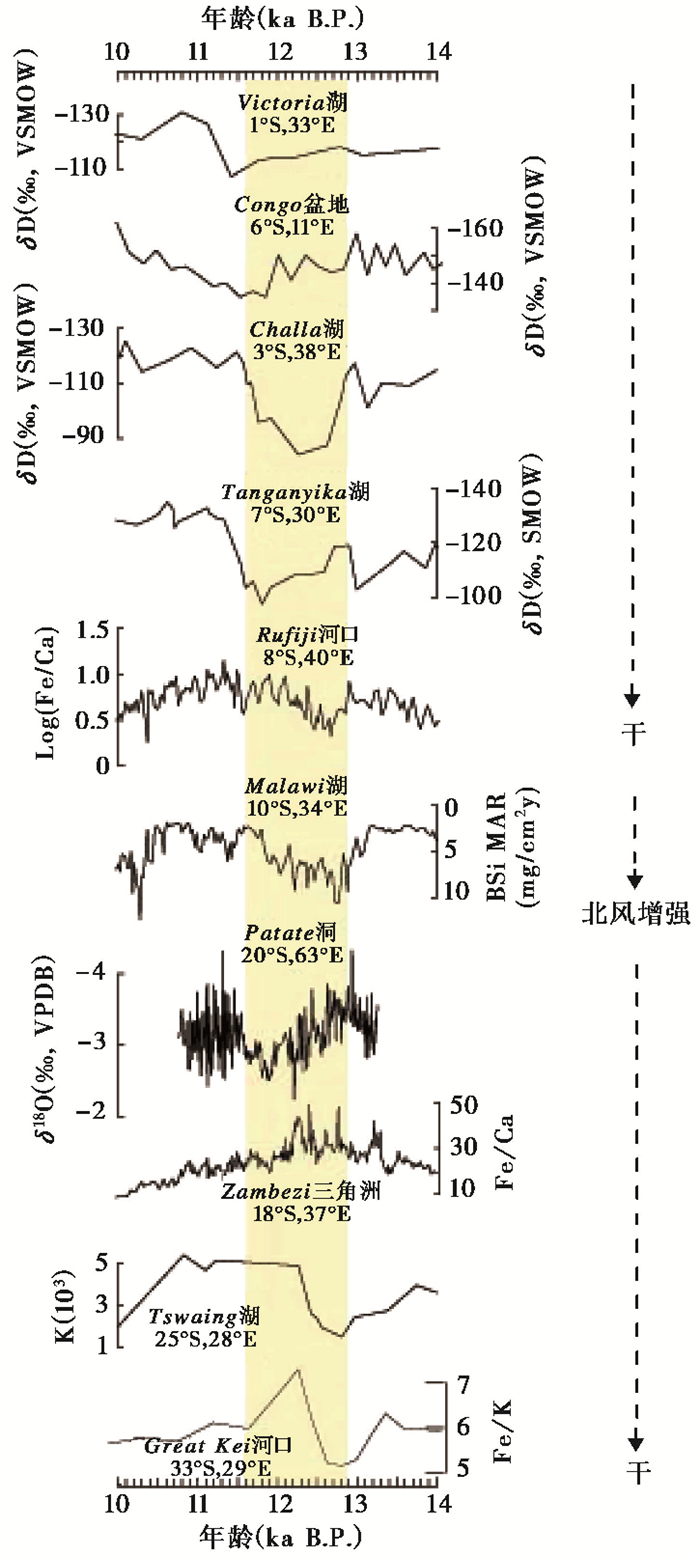
YD时期,通过对比罗岛石笋δ18O记录与东非热带地区以及非洲东南部亚热带的气候记录,整体上可以发现,罗岛显示出与热带地区一致的相对干旱特征,例如:0°~10°S的多个钻孔记录:Victoria湖[28]、Challa湖[27]、Congo盆地[70]、Tanganyika湖[26]和Rufiji河口[29]的记录均指示降水减少;而与亚热带地区的气候特征不同,例如:Zambezi三角洲[32]、Tswaing湖记录[30]和Great Kei河口沉积记录[71](图 6)显示气候湿润。众多研究者认为YD时期,ITCZ南移造成东非赤道附近干旱而更南部湿润[23~34, 70~71]。按照这一思路,如果认为ITCZ南移同样造成了罗岛气候干旱,则ITCZ需要南移至罗岛以南。根据现代气候特征(https://trmm.gsfc.nasa.gov/trmm_rain/Events/trmm_climatology_3B43.html),南半球夏季ITCZ中心在印度洋上的位置约为约9°S,若使其南移至20°S,则ITCZ需跨越11°。这样的极端状态可能发生吗?实际上这种极端情况产生的可能性并不高。如需满足如此剧烈的经向跨幅需要南北半球间产生巨大的能量差异。有研究指出全球ITCZ的经向平均移动范围在末次冰盛期和Heinrich Stadial 1不足1°,在满足这一条件的前提下,若区域ITCZ产生超过5°的经向移动,则其他位置的ITCZ将基本保持不动[72]。这意味着,如果南半球夏季ITCZ在南印度洋南移11°,则其他区域的ITCZ将维持初始位置甚至向北移动以保持平衡。而根据众多印度洋北部记录显示ITCZ南移的结果来看[5, 18~19]二者是矛盾的。因此,南半球夏季ITCZ南移至罗岛以南的假说很难取得大气物理学方面的支持,也就不能够成为解释罗岛YD相对干旱的机制。
|
图 6
罗岛石笋δ18O与非洲东部、东南部记录比较图
从上之下依次为:δD记录来自于Victoria湖[28]、Congo盆地[70]、Challa湖[27]、Tanganyika湖[26];Rufiji河口的Log(Fe/Ca)记录[29];Malawi湖的Bsi MAR记录[24];Patate洞穴的δ18O记录(本研究);Zambezi三角洲Fe/Ca记录[32];Tswaing湖K含量记录[30]和GreatKei河口沉积Fe/K记录[71] 黄色条带覆盖YD时期,箭头指示对应指标的含义 Rodriguesδ18O record compared with those from East and Southeast Africa. From top to bottom: δD records from Lake Victoria[28], Congo Basin[70], Lake Challa[27], Lake Tanganyika[26]; Log (Fe/Ca) record from mouth of Rufiji River[29]; Bsi MAR record from Lake Malawi[24]; Speleothem record from Patate Cave (this study); Fe/Carecord from Zambezi Delta[32]; K content record from Lake Tswaing[30] and Fe/Krecord from mouth of Great Kei River[71]. Yellow bar marks the YD event. Arrows at the right sideshow record interpretations |
通过对比罗岛石笋δ18O记录与印度洋北部、东部和西部的记录,我们试图利用罗岛石笋氧同位素记录,来探讨YD时期在ITCZ的影响下西南印度洋的气候变化及可能机制。来自印度洋西岸的记录报道,YD时期,南半球夏季ITCZ南移是导致东非呈现赤道附近干旱,非洲东南部湿润的原因[23~34](图 6);印度洋东岸印太暖池Liang Luar洞穴记录[21~22]报道认为YD时期南半球夏季ITCZ南移是引起印度尼西亚Flores降雨略微增加的原因,而其更南部的Ball Gown洞穴未显示湿润[67],推测ITCZ可能恰好停留在两个洞穴之间[65]。这一系列证据都指出YD时期,南半球夏季ITCZ南移,而上文的讨论又表明ITCZ不可能南移至罗岛以南。那么YD时期,南半球夏季ITCZ南移,而罗岛降水减少,产生这种现象的另一种可能解释为ITCZ对流强度减弱,使得由ITCZ南移产生的影响远不及其强度减弱的变化,从而导致罗岛降水减少。
在众多对比记录中尤其引人注意的是位于印太暖池西部边缘的苏门答腊岛Tangga洞穴(0°,110°E)[65]的石笋δ18O记录,它反映年际雨量变化,主要受东印度洋大气对流活动影响,同时也与多种水汽源有关。虽然亚洲夏季风对苏门答腊年降水量的影响不到25 % [65],但Tangga石笋δ18O记录与罗岛石笋δ18O记录相似,YD时期都表现出与北半球众多反映亚洲季风强度的石笋δ18O记录一致的“缓进快出”特征。通过总结印度洋东部、西部以及北部的记录,Wurtzel等[65]认为YD时期ITCZ南移,但是对流强度减弱,使得影响Tangga洞穴的南、北半球夏季风路径上的水汽传输同时减弱或者不变,是造成Tangga石笋δ18O记录与亚洲夏季风石笋记录相似的原因。
从罗岛石笋δ18O记录与亚洲季风区石笋记录特征相似的对比结果来看,罗岛石笋支持Wurtzel等[65]的猜想。但不同于Tangga洞穴在一年内受ITCZ南北迁移影响两次且掺杂南北半球共同的水汽传输信号[65],位于南半球夏季ITCZ南部边缘的罗岛石笋δ18O记录了纯粹的南半球水汽信号,从南半球角度证实YD时期,南半球夏季ITCZ南移,但对流强度减弱,罗岛降水减少,亚洲季风从源头至末端都呈现水汽传输减弱的现象。
4 结论利用西南印度洋罗岛石笋δ18O记录,我们重建了过去13.3~10.8 ka B. P.的气候记录。罗岛石笋δ18O反映降水δ18O的变化,在年际尺度表现出“雨量效应”,与ITCZ或ENSO等大尺度水汽环流变化有关。在研究时段内,重点描述了YD事件期间罗岛石笋δ18O的变化特征,同时与南北极冰芯记录、印度洋北部、东部和西部记录进行对比,研究了YD时期,在ITCZ影响下西南印度洋水汽变化历史。主要结果如下:
(1) YD时期,罗岛石笋δ18O展示出“缓进快出”偏重的不对称谷状结构,与北极格陵兰冰芯和亚洲夏季风石笋δ18O记录展现出相似的特征。
(2) 在13.3~10.8 ka B. P.时段内,与印太暖池(10°N~18°S,110°~140°E)典型记录对比,发现南印度洋西部的罗岛石笋记录与南印度洋东岸的澳大利亚北部石笋δ18O记录同步变化。虽然与北部Palawan石笋δ18O缓进缓出的特征不同,但是二者均显示YD时期变干。罗岛石笋δ18O记录与赤道附近记录则表现不同。
(3) 与非洲东部和东南部记录对比,YD时期罗岛石笋记录与热带地区记录表现一致,均显示相对干旱,而与东南部相对湿润的气候特征不同。
(4) 可能机理:YD时期,南半球夏季ITCZ南移,但罗岛石笋δ18O仍显示与北半球相似的偏重谷状结构。可能原因是,ITCZ强度减弱造成了西南印度洋降水减少,即使ITCZ南移也未能为罗岛带来更加充沛的降水。罗岛与北半球热带、亚热带地区多根石笋δ18O记录的相似性,显示亚洲季风从上游至下游整条路径上的水汽传输都减弱了。这一发现支持Wurtzel等[65]的猜想。
致谢: 感谢毛里求斯罗德里格斯岛弗朗西斯巨型陆龟和洞穴保护中心的Aurèle Anquetil André和Arnaud Meunier提供的野外支持和帮助;感谢印度国家洞穴研究和保护中心的Jayant Biswas提供野外工作的帮助;感谢云南大学资源环境与地球科学学院曹杰教授、文大勇研究生对现代气象基础知识的讲解;感谢评审老师和编辑部赵淑君老师和杨美芳老师对本文提出的宝贵修改意见。
| [1] |
Rasmussen S O, Andersen K K, Svensson A M, et al. A new Greenland ice core chronology for the last glacial termination[J]. Journal of Geophysical Research: Atmospheres, 2006, 111: D06102. DOI:10.1029/2005JD006079 |
| [2] |
Rasmussen S O, Bigler M, Blockley S P, et al. A stratigraphic framework for abrupt climatic changes during the Last Glacial period based on three synchronized Greenland ice-core records: Refining and extending the INTIMATE event stratigraphy[J]. Quaternary Science Reviews, 2014, 106: 14-28. DOI:10.1016/j.quascirev.2014.09.007 |
| [3] |
Broecker W S, Peteet D M, Rind D. Does the ocean-atmosphere system have more than one stable mode of operation?[J]. Nature, 1985, 315(6014): 21-26. DOI:10.1038/315021a0 |
| [4] |
Mcmanus J F, Francois R, Gherardi J M, et al. Collapse and rapid resumption of Atlantic meridional circulation linked to deglacial climate changes[J]. Nature, 2004, 428(6985): 834-837. DOI:10.1038/nature02494 |
| [5] |
Zhang H, Griffiths M L, Chiang J C H, et al. East Asian hydroclimate modulated by the position of the westerlies during Termination Ⅰ[J]. Science, 2018, 362(6414): 580-583. DOI:10.1126/science.aat9393 |
| [6] |
Cheng H, Edwards R L, Southon J, et al. Atmospheric14C/12C changes during the last glacial period from Hulu Cave[J]. Science, 2018, 362(6420): 1293-1297. DOI:10.1126/science.aau0747 |
| [7] |
Cheng H, Edwards R L, Sinha A, et al. The Asian monsoon over the past 640, 000 years and ice age terminations[J]. Nature, 2016, 534(7609): 640-646. DOI:10.1038/nature18591 |
| [8] |
Cheng H, Edwards R L, Broecker W S, et al. Ice age terminations[J]. Science, 2009, 326(5950): 248-252. DOI:10.1126/science.1177840 |
| [9] |
Dutt S, Gupta A K, Clemens S C, et al. Abrupt changes in Indian summer monsoon strength during 33, 800 to 5500 years B. P.[J]. Geophysical Research Letters, 2015, 42(13): 5526-5532. DOI:10.1002/2015GL064015 |
| [10] |
Shakun J D, Burns S J, Fleitmann D, et al. A high-resolution, absolute-dated deglacial speleothem record of Indian Ocean climate from Socotra Island, Yemen[J]. Earth and Planetary Science Letters, 2007, 259(3-4): 442-456. DOI:10.1016/j.epsl.2007.05.004 |
| [11] |
Tierney J E, Pausata F S R, Demenocal P. Deglacial Indian monsoon failure and North Atlantic stadials linked by Indian Ocean surface cooling[J]. Nature Geoscience, 2016, 9(1): 46-50. DOI:10.1038/ngeo2603 |
| [12] |
Deplazes G, Lückge A, Peterson L C, et al. Links between tropical rainfall and North Atlantic climate during the last glacial period[J]. Nature Geoscience, 2013, 6(3): 213-217. DOI:10.1038/ngeo1712 |
| [13] |
Kathayat G, Cheng H, Sinha A, et al. Indian monsoon variability on millennial-orbital timescales[J]. Scientific Reports, 2016, 6: 24374. DOI:10.1038/srep24374 |
| [14] |
Jouzel J, Masson-Delmotte V, Cattani O, et al. Orbital and millennial Antarctic climate variability over the past 800, 000 years[J]. Science, 2007, 317(5839): 793-796. DOI:10.1126/science.1141038 |
| [15] |
Baker P A, Seltzer G O, Fritz S C, et al. The history of South American tropical precipitation for the past 25, 000 years[J]. Science, 2001, 291(5504): 640-643. DOI:10.1126/science.291.5504.640 |
| [16] |
Wang X, Auler A S, Edwards R L, et al. Millennial-scale precipitation changes in southern Brazil over the past 90, 000 years[J]. Geophysical Research Letters, 2007, 34(23): L23701. |
| [17] |
Mohtadi M, Prange M, Oppo D W, et al. North Atlantic forcing of tropical Indian Ocean climate[J]. Nature, 2014, 509(7498): 76-80. DOI:10.1038/nature13196 |
| [18] |
Chiang J C H, Bitz C M. Influence of high latitude ice cover on the marine Intertropical Convergence Zone[J]. Climate Dynamics, 2005, 25(5): 477-496. DOI:10.1007/s00382-005-0040-5 |
| [19] |
Wang L, Jiang W Y, Jiang D B, et al. Prolonged heavy snowfall during the Younger Dryas[J]. Journal of Geophysical Research: Atmospheres, 2018, 123(24): 13748-13762. DOI:10.1029/2018JD029271 |
| [20] |
Partin J W, Quinn T M, Shen C C, et al. Gradual onset and recovery of the Younger Dryas abrupt climate event in the tropics[J]. Nature Communications, 2015, 6: 8061. DOI:10.1038/ncomms9061 |
| [21] |
Ayliffe L K, Gagan M K, Zhao J, et al. Rapid interhemispheric climate links via the Australasian monsoon during the last deglaciation[J]. Nature Communications, 2013, 4: 2908. DOI:10.1038/ncomms3908 |
| [22] |
Griffiths M L, Drysdale R N, Gagan M K, et al. Increasing Australian-Indonesian monsoon rainfall linked to Early Holocene sea-level rise[J]. Nature Geoscience, 2009, 2(9): 636-639. DOI:10.1038/ngeo605 |
| [23] |
Gasse F. Hydrological changes in the African tropics since the Last Glacial Maximum[J]. Quaternary Science Reviews, 2000, 19(1-5): 189-211. DOI:10.1016/S0277-3791(99)00061-X |
| [24] |
Johnson T C, Brown E T, McManus J, et al. A high-resolution paleoclimate record spanning the past 25, 000 years in Southern East Africa[J]. Science, 2002, 296(5565): 113-132. DOI:10.1126/science.1070057 |
| [25] |
Castañeda I S, Werne J P, Johnson T C. Wet and arid phases in the southeast African tropics since the Last Glacial Maximum[J]. Geology, 2007, 35(9): 823-826. DOI:10.1130/G23916A.1 |
| [26] |
Tierney J E, Russell J M, Huang Y, et al. Northern Hemisphere controls on tropical Southeast African climate during the past 60, 000 years[J]. Science, 2008, 322(5899): 252-255. DOI:10.1126/science.1160485 |
| [27] |
Tierney J E, Russell J M, Sinninghe Damsté J S, et al. Late Quaternary behavior of the East African monsoon and the importance of the Congo Air Boundary[J]. Quaternary Science Reviews, 2011, 30(7): 798-807. |
| [28] |
Berke M A, Johnson T C, Werne J P, et al. Molecular records of climate variability and vegetation response since the Late Pleistocene in the Lake Victoria basin, East Africa[J]. Quaternary Science Reviews, 2012, 55: 59-74. DOI:10.1016/j.quascirev.2012.08.014 |
| [29] |
Liu X, Rendle-Bühring R, Henrich R. High-and low-latitude forcing of the East African climate since the LGM:Inferred from the elemental composition of marine sediments off Tanzania[J]. Quaternary Science Reviews, 2018, 196: 124-136. DOI:10.1016/j.quascirev.2018.08.004 |
| [30] |
Kristen I, Fuhrmann A, Thorpe J, et al. Hydrological changes in Southern Africa over the last 200 ka as recorded in lake sediments from the Tswaing impact crater[J]. South African Journal of Geology, 2007, 110(2-3): 311-326. DOI:10.2113/gssajg.110.2-3.311 |
| [31] |
Gasse F, Chalié F, Vincens A, et al. Climatic patterns in equatorial and Southern Africa from 30, 000 to 10, 000 years ago reconstructed from terrestrial and near-shore proxy data[J]. Quaternary Science Reviews, 2008, 27(25): 2316-2340. |
| [32] |
Schefuß E, Kuhlmann H, Mollenhauer G, et al. Forcing of wet phases in Southeast Africa over the past 17, 000 years[J]. Nature, 2011, 408: 509-512. DOI:10.1038/nature10685 |
| [33] |
van der Lubbe J J L, Tjallingii R, Prins M A, et al. Sedimentation patterns off the Zambezi River over the last 20, 000years[J]. Marine Geology, 2014, 355: 189-201. DOI:10.1016/j.margeo.2014.05.012 |
| [34] |
Baker A, Routh J, Roychoudhury A N. Biomarker records of palaeoenvironmental variations in subtropical Southern Africa since the late Pleistocene:Evidences from a coastal peatland[J]. Palaeogeography, Palaeoclimatology, Palaeoecology, 2016, 451: 1-12. DOI:10.1016/j.palaeo.2016.03.011 |
| [35] |
Konecky B L, Russell J M, Johnson T C, et al. Atmospheric circulation patterns during Late Pleistocene climate changes at Lake Malawi, Africa[J]. Earth and Planetary Science Letters, 2011, 312(3-4): 318-326. DOI:10.1016/j.epsl.2011.10.020 |
| [36] |
Frierson D M W, Hwang Y T, Fu kar N S, et al. Contribution of ocean overturning circulation to tropical rainfall peak in the Northern Hemisphere[J]. Nature Geoscience, 2013, 6(11): 940-944. DOI:10.1038/ngeo1987 |
| [37] |
Schneider T, Bischoff T, Haug G H. Migrations and dynamics of the intertropical convergence zone[J]. Nature, 2014, 513(7516): 45-53. DOI:10.1038/nature13636 |
| [38] |
Wang P X, Wang B, Cheng H, et al. The global monsoon across timescales:Coherent variability of regional monsoons[J]. Climate of the Past, 2014, 10(6): 2007-2052. DOI:10.5194/cp-10-2007-2014 |
| [39] |
Wang P X, Wang B, Cheng H, et al. The global monsoon across time scales:Mechanisms and outstanding issues[J]. Earth-Science Reviews, 2017, 174: 84-121. DOI:10.1016/j.earscirev.2017.07.006 |
| [40] |
Li H, Cheng H, Sinha A, et al. Hydro-climatic variability in the Southwestern Indian Ocean between 6000 and 3000 years ago[J]. Climate of the Past, 2018, 14(12): 1881-1891. DOI:10.5194/cp-14-1881-2018 |
| [41] |
王志远, 王江林, 张诗茄, 等. 不同时间尺度影响下的北半球夏季风空间特征及其可能影响机制[J]. 第四纪研究, 2018, 38(6): 1494-1506. Wang Zhiyuan, Wang Jianglin, Zhang Shijia, et al. Impact of different timescales on the characteristics and mechanisms of the Northern Hemisphere Summer Monsoon:Based on the CESM results[J]. Quaternary Sciences, 2018, 38(6): 1494-1506. |
| [42] |
胡超涌, 汪颖钊, 刘浴辉, 等. 9.6-6.0 ka B. P.阿曼降水重建及其与中国南方降水的对比[J]. 第四纪研究, 2016, 36(3): 581-586. Hu Chaoyong, Wang Yingzhao, Liu Yuhui, et al. Rainfall reconstruction from Oman during 9.6-6.0 ka B. P. and its comparison with that from Southwest China[J]. Quaternary Sciences, 2016, 36(3): 581-586. |
| [43] |
蒋文静, 赵侃, 陈仕涛, 等. 小冰期十年际尺度亚洲季风变化的四川黑竹沟洞石笋记录[J]. 第四纪研究, 2017, 37(1): 118-129. Jiang Wenjing, Zhao Kan, Chen Shitao, et al. Decadal climate oscillations during the Little Ice Age of stalagmite record from Heizhugou Cave, Sichuan[J]. Quaternary Sciences, 2017, 37(1): 118-129. |
| [44] |
崔锦, 杨修群, 张爱忠. 马斯克林高压的变化特征[J]. 气象科技, 2008, 36(1): 35-42. Cui Jin, Yang Xiuqun, Zhang Aizhong. Characteristics of Mascarene High variation[J]. Meteorological Science and Technology, 2008, 36(1): 35-42. |
| [45] |
Cai W, Wu L, Lengaigne M, et al. Pantropical climate interactions[J]. Science, 2019, 363(6430): eaav 4236. DOI:10.1126/science.aav4236 |
| [46] |
Edwards R L, Chen J H, Wasserburg G J. 238U-234U-230Th-232Th systematics and the precise measurement of time over the past 500000 years[J]. Earth and Planetary Science Letters, 1987, 81(2): 175-192. |
| [47] |
Cheng H, Edwards R L, Hoff J, et al. The half-lives of uranium-234 and thorium-230[J]. Chemical Geology, 2000, 169(1): 17-33. |
| [48] |
Cheng H, Edwards R L, Shen C C, et al. Improvements in 230Th dating, 230Th and 234U half-life values, and U-Th isotopic measurements by multi-collector inductively coupled plasma mass spectrometry[J]. Earth and Planetary Science Letters, 2013, 371-372: 82-91. DOI:10.1016/j.epsl.2013.04.006 |
| [49] |
Spötl C. Long-term performance of the Gasbench isotope ratio mass spectrometry system for the stable isotope analysis of carbonate microsamples[J]. Rapid Communications in Mass Spectrometry, 2011, 25(11): 1683-1685. DOI:10.1002/rcm.5037 |
| [50] |
Spötl C, Vennemann T W. Continuous-flow isotope ratio mass spectrometric analysis of carbonate minerals[J]. Rapid Communications in Mass Spectrometry, 2003, 17(9): 1004-1006. DOI:10.1002/rcm.v17:9 |
| [51] |
Jaffey A H, Flynn K F, Glendenin L E, et al. Precision measurement of half-lives and specific activities of 235U and 238U[J]. Physical Review C, 1971, 4(5): 1889. DOI:10.1103/PhysRevC.4.1889 |
| [52] |
Breitenbach S F M, Rehfeld K, Goswami B, et al. COnstructing Proxy-Record Age models(COPRA)[J]. Climate of the Past, 2012, 8(5): 1765-1779. DOI:10.5194/cp-8-1765-2012 |
| [53] |
Spratt R M, Lisiecki L E. A Late Pleistocene sea level stack[J]. Climate of the Past, 2016, 12(4): 1079-1092. DOI:10.5194/cp-12-1079-2016 |
| [54] |
Mudelsee M. Ramp function regression:A tool for quantifying climate transitions[J]. Computers & Geosciences, 2000, 26(3): 293-307. |
| [55] |
Dreybrodt W. Chemical kinetics, speleothem growth and climate[J]. Boreas, 1999, 28(3): 347-356. DOI:10.1080/030094899422073 |
| [56] |
Kelly M J, Edwards R L, Cheng H, et al. High resolution characterization of the Asian Monsoon between 146, 000 and 99, 000 years BP from Dongge Cave, China and global correlation of events surrounding Termination Ⅱ[J]. Palaeogeography, Palaeoclimatology, Palaeoecology, 2006, 236(1-2): 20-38. DOI:10.1016/j.palaeo.2005.11.042 |
| [57] |
Ma Z B, Cheng H, Tan M, et al. Timing and structure of the Younger Dryas event in Northern China[J]. Quaternary Science Reviews, 2012, 41: 83-93. DOI:10.1016/j.quascirev.2012.03.006 |
| [58] |
Wu J Y, Wang Y J, Cheng H, et al. An exceptionally strengthened East Asian summer monsoon event between 19.9 and 17.1 ka BP recorded in a Hulu stalagmite[J]. Science in China (Series D:Earth Sciences), 2009, 52(3): 360-368. DOI:10.1007/s11430-009-0031-1 |
| [59] |
Southon J, Noronha A L, Cheng H, et al. A high-resolution record of atmospheric14C based on Hulu Cave speleothem H82[J]. Quaternary Science Reviews, 2012, 33: 32-41. DOI:10.1016/j.quascirev.2011.11.022 |
| [60] |
Zhang H, Griffiths M L, Huang J, et al. Antarctic link with East Asian summer monsoon variability during the Heinrich Stadial-Bølling interstadial transition[J]. Earth and Planetary Science Letters, 2016, 453: 243-251. DOI:10.1016/j.epsl.2016.08.008 |
| [61] |
Liu D, Wang Y, Cheng H, et al. Centennial-scale Asian monsoon variability during the mid-Younger Dryas from Qingtian Cave, Central China[J]. Quaternary Research, 2013, 80(2): 199-206. DOI:10.1016/j.yqres.2013.06.009 |
| [62] |
王权, 刘殿兵, 汪永进, 等. 湖北神农架年纹层石笋记录的YD与8.2 ka事件转型模式研究[J]. 沉积学报, 2015, 33(6): 1140-1148. Wang Quan, Liu Dianbing, Wang Yongjin, et al. Transitional patterns of YD and 8.2 ka event recorded by annually-laminated stalagmites from Qingtian Cave, Mt. Shennongjia[J]. Acta Sedimentologica Sinica, 2015, 33(6): 1140-1148. |
| [63] |
Dykoski C A, Edwards R L, Cheng H, et al. A high-resolution, absolute-dated Holocene and deglacial Asian monsoon record from Dongge Cave, China[J]. Earth and Planetary Science Letters, 2005, 233(1-2): 71-86. DOI:10.1016/j.epsl.2005.01.036 |
| [64] |
Yang Y, Yuan D X, Cheng H, et al. Precise dating of abrupt shifts in the Asian Monsoon during the last deglaciation based on stalagmite data from Yamen Cave, Guizhou Province, China[J]. Science China:Earth Sciences, 2010, 53(5): 633-641. DOI:10.1007/s11430-010-0025-z |
| [65] |
Wurtzel J B, Abram N J, Lewis S C, et al. Tropical Indo-Pacific hydroclimate response to North Atlantic forcing during the last deglaciation as recorded by a speleothem from Sumatra, Indonesia[J]. Earth and Planetary Science Letters, 2018, 492: 264-278. DOI:10.1016/j.epsl.2018.04.001 |
| [66] |
An Zhisheng, Clemens S C, Shen J, et al. Glacial-interglacial Indian summer monsoon dynamics[J]. Science, 2011, 333(6043): 719-723. DOI:10.1126/science.1203752 |
| [67] |
Denniston R F, Wyrwoll K H, Asmerom Y, et al. North Atlantic forcing of millennial-scale Indo-Australian monsoon dynamics during the Last Glacial period[J]. Quaternary Science Reviews, 2013, 72: 159-168. DOI:10.1016/j.quascirev.2013.04.012 |
| [68] |
Partin J W, Cobb K M, Adkins J F, et al. Millennial-scale trends in west Pacific warm pool hydrology since the Last Glacial Maximum[J]. Nature, 2007, 449(7161): 452-455. DOI:10.1038/nature06164 |
| [69] |
Konecky B, Russell J, Bijaksana S. Glacial aridity in central Indonesia coeval with intensified monsoon circulation[J]. Earth and Planetary Science Letters, 2016, 437: 15-24. DOI:10.1016/j.epsl.2015.12.037 |
| [70] |
Schefuß E, Schouten S, Schneider R R. Climatic controls on central African hydrology during the past 20, 000years[J]. Nature, 2005, 437(7061): 1003-1006. DOI:10.1038/nature03945 |
| [71] |
Ziegler M, Simon M H, Hall I R, et al. Development of Middle Stone Age innovation linked to rapid climate change[J]. Nature Communications, 2013, 4: 1905. DOI:10.1038/ncomms2897 |
| [72] |
Mcgee D, Donohoe A, Marshall J, et al. Changes in ITCZ location and cross-equatorial heat transport at the Last Glacial Maximum, Heinrich Stadial 1, and the mid-Holocene[J]. Earth and Planetary Science Letters, 2014, 390: 69-79. DOI:10.1016/j.epsl.2013.12.043 |
2 Department of Earth Science, California State University Dominguez Hills, California 90747, USA;
3 Department of Earth Sciences, University of Minnesota, Minneapolis, MN 55455, USA;
4 Institute of Geology, University of Innsbruck, Innsbruck 6020, Austria)
Abstract
The Younger Dryas (YD) event is an abrupt cooling event in the Northern Hemisphere occurred during the last deglaciation, which is triggered likely by fresh water injecting into the North Atlantic Ocean, resulting slowdown of the Atlantic Meridional Overturning Circulation (AMOC) and southward shift Intertropical Convergence Zone (ITCZ). While a large number of YD records have been reconstructed from Northern Hemisphere, the YD records from Southern Hemisphere remain sporadic, especially in southwestern Indian Ocean. This impeded our understanding about climate variations across the YD event to a global extent. Here, we present a high-resolution and precisely dated speleothem (PATA-1) oxygen isotope (δ18O) record from Patate Cave (19°45'30"S, 63°23'11"E; ca. 20 m a.s.l.) in Rodrigues Island, southwestern subtropical Indian Ocean. The sample is pure calcite around 334 mm long and 95 mm wide with clear yellow, white, dark red or brown layers. The length between 100~169 mm was selected to study, covering the time period from ca. 13.3 ka to 10.8 ka ago, including the YD event. We obtained 19 U-Th dates and 684 δ18O data, which allows a high-resolution (ca. 3.7 a) reconstruction of a new speleothem δ18O record to characterize the hydroclimate variability across the YD event in the southwestern subtropical Indian Ocean. Our analyses show that the PATA-1δ18O record reflects mainly changes in the precipitation amount resulting from local to large scale atmospheric circulations, including ITCZ shift and El Niño -Southern Oscillation (ENSO).The YD variation in the PATA-1 record is characterized by a heavier (or drier) excursion with a gradual onset and a rapid termination, similar to Greenland ice core δ18O records and speleothem δ18O records from vast Asian summer monsoon regions. In eastern coast of the Indian Ocean, the existing records also show a drier condition during the YD event, such as the stalagmite records from Palawan and Ball Gown caves located respectively in the northern and southern edges of the Indo-Pacific warming pool (IPWP, defined between 10°N~18°S and 110°~140°E). However, the records near the equator in the IPWP show different climate change during the YD event compared with our PATA-1 record. Along west coast of the Indian Ocean, the climate show a pattern of "dry in north and wet in south" from equatorial eastern Africa to subtropical southern Africa. The hydroclimate variations during the YD event inferred from the PATA-1 record in Rodrigues are in line with the records near equatorial eastern Africa. Although the hypothesis of a ITCZ shift farther south across Rodrigues may explain the drier YD condition observed in our record, it requires a ITCZ shift of more than 11° to south from its modern position, which appears to be difficult in terms of atmospheric physics. Alternatively, a weakened ITCZ intensity and thus its convective activity during the YD event may explain the drier YD condition in Rodrigues, as well as along the Asian summer monsoon pathway in both hemispheres. 2019, Vol.39

