2 Department of Earth Sciences, University of Minnesota, Minneapolis, MN 55455, USA;
3 中国科学院地球环境研究所, 黄土与第四纪地质国家重点实验室, 陕西 西安 710061;
4 中国科学院大学, 北京 100049;
5 西安交通大学, 机械制造系统工程国家重点实验室, 陕西 西安 710054)
末次冰期时段的众多气候记录[1~8]揭示出大幅度的气候振荡贯穿了整个冰期[9~10],包括相对温暖的间冰阶和相对寒冷的冰阶的交替,以及6次著名的冰漂碎屑事件(Heinrich事件,简称H事件)[1, 11]。
末次冰盛期是末次冰期中十分关键的气候时期,是距今最近的极寒冷时期[12]。Heinrich 2事件(H2事件)是发生于末次冰盛期的一次突然变冷的事件。一般认为,此期间北半球冰盖不稳定,大量的冰水进入北大西洋[13],淡水的输入造成表层海水盐度降低,使得北大西洋径向翻转环流(Atlantic Meridional Overturning Circulation,简称AMOC)减弱[13~15],热带辐合带(Intertropical Convergence Zone,简称ITCZ)南移[16~18],减少了大洋水汽向亚洲大陆的运移[16, 18~19]。同时,北半球高纬温度降低的信号通过西风带和蒙古冷高压传递到亚洲季风(包括印度和东亚季风)区[5],亚洲夏季风减弱[6, 8, 20~22]。
H2事件在亚洲季风区的多个不同地质记录中均有所表现。印度季风区阿拉伯海的深海沉积记录和模拟结果均显示H2事件期间印度夏季风减弱[6, 20~21],印度地区已发表的石笋记录中,仅Mawmluh洞[23]和Bittoo洞[24]记录涵盖了H2事件,其中Mawmluh洞[23]石笋氧同位素(δ18O)记录显示H2事件期间印度夏季风减弱。印度夏季风和东亚夏季风过渡区的小白龙洞[25]、羊口洞[26]、三星洞[19]和雾露洞[27~28]和七星洞[29]的石笋δ18O记录也在此时段偏正,指示亚洲夏季风减弱[19, 25~28]。东亚季风区葫芦洞的石笋记录首次揭示了东亚季风区在H2事件期间与北大西洋气候事件的关联[8],永兴洞[30]、天鹅洞[31]、万象洞[32]、金滩湾洞[33]、龙洞[34]和仙云洞[35]等又进一步揭示了东亚季风区H2事件的幅度和结构可能存在的区域差异。但是,这些记录由于定年误差较大,定年点较少,而且缺少石笋年纹层计数支持,限制了对H2事件内部结构的细致分析以及同南北极高分辨率记录的精细对比。
本文选取印度季风区乞拉朋齐洞具有年纹层的石笋CHE-2对H2事件结束时段进行深入研究。实验共获得259个氧同位素数据和21个高精度的U- Th年代,结合2701条纹层计数结果,建立了25.50~24.76 ka B. P.(B. P.表示Before Present,Present为公元1950年)和24.38~22.42 ka B. P.时段(99.5~437.0 mm样品段)高精度的石笋δ18O时间序列。这一新记录揭示了印度东北部地区H2事件的结束过程和精细结构,标定了H2事件结束过程持续的时间。本研究在南北极冰芯记录和亚洲季风区石笋记录对比的基础上,分析H2事件的内部细节,进一步探讨事件的触发机制。
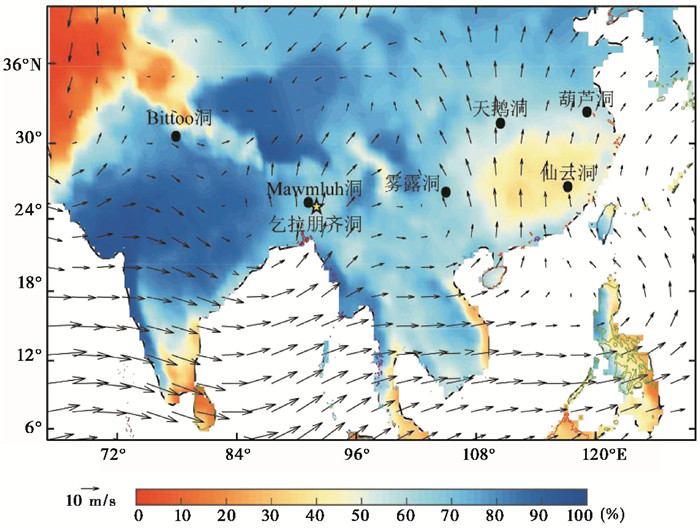
1 研究区域和石笋样品乞拉朋齐洞(Cherrapunji Cave,25°11′59″N,92°27′11″E;海拔约1100 m)位于印度东北部梅加拉亚高原南部边缘的“世界雨极”乞拉朋齐,该区年平均降水量约为11000 mm,年平均温度19 ℃。受印度夏季风影响,该地区6月至9月的降水量占比超过年降水量的70%[36~37](图 1)。乞拉朋齐地区印度夏季风期间的降水主要受对流系统、孟加拉湾的低空气团和地形控制[38~39]。
|
图 1 有关洞穴的地理位置以及6~9月平均降水(1981~2010年)全年占比的空间变化和低空风场图 风矢量(黑色箭头)和降水(色彩刻度)数据来源于现代和再分析研究与应用(MERRA)和全球降水气候中心(GPCC);黄色五角星表示乞拉朋齐洞位置,黑色圆点表示文中涉及的其他洞穴的位置 Fig. 1 Map showing the cave locations, spatial variations of mean JJAS precipitation percentage, and low-level wind vectors. June-July-August-September(JJAS)wind vectors(black arrows)and mean precipitation percentages(in color scale)are based data(1981~2010)from the Modern Era Retrospective-Analysis for Research and Applications(MERRA)and the Global Precipitation Climatology Centre(GPCC). The locations of Cherrapunji Cave(yellow star)and other cave records(black circles)mentioned in the article are shown in the map |
用于本研究的石笋CHE-2呈长柱状(总长940 mm),采样时断为三段。沿石笋生长轴切割抛光后,顶部两段为0~277 mm样品段和277~609 mm样品段,本研究集中于99.5~437.0 mm样品段(25.50~24.76 ka B. P.和24.38~22.42 ka B. P.)(图 2)。尽管该石笋在329.5~329.7 mm处存在一处间断,但涵盖了大部分H2事件,特别是事件结束的整个过程。

|
图 2 石笋CHE-2顶部两个样品段的抛光面扫描图 (a)样品CHE-2位于0~277 mm样品段的扫描图像,(b)样品CHE-2位于277~609 mm样品段的扫描图像;水平的白色线段示意U-Th年代采样点位置,黑色箭头和数字表示相应采样点的U-Th年龄及其2σ误差(表 1) Fig. 2 Scan image of the top two sections of stalagmite CHE-2. (a) Scan image of stalagmite CHE-2 section between 0~277 mm; (b) Scan image of stalagmite CHE-2 section between 277~609 mm. The white horizontal bars indicate positions of subsamples for U-Th dating. Data labels show the U-Th dates and 2σ errors(Table 1)from the corresponding positions indicated by the black arrows |
本文利用U-Th定年方法测定石笋的绝对年代。利用牙钻和直径0.3 mm的钻头在石笋抛光表面共采集了21个粉末样用于测定年龄,平均采样量约25 mg。U-Th定年实验在西安交通大学同位素实验室完成,分析仪器为美国赛默飞公司生产的多接收电感耦合等离子体质谱仪(MC-ICP- MS,仪器型号:Neptune Plus)。化学分析方法参照Edwards等[40]的研究,仪器分析方法参照Cheng等[41~42]的研究。报告的年龄误差为2σ(表 1)。
| 表 1 石笋CHE-2的U-Th定年及年纹层计数结果 Table 1 U-Th dating and annual lamination counting results for stalagmite CHE-2 |
通过石笋年纹层的计数,可以获得可靠的相对年代[43],将此相对年代与U-Th绝对年代结合,可建立高精度的年代标尺重建古气候记录的精细变化[44~49],揭示古气候事件的内部细节及转型特征[50]。邓朝等[50]使用透射显微镜得到石笋纹层图像;汪永进等科研团队[51~54]使用Olympus岩相显微镜得到石笋纹层图像;程海等科研团队[47, 55~57]使用激光扫描共聚焦显微镜(Laser Scanning Confocal Microscope,简称LSCM)观察石笋年纹层,与普通荧光显微镜相比,LSCM具有更高的分辨率,在很多情况下可实现10 μm级荧光纹层的清晰辨别[57]。
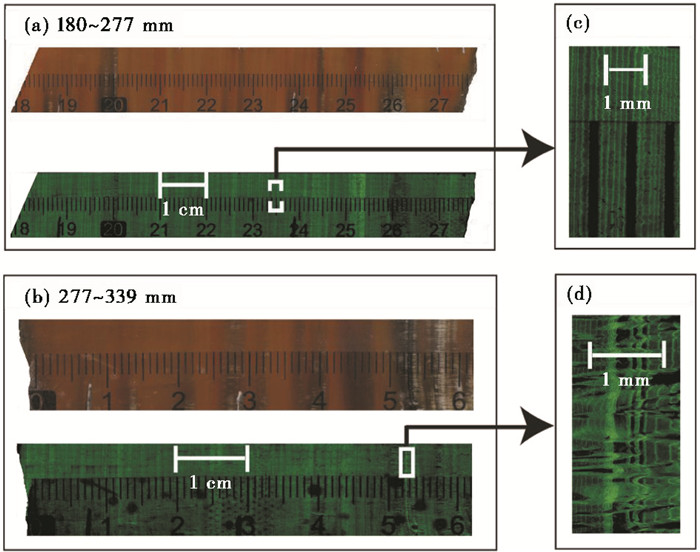
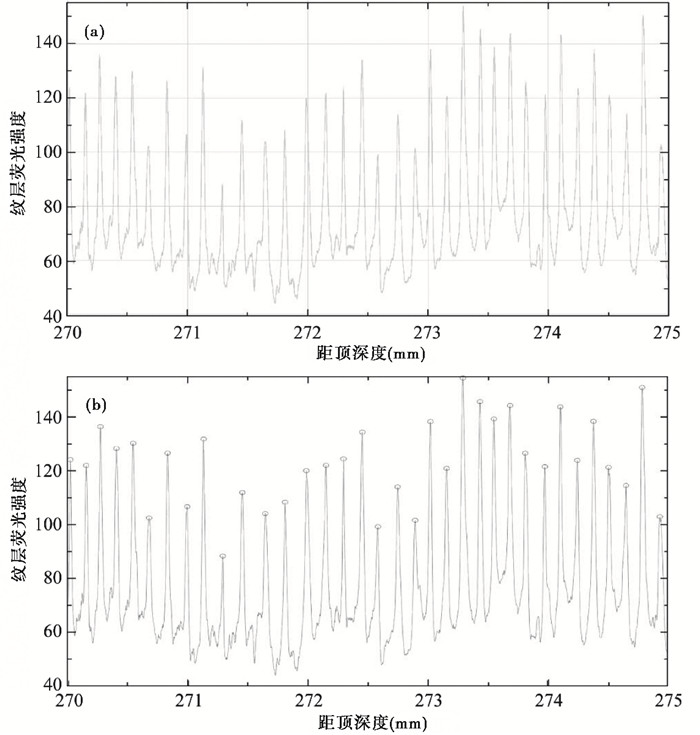
将石笋表面抛光后,在西安交通大学机械制造系统工程国家重点实验室,利用LSCM(型号:Nikon,A1)扫描石笋CHE-2的99.5~437.0 mm样品段,该段样品的纹层清晰分明。部分层段的扫描结果如图 3所示,其中明暗纹层交替出现,可能表示石笋生长的年纹层,329.5~329.7 mm的间断及其附近的扫描图像如图 3d所示。所有图像均在512×512扫描分辨率下,利用波长为488 nm的蓝色激光器激发,发射出波长为500~550 nm的绿色光,最后经检测器扫描成像[57]。本文使用ImageJ软件处理扫描图像,结合MATLAB软件,在定量计数的同时,精确测量各荧光纹层厚度(图 4和5)。与纯人工计数[46, 56]相比,此方法更为便捷,纹层厚度值也更为精确,本次工作所获得的乞拉朋齐洞石笋CHE-2,研究区段纹层厚度累积值与真实长度值的差异小于2‰。可重复的数学标准保证了计数结果的客观性,同时也提高了纹层计数的效率。对于纹层较为密集的区域,人工计数时会产生视觉混淆或人眼疲劳,易受主观因素干扰,ImageJ软件将所需的纹层信息以图形曲线的峰、谷显示,经过MATLAB软件的处理,可以快速实现计数算法的交互式优化。
|
图 3 荧光纹层 (a)石笋CHE-2位于180~277 mm段的荧光纹层图像,白色矩形框表示荧光纹层放大图像(c)的位置;(b)石笋CHE-2位于277~339 mm段的荧光纹层图像,白色矩形框表示荧光纹层放大图像(d)的位置 Fig. 3 Images of fluorescent laminae. (a)Image of fluorescent laminae in the CHE-2 section between 180 mm and 277 mm. The white box indicates the location of the enlarged image in (c). (b) and (d) are the same as (a) and (c) but for the sample section between 277 mm and 339 mm |
|
图 4 石笋样品CHE-2位于270~275 mm段的纹层荧光强度图 (a)“ImageJ”软件生成的石笋样品CHE-2位于270~275 mm段的纹层荧光强度图;(b)“MATLAB”标定的相应的荧光强度极大值(灰圈) Fig. 4 Images of fluorescent intensity from the stalagmite CHE-2 section between 270 mm and 275 mm. (a)Fluorescent intensity image obtained using "ImageJ" from the stalagmite CHE-2 section between 270 mm and 275 mm; (b)Fluorescent intensity maxima(gray circles)selected by "MATLAB" |
|
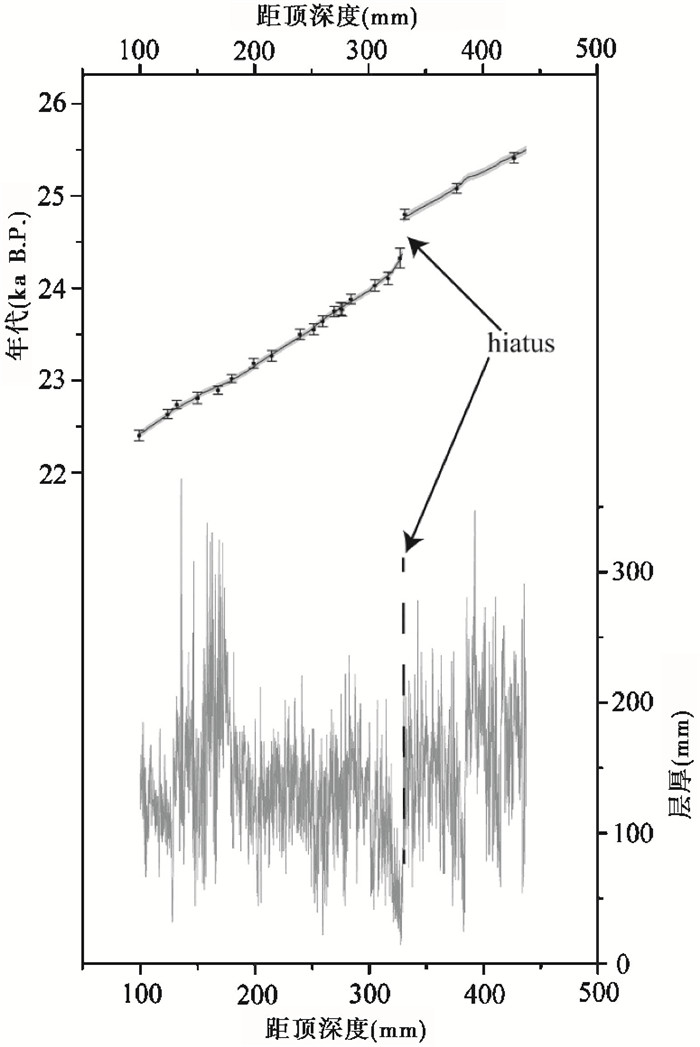
图 5 石笋CHE-2的年龄模型和年纹层厚度 图形上部表示年代模型的结果,灰色条带表示年龄模型的误差范围,黑色圆点和误差棒表示定年结果和2σ误差;图形下部表示年纹层厚度的结果,箭头指示的区域存在生长间断 Fig. 5 Age model and annual band thickness of stalagmite CHE-2. The top of this image indicates the result of age model, the error is in grey shaded area. The U-Th ages are in black dots with 2σ error bars(vertical bars). The bottom of this image indicates the thickness of annual laminae. There is a hiatus in the area indicated by the black arrow |
最小二乘法[45]可用于匹配U-Th定年结果和荧光年纹层计数结果,并建立高精度的年代模型。最终年代模型中的误差主要有两个来源:1)荧光年纹层计数误差(记为LC);2)将纹层计数结果锚定到U-Th定年结果带来的误差(记为A)。Domínguez-Villar等[45]详细描述了将纹层计数结果(相对年代)锚定到U-Th年代(绝对年代)的方法,组合误差主要通过公式(1)确定。

|
(1) |
本文共进行了3次纹层计数:两次通过软件计数得到纹层总数及各纹层厚度;另一次采用人工计数,仅得到纹层总数。为尽可能减小计数误差,使用三次计数的均值作为最终结果。
2.3 稳定同位素测量沿石笋生长中轴线使用牙钻和直径0.3 mm的钻头采样,部分层段以1 mm(距顶190~260 mm和距顶277~320 mm)和0.5 mm(距顶261~276 mm和距顶321~332 mm)为平均间隔,其余层段以2 mm为平均间隔,共获得259个石笋粉末样品用于氧同位素分析,采用与Kiel Ⅳ碳酸盐自动进样设备联用的Thermal Scientific MAT 253气体同位素比值质谱仪,在西安交通大学同位素实验室测试完成。每13个样品加一个国际标准样品,测试结果的报告为相对于国际标准Vienna Pee Dee Belemnite(VPDB)的偏差,以氧同位素为例,其计算公式为δ18O=[(18O/16O样品)/(18O/16OVPDB)-1]×1000,分析误差(± 1σ)优于0.1‰。
3 结果 3.1 年龄模型本文共获得21个高精度U-Th年代数据(表 1和图 2)。定年结果显示石笋样品CHE-2的铀含量较高(238U为1280~2450 ng/g),且较为纯净(232Th为220~6200 pg/g),整体测年误差为60年,只有327.5 mm处误差略大。该石笋的U-Th定年结果在误差范围内与石笋的荧光纹层计数结果相吻合(表 1),这说明石笋CHE-2的荧光纹层确为年纹层[43]。样品于329.5~329.7 mm存在沉积间断,间断分界面两侧颜色有别(图 2和图 3b),间断时长约为380年。
本文使用LSCM(型号:Nikon,A1)扫描石笋CHE-2样品99.5 mm至437.0 mm的抛光表面,并对间断上部(99.5~329.5 mm)和间断下部(329.7~437.0 mm)分别进行纹层计数,共2701层,间断上部计1957层,间断下部计744层。石笋CHE-2样品99.5 mm至437.0 mm的各年纹层厚度如图 5所示,其中321 mm至329 mm样品段纹层较密集,平均纹层厚度小于40 μm,其余样品段纹层厚度较大(50~350 μm之间)。年纹层厚度曲线分辨率为年际,显著高于本研究所获得的氧同位素记录的分辨率,谭明等[43, 49, 59]研究表明,对纹层厚度的应用需谨慎,并非所有发育了年层的石笋都能将纹层厚度用于古气候重建,需要进行沉积趋势校正和必要的洞穴监测等。胡尊语等[60]指出,石笋纹层厚度等替代指标的气候解释仍存在较大不确定性。因此,本文对层厚信息可能指代的气候意义暂不作进一步讨论。
使用最小二乘法[45],将石笋CHE-2纹层计数的结果与U-Th定年结果拟合,建立高精度的年代模型(图 5),99.5~329.5 mm样品段(24.38~22.42 ka B. P.)和329.7~437 mm样品段(25.50~24.76 ka B. P.)纹层计数的误差(LC)很小,分别为3.1年和5.0年(2σ),组合误差(ε)分别为28.1年和36.7年(2σ),小于U-Th定年误差,因而基于年纹层计数建立的年代模型可更准确地描述H2事件结束过程的内部细节和转型特征。
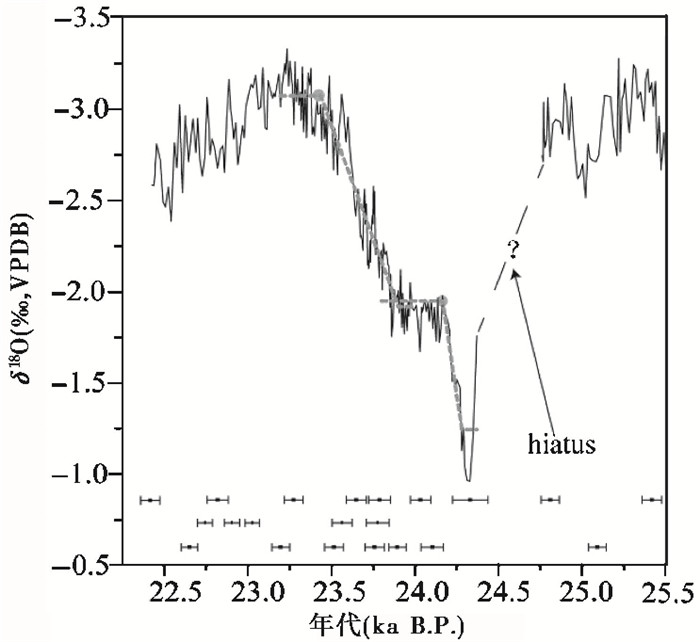
3.2 石笋δ18O记录本研究共获得259个乞拉朋齐洞石笋CHE-2的氧同位素数据,根据3.1节的年龄模型重建了25.50~24.76 ka B. P.和24.38~22.42 ka B. P.时段的石笋δ18O记录,该记录在25.50~24.76 ka B. P.和23.08~22.42 ka B. P.时段平均分辨率为14年,在24.38~23.08 ka B. P.时段平均分辨率为8年。本文使用可检测气候突变事件转型时间的工具“RAMPFIT[61]”对δ18O记录进行分析,其结果如图 6所示,计算出乞拉朋齐洞H2事件结束时段为24.280±0.028~23.436±0.028 ka B. P.(误差为3.1节中年代模型的组合误差ε),依据年纹层计数可知此时段共持续844±3年(误差为3.1节中纹层计数的误差LC)。从25.50 ka B. P.至24.76 ka B. P.,石笋δ18O在均值- 2.9‰处小幅波动;从24.28 ka B. P.至转折点23.44 ka B. P.,δ18O值逐渐负偏,从- 1.2‰变为- 3.1‰,振幅约为1.9‰,此时段在细节上体现出以下特征:1)δ18O值在24.28~24.17 ka B. P.和23.90~23.44 ka B. P.时段发生两次负偏过程,其振幅分别为0.7‰和1.2‰;2)24.17~23.90 ka B. P.时段是一段相对稳定过程,δ18O值在均值- 1.9‰处小幅波动;3)叠加了多个百年-十年际尺度的气候振荡。从转折点23.44 ka B. P.到曲线的最高点23.24 ka B. P.,石笋δ18O在振荡中缓慢负偏,最终达到- 3.3‰。
|
图 6 石笋CHE-2的δ18O记录 黑线和虚线分别表示石笋CHE-2的δ18O记录和“RAMPFIT”[61]拐点分析结果;误差棒表示定年结果和2σ误差 Fig. 6 The CHE-2 δ18O record. The black lines and dashed lines show the CHE-2 δ18O record from Cherrapunji Cave and inflexion point analyses using "RAMPFIT[61]", respectively. The U-Th dates are shown with 2σ error bars |
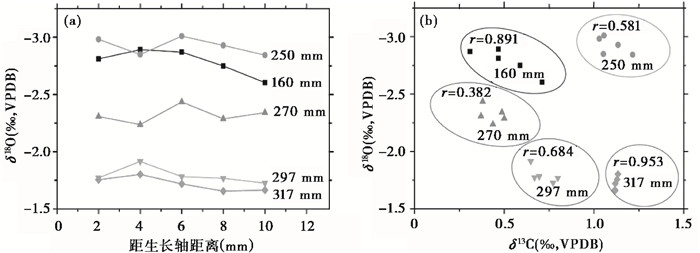
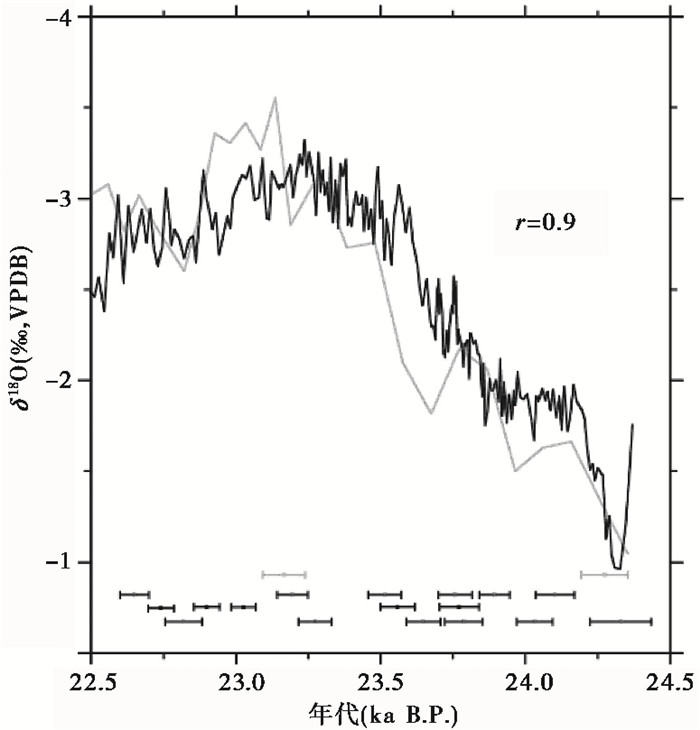
洞穴石笋在生长过程中,碳酸钙和水体处于氧同位素平衡分馏状态是洞穴石笋用于古气候重建的基本条件[62]。评判同位素平衡分馏的传统方法是依据“Hendy准则[62]”:1)在同一生长层内,石笋δ18O值变化不大;2)同一生长层内,石笋的δ18O和δ13C之间不存在显著相关性。由图 7a可知,在同一生长层内,石笋δ18O从中心向边沿位置的变化不大,均在0.2‰的振幅内,满足第一条判定标准。由图 7b可知,同一生长层内,石笋的δ18O和δ13C之间存在一定的相关性,这可能指示石笋沉积过程中同位素分馏不平衡。然而,近些年的研究[63]表明,δ18O和δ13C值之间的相关性并不能排除同位素达到平衡分馏的可能性。Dorale和Liu[63]指出,“重复性”测试是对同位素平衡分馏更严格可靠的检验,如果使用的记录来自同一气候区的不同洞穴,则会进一步增加测试结果的可靠性。Mawmluh洞(25°15′44″N,91°52′54″E;海拔1300 m)[23]和乞拉朋齐洞同处印度东北部地区(图 1),相距约50 km。本文将两洞穴同时段的石笋δ18O记录进行对比,进行“重复性”检验(图 8)。由图 8可知,22.5~24.3 ka B. P.两洞穴石笋δ18O记录在绝对值、变化幅度、变化趋势等方面具有明显的一致性,这表明两洞穴石笋都记录了主要的降水δ18O信息。使用ISCAM算法[64]对22.5~24.3 ka B. P.两洞穴石笋δ18O记录进行分析,其结果(r=0.9,置信度95%)表明两洞穴石笋δ18O记录具有显著相关性,因此乞拉朋齐洞石笋CHE-2的δ18O记录满足重复性检验标准。
|
图 7 不同深度石笋δ18O值从中心向边沿的变化趋势(a)和不同深度的同层碳、氧同位素相关关系(b) Fig. 7 (a)CHE-2 δ18O profiles from center to edge at different depths; (b)Correlations between the δ18O and δ13C from the same layer at different depths |
|
图 8 乞拉朋齐洞和Mawmluh洞[23]δ18O记录之间的重复性检验 黑色和灰色线分别表示乞拉朋齐洞和Mawmluh洞石笋δ18O记录;黑色和灰色误差棒分别表示乞拉朋齐洞和Mawmluh洞记录的定年结果及其2σ误差 Fig. 8 Replication test between Cherrapunji Cave and Mawmluh Cave δ18O records. Black and gray error bars are color-coded and show U-Th dates and their 2σ errors |
距离Mawmluh洞仅50 km的乞拉朋齐洞,与Mawmluh洞所处地理环境相似。现代气象记录显示Mawmluh洞石笋记录的气候信号主要受洞穴上空降水的影响[24, 38, 65~68]。大量模拟结果显示,受印度夏季风控制的降水δ18O(δ18Op)与印度夏季风上游降水量(或夏季风强度)呈显著负相关[21, 65, 69~71]。此外,Mawmluh洞的洞穴监测结果也显示洞穴滴水δ18O记录了局地降水δ18Op的季节信号[38],当印度夏季风增强、降水增多时,当地降水δ18Op偏负[21, 24, 36, 65~66, 69~75],反之亦然,洞穴内滴水δ18O偏负的时间滞后于δ18Op偏负约一个月[38]。根据上述结果以及乞拉朋齐洞与Mawmluh记录的重复性,本文将乞拉朋齐洞石笋δ18O变化解释为印度夏季风强弱的变化,当印度夏季风强(弱)时,乞拉朋齐洞石笋δ18O偏轻(重)。
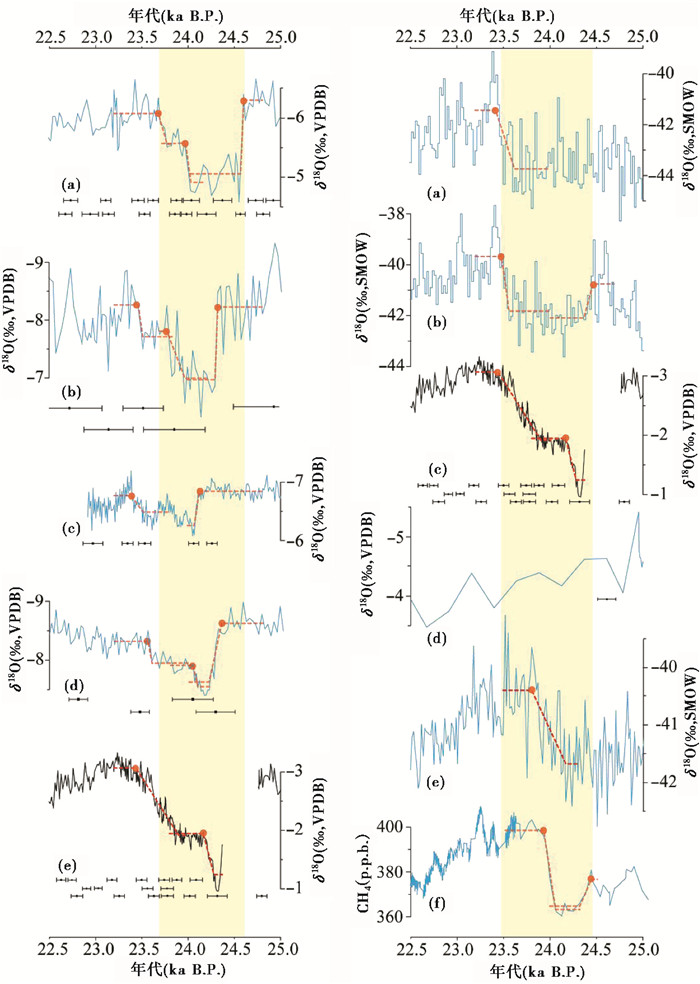
4.3 不同记录的对比选取亚洲季风区已发表论文中精度相对较高的石笋记录与乞拉朋齐洞石笋记录进行对比,并使用“RAMPFIT”工具进行拐点分析,分段准则及分析结果如表 2和图 9左侧所示。在对比时段(图 9左侧黄色条带区域),不同石笋δ18O记录均整体偏正,这些记录进一步证明了北大西洋H2事件同样发生在亚洲季风区。在23.2~24.4 ka B. P.时段,乞拉朋齐洞石笋CHE-2的δ18O记录的变化趋势与葫芦洞[8, 76]、天鹅洞[31]、雾露洞[27~28]相似,均呈现两次负偏过程,而且在第一次负偏(表 2中阶段1对应的t1-t2时期)和第二次负偏(表 2中阶段2对应的t1-t2时期)之间都经历了一段相对稳定过程,但各记录在振荡幅度和变化细节上有所不同,这些差异可能是与气候强迫相关的大气环流和水汽轨迹的不同所致,也可能与冰期时地形的变化有关[25]。闽西仙云洞[35]石笋δ18O记录的H2事件整体偏正,并出现百年-十年际尺度的亚旋回事件,此记录在发生时间和变化趋势上似乎与其他记录不同,这可能是由于在北半球突变事件发生后,ITCZ快速南移,但在热带西太平洋暖池海温变化和ENSO的影响下[77~78],仙云洞地区对冰期气候突变的响应需要更长的时间[77~78];此外,其较多的春季降水也可能是重要影响因素之一。具体原因还需要结合仙云洞附近更多高分辨率的石笋记录以及气候模拟工作进一步研究。
|
图 9
乞拉朋齐洞石笋记录与其他H2事件记录的对比
左图由上至下依次为:(a)葫芦洞石笋δ18O记录[8, 76],(b)天鹅洞石笋δ18O记录[31],(c)仙云洞石笋δ18O记录[35],(d)雾露洞石笋δ18O记录[27~28],(e)乞拉朋齐洞石笋δ18O记录(本研究),其中,(a)~ (c)为东亚季风区石笋δ18O记录,(d)为东亚夏季风和印度夏季风过渡区石笋δ18O记录,(e)为印度季风区石笋δ18O记录;红色虚线表示“RAMPFIT[61]”拐点分析的结果,误差棒表示各记录的定年结果和2σ误差;黄色条带表示葫芦洞石笋δ18O记录[8, 76]确定的H2事件的时间范围 右图由上至下依次为:(a)NGRIP冰芯δ18O记录(时序为GICC05×1.0063)[79~80, 82~84],(b)GISP2冰芯δ18O记录(时序为GICC05×1.0063)[79~80, 82~83],(c)乞拉朋齐洞石笋δ18O记录(本研究),(d)Bittoo洞石笋δ18O记录[24],(e)南极WD冰芯δ18O记录(时序为WD2014)[4, 79~80],(f)南极WD冰芯甲烷记录(时序为WD2014)[79~81];红色虚线表示“RAMPFIT[61]”拐点分析结果,误差棒表示各记录的定年结果和2σ误差;黄色条带表示格陵兰GISP2冰芯δ18O记录确定的H2事件的时间范围 Fig. 9 Cherrapunji Cave H2 record compared with other caves and ice core records. Left panel, δ18O cave records from top to bottom are:Hulu Cave[8, 76](a), Tian'e Cave[31](b), Xianyun Cave[35](c), Wulu Cave[27~28](d)and Cherrapunji Cave(this study) (e). (a)to (c) are δ18O cave records in East Asian monsoon domain. (d)is δ18O cave record in transitional zone between East Asian summer monsoon and Indian summer monsoon. (e)is δ18O cave record in Indian monsoon domain. Red dotted lines indicate results of inflexion point analyses using "RAMPFIT[61]". Black error bars show U-Th dates and their 2σ errors. The vertical yellow rectangle marks H2 Event recorded in the Hulu Cave record[8, 76]. Right panel, records from top to bottom are cave or ice core δ18O records from Greenland NGRIP ice core(on the 1.0063×GICC05 chronology)[79~80, 82~84](a), Greenland GISP2 ice core(on the 1.0063×GICC05 chronology)[79~80, 82~83](b), Cherrapunji Cave(this study) (c), Bittoo Cave[24](d), and Antarctic WD ice core(on the WD2014 chronology)[4, 79~80] (e). (f)is Antarctic WD ice core CH4 record(on the WD2014 chronology)[79~81]. The red dotted lines and error bars are similar to those in the left panel and the yellow rectangle marks the H2 Event recorded in the GISP2 record |
| 表 2 “RAMPFIT”分析结果 Table 2 Results of "RAMPFIT" analyses |
将印度地区的石笋记录和格陵兰冰芯、南极冰芯记录进行对比,并使用“RAMPFIT”工具进行拐点分析,分段准则及分析结果如表 2和图 9右侧所示。在对比时段(图 9右侧的黄色条带区域),北大西洋H2事件在南北两极和印度季风区均有响应。高分辨率南极冰芯记录的甲烷浓度[79~81]在此时段先降低后升高,指示全球先变冷后转暖。格陵兰NGRIP冰芯[79~80, 82~84]、GISP2冰芯[79~80, 82~83]δ18O记录在此时段先负偏,后正偏,指示此时段格陵兰温度先降低后升高,但NGRIP冰芯的δ18O记录在开始阶段变化不明显[82~83]。在对比时段,南极WD冰芯δ18O记录[4, 79~80]呈现的缓慢增温趋势与乞拉朋齐洞石笋δ18O记录的H2事件结束时段第二个负偏过程(23.90~23.44 ka B. P.)的变化趋势相似。印度季风区Bittoo洞[24]和乞拉朋齐洞的石笋δ18O记录在对比时段差异较大,这可能是由于该时段Bittoo洞的记录分辨率低(100年)[24],在此时段缺少定年点的控制所致。此外,Bittoo洞(30°47′25″N,77°46′35″E;海拔3000 m)和乞拉朋齐洞虽然同处印度地区,并受印度夏季风影响,但地理位置相距较远(图 1),水汽环流可能有一定差异,特别是Bittoo洞地区可能受西风环流的影响更大,具体原因需要今后进一步的研究证实。
将亚洲季风区石笋记录和格陵兰冰芯记录进行对比,发现各记录揭示的气候突变事件的时间在误差范围内同步(图 10),这种一致性表明了千年-亚千年尺度上亚洲夏季风强弱变化与北高纬温度变化紧密相关[8, 34]。对比时段(图 10中黄色条带区域)亚洲季风区不同石笋记录呈现的气候突变事件均具有不同程度的快速开始,缓慢结束的结构[31, 34]。乞拉朋齐洞石笋δ18O记录在H2事件开始阶段存在380年的间断,因而无法准确得知印度季风区H2事件开始阶段持续的时间,但可推测其时长必然小于380年,相较于印度季风区H2事件结束阶段经历的840年,乞拉朋齐洞石笋CHE-2记录的H2事件同样呈现出快速开始,缓慢结束的结构,这种结构在亚洲季风区石笋记录的H1事件[52]中同样存在,这表明亚洲季风区末次冰盛期冷事件可能受控于相同的驱动因素[28, 31]。
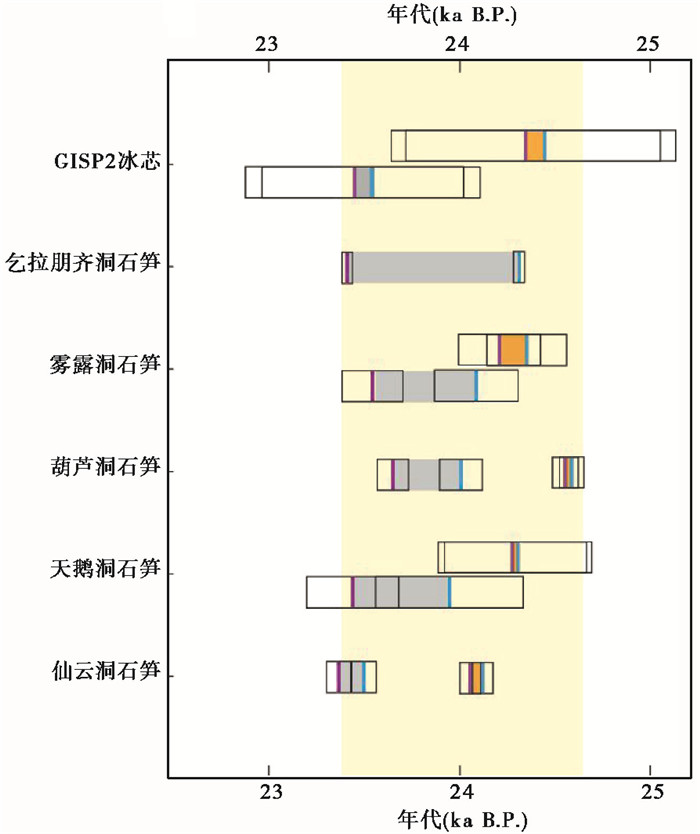
|
图 10
具有较高精度年代控制的气候记录中H2事件的起止时间序列
由上至下依次为:GISP2冰芯(时序为1.0063×GICC05)[79~80, 82~83]和乞拉朋齐洞(本研究)、雾露洞[27~28]、葫芦洞[8, 76]、天鹅洞[31]、仙云洞[35]石笋的δ18O记录 各记录对应于水平条带和估算的开始/结束时间;在水平条带中,蓝色线段表示H2事件开始/结束过程估算的启动时间,该线段两侧的空的黑色矩形表示该时间点估算的2σ误差;紫色线段表示H2事件开始/结束过程估算的完成时间,该线段两侧的空的黑色矩形表示该时间点估算的2σ误差;各时间点由“RAMPFIT[61]”分析确定;垂直的黄色条带区域表示依据葫芦洞石笋δ18O记录(开始时间)和乞拉朋齐洞石笋δ18O记录(结束时间)确定的H2事件时段;橘黄色矩形和灰色矩形分别表示H2事件的开始和结束阶段持续的时间;时间点及其误差来源于本文乞拉朋齐洞的记录和引用的其他记录;需要注意的是,由于定年的分辨率不足,估算的误差可能只代表最小的误差 Fig. 10 The timing of the onset and termination of the H2 Event in paleoclimate records with precise dating controls. From top to bottom are δ18O records from Greenland GISP2 ice core (on the 1.0063×GICC05 chronology)[79~80, 82~83], Cherrapunji Cave(this study), Wulu Cave[27~28], Hulu Cave[8, 76], Tian'e Cave[31], Xianyun Cave[35]. Each record corresponds to two horizontal bars, indicating its estimated onset/termination timing. In horizontal bars, the paired vertical blue lines and empty black rectangles represent the estimated age and 2σ error for the initial onset/termination of the H2 Event; the paired vertical purple lines and empty black rectangles represent the estimated age and 2σ error for the end of the onset/termination of the H2 Event. The timing is calculated using "RAMPFIT[61]". The vertical yellow rectangle depicts the H2 Event defined by the Hulu Cave δ18O record(the onset timing)and Cherrapunji Cave δ18O record(the termination timing), respectively. The orange area and grey area represent the duration of the onset/termination time period, respectively. Error bars were estimated from the data reported in this study for the Cherrapunji Cave record and the related references for other records. We note that the errors might be underestimated due to insufficient dating resolutions |
综上所述,由于乞拉朋齐洞石笋记录中缺少H2事件的开始时段,加之格陵兰冰芯在H2事件时段的累计误差达600年左右[82~83],所以高低纬H2事件发生时间的超前或滞后关系仍不清楚。而已有的研究表明,亚洲季风区H2事件的驱动机制主要有以下一些观点:
(1) 主流观点认为,淡水注入北大西洋后,AMOC减弱[13~15],北大西洋海表温度降低,南北半球热力差异增大,推动ITCZ南移[16~18, 34]。与此同时,北高纬温度降低的信号可能通过西风带和蒙古冷高压传递到亚洲季风区[5],亚洲季风区的冬季风环流增强[85~87],夏季风减弱[6, 8, 20~22, 34]。而由图 9可知,亚洲季风区H2事件结束阶段缓慢结束的特征与北高纬H2事件结束阶段快速结束的特征有所不同[31, 79~80, 82~84],事件内部百年或更短尺度的气候变化也有所差异[31],这可能是由于青藏高原巨大的高程效应和积雪效应可以迅速响应气候变化,并对某些信号起到放大作用,进而影响亚洲季风气候[28, 30]。
(2) 亚洲季风区H2事件结束阶段也可能受到南极逐渐变暖的影响[30, 88~89]。研究人员通过对比末次冰期北极和南极的冰芯记录,发现北极温度降低后,南极温度缓慢上升[30, 90~91],支持“两极跷跷板”的概念。而且,由于南大洋热惯量的存在,南极响应气候变化的信号存在一定的滞后性[92]。研究指出,南极温度变化与南半球西风带的纬向移动以及ITCZ的移动有关[30],Ding等[93]对近几十年的年际气候变率的研究也指出,低纬大气环流与南极温度间存在快速的遥相关。因此,H2事件结束阶段南极温度的缓慢上升可能影响到亚洲季风区,但影响的程度仍不清楚。而印度夏季风作为亚洲夏季风的重要组成部分,其降水超过80%来源于南印度洋[94~95],因此南半球水汽供给和温度的改变可能对印度夏季风甚至是整个亚洲夏季风系统产生重要影响[94],而这也可能是印度季风区乞拉朋齐洞H2事件结束阶段与南极温度变化趋势(图 9)相似的原因。
(3) 亚洲季风区H2事件也可能受到低纬的驱动或放大。研究表明,末次冰盛期以来热带太平洋水循环对南北半球高纬的气候过程和外部辐射强迫都很敏感[96]。热带太平洋通过逐渐改变全球海洋的热量和盐分支出,可能在推动与气候突变有关的温盐环流方面发挥着关键作用[96]。Schmittner等[97]研究指出热带大西洋水汽环流的改变会影响整个大西洋流域的淡水支出,理想化的海气耦合模型也表明这些改变会影响北大西洋温盐环流[97],进而引起全球气候的改变。尽管目前对低纬是全球气候变化的放大器还是触发器仍有争议,但它对全球气候系统的反馈确是各区域气候变化机制的组成部分[96]。
(4) 研究表明,末次冰盛期H2事件与H1事件[52]的转换过程相似,可能受控于相同的驱动因素[28, 31]。Zhang等[98]指出H1事件至Bølling-Allerød暖事件的过程中,石笋记录呈现的两个阶段的季风增强与两次较大的南极冰盖倾泻事件有关。南极冰盖倾泻事件导致的南大洋淡水输入会冷却周边海水,造成海冰范围扩大,限制南半球西风带的南界[98]。另外,淡水的输入也会淡化南极中层水,导致北大西洋深层水的形成增加以及北大西洋亚表层热量的释放,AMOC增强[98],并推动ITCZ北移[16~18],最终导致亚洲夏季风的增强。气候模式模拟[99~102]也表明南极融水的倾泻可调节热量向北运移并引起北半球增暖[98],但是南极气候异常能在何种程度上影响亚洲季风区仍不清楚[98]。遗憾的是,H2事件期间南极冰漂碎屑事件的记录并不明显[103],因此亚洲季风区H2事件结束过程是否和H1事件结束过程一样受到南极冰盖倾泻事件的影响仍有待南极地区更多高分辨率深海沉积物的研究和气候模拟结果来进一步确认。
总之,本文的工作尚不足以很好地解释H2事件的气候动力学机制,或对不同假说做出明确判断。但新的乞拉朋齐洞石笋记录具有前所未有的可靠的事件年代和精细结构,对深入探索印度季风千年事件与全球变化的关系有着重要意义,并且能够给气候模拟工作提供观测上的制约。
5 结论(1) 基于印度东北部乞拉朋齐洞年纹层石笋CHE-2的21个U-Th年代、2701条纹层的计数和259个氧同位素数据,建立了25.50~24.76 ka B. P.和24.38~22.42 ka B. P.时段的石笋δ18O序列,刻画了印度东北部地区H2事件的结束过程和精细结构,标定了印度季风区H2事件的结束时段为24.280±0.028~23.436±0.028 ka B. P.,其在发生时间上与东亚季风区石笋和格陵兰冰芯记录在误差范围内同步,这也是迄今为止最为精确的H2事件结束时段的年龄,此期间共持续844±3年,振幅约为1.9‰,经历两次负偏过程(24.28~24.17 ka B. P.和23.90~23.44 ka B. P.)和一段相对稳定过程(24.17~23.90 ka B. P.),叠加了多个百年-十年际尺度的气候振荡。不同记录的对比说明了H2事件的内部复杂性和区域差异性。
(2) 乞拉朋齐洞石笋记录中缺少H2事件的开始时段,加之格陵兰冰芯在H2事件时段的累计误差达600年左右,因此高低纬H2事件发生时间的超前或滞后关系仍不清楚。本研究尚不能对H2事件发生机制的不同假说做出明确判断。但就亚洲季风区记录及其与高纬记录的对比来看,与目前主流的观点没有矛盾:淡水注入北大西洋后AMOC减弱,北高纬温度降低,ITCZ南移。同时北高纬温度变化的信号通过西风带和蒙古冷高压传递到亚洲季风区,影响亚洲夏季风;亚洲季风区H2事件结束阶段可能受到南极缓慢变暖的影响;此外,亚洲季风区H2事件也不可避免地受到低纬和青藏高原气候变化的反馈或放大的影响。
(3) 本文首次使用ImageJ软件处理激光扫描共聚焦显微镜得到的石笋荧光纹层图像,结合MATLAB软件,对99.5~329.5 mm和329.7~437.0 mm样品段进行了纹层计数,其年纹层数分别为1957层和744层,各年纹层的厚度如图 5所示。此方法是一种对样品无损的分析方法,支持多种格式的扫描图像,相比起人工计数也有一定的优势。
致谢: 非常感谢编辑部杨美芳老师和匿名审稿专家提供的宝贵修改意见。感谢中国科学院地球环境研究所秦秀玲老师在样品前期处理过程提供的帮助。感谢西安交通大学人居环境与建筑工程学院王毛毛师姐等对相关软件和实验的指导与帮助。
| [1] |
Bond G, Broecker W, Johnsen S, et al. Correlations between climate records from North-Atlantic sediments and Greenland ice[J]. Nature, 1993, 365(6442): 143-147. DOI:10.1038/365143a0 |
| [2] |
Dansgaard W, Johnsen S J, Clausen H B, et al. North Atlantic climatic oscillations revealed by deep Greenland ice cores[J]. Climate Processes and Climate Sensitivity, 1984, 29: 288-298. DOI:10.1029/GM029p0288 |
| [3] |
Dansgaard W, Johnsen S J, Clausen H B, et al. Evidence for general instability of past climate from a 250-kyr ice-core record[J]. Nature, 1993, 364(6434): 218-220. DOI:10.1038/364218a0 |
| [4] |
WAIS Divide Project Members. Precise interpolar phasing of abrupt climate change during the last ice age[J]. Nature, 2015, 520(7549): 661-665. DOI:10.1038/nature14401 |
| [5] |
Porter S C, An Z S. Correlation between climate events in the North Atlantic and China during the last glaciation[J]. Nature, 1995, 375(6529): 305-308. DOI:10.1038/375305a0 |
| [6] |
Schulz H, Rad U V, Erlenkeuser H. Correlation between Arabian sea and Greenland climate oscillations of the past 110, 000 years[J]. Nature, 1998, 393(6680): 54-57. DOI:10.1038/31750 |
| [7] |
Wang X F, Auler A S, Edwards R L, et al. Millennial-scale precipitation changes in Southern Brazil over the past 90, 000 years[J]. Geophysical Research Letters, 2007, 34(23): 135-147. |
| [8] |
Wang Y J, Cheng H, Edwards R L, et al. A high-resolution absolute-dated Late Pleistocene monsoon record from Hulu Cave, China[J]. Science, 2001, 294(5550): 2345-2348. DOI:10.1126/science.1064618 |
| [9] |
董进国, 赵侃, 沈川洲, 等. 黄土高原石笋记录的DO 25季风增强事件[J]. 第四纪研究, 2016, 36(6): 1502-1509. Dong Jinguo, Zhao Kan, Shen Chuanzhou, et al. Strong East Asian Summer Monsoon during the DO 25 event recorded by an absolute-dated stalagmite from Dragon Cave, Northern China[J]. Quaternary Sciences, 2016, 36(6): 1502-1509. |
| [10] |
孙喜利, 杨勋林, 史志超, 等. 石笋记录的西南地区MIS 4阶段夏季风的演化[J]. 第四纪研究, 2017, 36(7): 1370-1380. Sun Xili, Yang Xunlin, Shi Zhichao, et al. The evolution of summer monsoon in southwest China during MIS 4 as revealed by stalagmite δ18O record.[J]. Quaternary Sciences, 2017, 36(7): 1370-1380. |
| [11] |
Heinrich H. Origin and consequences of cyclic ice rafting in the northeast Atlantic ocean during the past 130, 000 years[J]. Quaternary Research, 1988, 29(2): 142-152. DOI:10.1016/0033-5894(88)90057-9 |
| [12] |
王绍武. 全新世气候变化[M]. 北京: 气象出版社, 2011: 25. Wang Shaowu. The Holocene Climate Change[M]. Beijing: China Meteorological Press, 2011: 25. |
| [13] |
Broecker W. Massive iceberg discharges as triggers for global climate-change[J]. Nature, 1994, 372(6505): 421-424. DOI:10.1038/372421a0 |
| [14] |
Ganopolski A, Rahmstorf S. Rapid changes of glacial climate simulated in a coupled climate model[J]. Nature, 2001, 409(6817): 153-158. DOI:10.1038/35051500 |
| [15] |
Mcmanus J F, Francois R, Gherardi I M, et al. Collapse and rapid resumption of Atlantic Meridional Circulation linked to deglacial climate changes[J]. Nature, 2004, 428(6985): 834-837. DOI:10.1038/nature02494 |
| [16] |
Chiang J C H, Bitz C M. Influence of high latitude ice cover on the marine Intertropical Convergence Zone[J]. Climate Dynamics, 2005, 25(5): 477-496. DOI:10.1007/s00382-005-0040-5 |
| [17] |
Schneider T, Bischoff T, Haug G H. Migrations and dynamics of the intertropical convergence zone[J]. Nature, 2014, 513(7516): 45-53. DOI:10.1038/nature13636 |
| [18] |
Zhang R, Delworth T L. Simulated tropical response to a substantial weakening of the Atlantic Thermohaline Circulation[J]. Journal of Climate, 2005, 18(12): 1853-1860. DOI:10.1175/JCLI3460.1 |
| [19] |
Jiang X Y, He Y Q, Shen C C, et al. Decoupling of the East Asian summer monsoon and Indian summer monsoon between 20 and 17 ka[J]. Quaternary Research, 2014, 82(1): 146-153. DOI:10.1016/j.yqres.2014.05.001 |
| [20] |
Deplazes G, Lückge A, Stuut J B W, et al. Weakening and strengthening of the Indian monsoon during Heinrich events and Dansgaard-Oeschger oscillations[J]. Paleoceanography, 2014, 29(2): 99-114. DOI:10.1002/2013PA002509 |
| [21] |
Pausata F S R, Battisti D S, Nisancioglu K H, et al. Chinese stalagmite δ18O controlled by changes in the Indian monsoon during a simulated Heinrich event[J]. Nature Geoscience, 2011, 4: 474-480. DOI:10.1038/ngeo1169 |
| [22] |
Zorzi C, Sanchez Goñi M F, Anupama K, et al. Indian monsoon variations during three contrasting climatic periods:The Holocene, Heinrich Stadial 2 and the last interglacial-glacial transition[J]. Quaternary Science Reviews, 2015, 125: 50-60. DOI:10.1016/j.quascirev.2015.06.009 |
| [23] |
Dutt S, Gupta A K, Clemens S C, et al. Abrupt changes in Indian summer monsoon strength during 33, 800 to 5500 years B. P[J]. Geophysical Research Letters, 2015, 42(13): 5526-5532. DOI:10.1002/2015GL064015 |
| [24] |
Kathayat G, Cheng H, Sinha A, et al. Indian monsoon variability on millennial-orbital timescales[J]. Scientific Reports, 2016, 6: 24374. DOI:10.1038/srep24374 |
| [25] |
Cai Y J, Fung I Y, Edwards R L, et al. Variability of stalagmite-inferred Indian monsoon precipitation over the past 252, 000 y[J]. Proceedings of the National Academy of Sciences of the United States of America, 2015, 112(10): 201424035. DOI:10.1073/pnas.1424035112 |
| [26] |
袁娜.重庆羊口洞石笋记录的Heinrich事件[D].重庆: 西南大学硕士论文, 2015: 1-67. Yuan Na. The Heinrich Events during the Period Recorded by the Stalagmites in Yangkou Cave[D]. Chongqing: The Master's Thesis of Southwest University, 2015: 1-67. http://d.wanfangdata.com.cn/Thesis/Y2811728 |
| [27] |
Zhao K, Wang Y J, Edwards R L, et al. High-resolution stalagmite δ18O records of Asian monsoon changes in Central and Southern China spanning the MIS 3/2 transition[J]. Earth and Planetary Science Letters, 2010, 298(1): 191-198. |
| [28] |
赵侃, 汪永进. 黔西南石笋记录MIS 3/2阶段百年尺度季风演变和H事件特征[J]. 海洋地质与第四纪地质, 2011, 31(2): 121-128. Zhao Kan, Wang Yongjin. Asian monsoon changes on centennial-scale andcharacters of Heinrich events during the MIS 3/2 transition from a stalagmite record in Southwest China[J]. Marine Geology & Quaternary Geology, 2011, 31(2): 121-128. |
| [29] |
Zhang Meiliang, Cheng Hai, Yuan Daoxian, et al. High-resolution climate records from two stalagmites in Qixin Cave, southern Guizhou, and Heinrich events during the last glacial period[J]. Episodes, 2004, 27(2): 112-118. |
| [30] |
Chen S T, Wang Y J, Cheng H, et al. Strong coupling of Asian Monsoon and Antarctic climates on sub-orbital timescales[J]. Scientific Reports, 2016, 6: 32995. DOI:10.1038/srep32995(2016) |
| [31] |
陈仕涛, 汪永进, 吴江滢, 等. 东亚季风气候对Heinrich2事件的响应:来自石笋的高分辨率记录[J]. 地球化学, 2006, 35(6): 586-592. Chen Shitao, Wang Yongjing, Wu Jiangying, et al. An event of the East Asian monsoon responding to Heinrich Event 2:Evidence from high-resolution stalagmite record[J]. Geochimica, 2006, 35(6): 586-592. DOI:10.3321/j.issn:0379-1726.2006.06.002 |
| [32] |
吴秀平, 吴锦奎, 侯典炯, 等. 黄土高原西部石笋记录的H2事件特征[J]. 地球科学——中国地质大学学报, 2013, 38(3): 471-481. Wu Xiuping, Wu Jinkui, Hou Dianjiong, et al. Characteristics and variability of the Heinrich-2 event recorded by stalagmite oxygen isotopic composition in the Wwestern Loess Plateau[J]. Earth Science-Journal of China University of Geosciences, 2013, 38(3): 471-481. |
| [33] |
Cosford J, Qing H, Yin L, et al. The East Asian monsoon during MIS 2 expressed in a speleothem δ18O record from Jintanwan Cave, Hunan, China[J]. Quaternary Research, 2010, 73(3): 541-549. DOI:10.1016/j.yqres.2010.01.003 |
| [34] |
董进国, 董梦彩, 熬贵福, 等. MIS 3以来黄土高原东南部石笋阶段性沉积记录的夏季风演化[J]. 海洋地质与第四纪地质, 2018, 38(5): 171-177. Dong Jinguo, Dong Mengcai, Ao Guifu, et al. Variation of East Asian summer monsoon since MIS 3 recorded by an absolutely-dated stalagmite from North China[J]. Marine Geology & Quaternary Geology, 2018, 38(5): 171-177. |
| [35] |
车印平, 肖海燕, 崔梦月, 等. 闽西仙云洞石笋记录的Heinrich 2事件年龄及亚旋回特征[J]. 沉积学报, 2018, 36(6): 1139-1147. Che Yinping, Xiao Haiyan, Cui Mengyue, et al. Timing and structure of the Heinrich 2 abrupt event inferred from a speleothem record from Xianyun Cave, western Fujian Province[J]. Acta Sedimentologica Sinica, 2018, 36(6): 1139-1147. |
| [36] |
Kathayat G, Cheng H, Sinha A, et al. Evaluating the timing and structure of the 4.2 ka event in the Indian summer monsoon domain from an annually resolved speleothem record from Northeast India[J]. Climate of the Past, 2018, 14(12): 1869-1879. DOI:10.5194/cp-14-1869-2018 |
| [37] |
Murata F, Hayashi T, Matsumoto J, et al. Rainfall on the Meghalaya Plateau in northeastern India-One of the rainiest places in the world[J]. Natural Hazards, 2007, 42(2): 391-399. DOI:10.1007/s11069-006-9084-z |
| [38] |
Breitenbach S F M, Adkins J F, Meyer H, et al. Strong influence of water vapor source dynamics on stable isotopes in precipitation observed in Southern Meghalaya, NE India[J]. Earth and Planetary Science Letters, 2010, 292(1): 212-220. |
| [39] |
Sengupta S, Sarkar A. Stable isotope evidence of dual(Arabian Sea and Bay of Bengal)vapour sources in monsoonal precipitation over North India[J]. Earth and Planetary Science Letters, 2006, 250(3): 511-521. |
| [40] |
Edwards R L, Chen J H, Ku T L, et al. Precise timing of the last interglacial period from mass spectrometric determination of thorium-230 in corals[J]. Science, 1987, 236(4808): 1547-1553. DOI:10.1126/science.236.4808.1547 |
| [41] |
Cheng H, Edwards R L, Hoff J, et al. The half-lives of uranium-234 and thorium-230[J]. Chemical Geology, 2000, 169(1): 17-33. |
| [42] |
Cheng H, Edwards R L, Shen C C, et al. Improvements in 230Th dating, 230Th and 234U half-life values, and U-Th isotopic measurements by multi-collector inductively coupled plasma mass spectrometry[J]. Earth and Planetary Science Letters, 2013, 371-372: 82-91. DOI:10.1016/j.epsl.2013.04.006 |
| [43] |
Tan M, Baker A, Genty D, et al. Applications of stalagmite laminae to paleoclimate reconstructions:Comparison with dendrochronology/climatology[J]. Quaternary Science Reviews, 2006, 25(17-18): 2103-2117. DOI:10.1016/j.quascirev.2006.01.034 |
| [44] |
Andy B, Claire L S, Catherine J, et al. Annually laminated speleothems:A review[J]. International Journal of Speleology, 2008, 37(3): 193-206. DOI:10.5038/1827-806X |
| [45] |
Domínguez-Villar D, Baker A, Fairchild I J, et al. A method to anchor floating chronologies in annually laminated speleothems with U-Th dates[J]. Quaternary Geochronology, 2012, 14: 57-66. DOI:10.1016/j.quageo.2012.04.019 |
| [46] |
Hou J Z, Tan M, Cheng H, et al. Stable isotope records of plant cover change and monsoon variation in the past 2200 years:Evidence from laminated stalagmites in Beijing, China[J]. Boreas, 2003, 32(2): 304-313. DOI:10.1080/03009480310002000 |
| [47] |
Li X L, Cheng H, Tan L C, et al. The East Asian summer monsoon variability over the last 145 years inferred from the Shihua Cave record, North China[J]. Scientific Reports, 2017, 7(1): 7078. DOI:10.1038/s41598-017-07251-3 |
| [48] |
Shen C C, Lin K, Duan W H, et al. Testing the annual nature of speleothem banding[J]. Scientific Reports, 2013, 3(12): 2633. |
| [49] |
谭明, 侯居峙, 程海. 定量重建气候历史的石笋年层方法[J]. 第四纪研究, 2002, 22(3): 209-219. Tan Ming, Hou Juzhi, Cheng Hai. Methodology of quantitatively reconstructing paleoclimate from annuall laminated stalagmites[J]. Quaternary Sciences, 2002, 22(3): 209-219. DOI:10.3321/j.issn:1001-7410.2002.03.003 |
| [50] |
邓朝, 汪永进, 刘殿兵, 等. "8.2 ka"事件的湖北神农架高分辨率年纹层石笋记录[J]. 第四纪研究, 2013, 33(5): 945-953. Deng Chao, Wang Yongjin, Liu Dianbing, et al. The Asian monsoon variability around 8.2 ka B. P. recorded by an annually laminated stalagmite from Mt. Shennongjia, Central China[J]. Quaternary Sciences, 2013, 33(5): 945-953. DOI:10.3969/j.issn.1001-7410.2013.05.12 |
| [51] |
Liu D B, Wang Y J, Cheng H, et al. Centennial-scale Asian monsoon variability during the mid-Younger Dryas from Qingtian Cave, central China[J]. Quaternary Research, 2013, 80(2): 199-206. DOI:10.1016/j.yqres.2013.06.009 |
| [52] |
汪永进, 吴江滢, 刘殿兵, 等. 石笋记录的东亚季风气候H1事件突变性特征[J]. 中国科学(D辑), 2002, 45(3): 227-233. Wang Yongjin, Wu Jiangying, Liu Dianbing, et al. A quick cooling event of East Asian monsoon responding to Heinrich event 1:Evidence from stalagmites δ18O records[J]. Science in China (Series D), 2002, 45(1): 88-96. |
| [53] |
王权, 刘殿兵, 汪永进, 等. 湖北神农架年纹层石笋记录的YD与8.2 ka事件转型模式研究[J]. 沉积学报, 2015, 33(6): 1140-1148. Wang Quan, Liu Dianbing, Wang Yongjin, et al. Transitional patterns of YD and 8.2 ka Event recorded by annually laminated stalagmites from Qingtian Cave, Mt. Shennongjia[J]. Acta Sedimentological Sinica, 2015, 33(6): 1140-1148. |
| [54] |
王权, 汪永进, 刘殿兵, 等. DO 3事件的湖北神农架高分辨率年纹层石笋记录[J]. 第四纪研究, 2017, 37(1): 108-117. Wang Quan, Wang Yongjin, Liu Dianbing, et al. The DO 3 event in Asian monsoon climates evidenced by an annually laminated stalagmite from Qingtian Cave, Mt. Shennongjia[J]. Quaternary Sciences, 2017, 37(1): 108-117. |
| [55] |
Zhang H W, Cheng H, Spötl C, et al. A 200-year annually laminated stalagmite record of precipitation seasonality in southeastern China and its linkages to ENSO and PDO[J]. Scientific Reports, 2018, 8(1): 12344. DOI:10.1038/s41598-018-30112-6 |
| [56] |
Zhao J Y, Cheng H, Yang Y, et al. Reconstructing the western boundary variability of the Western Pacific Subtropical High over the past 200 years via Chinese cave oxygen isotope records[J]. Climate Dynamics, 2018, 52(5-6): 3741-3757. DOI:10.1007/s00382-018-4456-0 |
| [57] |
赵景耀, 程海. 激光扫描共聚焦显微镜在古气候纹层学的应用[J]. 第四纪研究, 2017, 37(6): 1472-1474. Zhao Jingyao, Cheng Hai. Applications of laser scanning confocal microscope to paleoclimate research:Characterizing and counting laminae[J]. Quaternary Sciences, 2017, 37(6): 1472-1474. |
| [58] |
Jaffey A H, Flynn K F, Glendenin L E, et al. Precision measurement of half-lives and specific activities of 235U and 238U[J]. Physical Review C, 1971, 4(5): 1889-1906. DOI:10.1103/PhysRevC.4.1889 |
| [59] |
谭明. 石笋微层气候学的几个重要问题[J]. 第四纪研究, 2005, 25(2): 164-169. Tan Ming. Significat issues of stalagmite layer-climatology[J]. Quaternary Sciences, 2005, 25(2): 164-169. DOI:10.3321/j.issn:1001-7410.2005.02.005 |
| [60] |
胡尊语, 覃荣蓓, 樊仁为, 等. 湖北清江和尚洞石笋色度对温度的响应[J]. 第四纪研究, 2018, 38(6): 1487-1493. Hu Zunyu, Qin Rongbei, Fan Renwei, et al. The paleo-temperature significance of color or annual laminae stalagmite from Heshang Cave, Central China[J]. Quaternary Sciences, 2018, 38(6): 1487-1493. |
| [61] |
Mudelsee M. Ramp function regression:A tool for quantifying climate transitions[J]. Computers & Geosciences, 2000, 26(3): 293-307. |
| [62] |
Hendy C H. The isotopic geochemistry of speleothems-Ⅰ. The calculation of the effects of different modes of formation on the isotopic composition of speleothems and their applicability as palaeoclimatic indicators[J]. Geochimica et Cosmochimica Acta, 1971, 35(8): 801-824. DOI:10.1016/0016-7037(71)90127-X |
| [63] |
Dorale J A, Liu Z. Limitations of Hendy test criteria in judging the paleoclimatic suitability of speleothems and the need for replication[J]. Journal of Cave and Karst Studies, 2009, 71(1): 73-80. |
| [64] |
Fohlmeister J. A statistical approach to construct composite climate records of dated archives[J]. Quaternary Geochronology, 2012, 14(4): 48-56. |
| [65] |
Berkelhammer M, Sinha A, Stott L, et al. An abrupt shift in the Indian monsoon 4000 years ago[M]//Giosan L, Fuller D Q, Nicoll K, et al. Climates, Landscapes, and Civilizations. Geophysical Monograph Series, 2012, 198: 75-87. doi: 10.1029/2012GM001207.
|
| [66] |
Breitenbach S F M, Lechleitner F A, Meyer H, et al. Cave ventilation and rainfall signals in dripwater in a monsoonal setting-A monitoring study from NE India[J]. Chemical Geology, 2015, 402: 111-124. DOI:10.1016/j.chemgeo.2015.03.011 |
| [67] |
Cheng H, Edwards R L, Sinha A, et al. The Asian monsoon over the past 640, 000 years and ice age terminations[J]. Nature, 2016, 534(7609): 640-646. DOI:10.1038/nature18591 |
| [68] |
Sinha A, Berkelhammer M, Stott L, et al. The leading mode of Indian summer monsoon precipitation variability during the last millennium[J]. Geophysical Research Letters, 2011, 38: L15703. DOI:10.1029/2011GL047713 |
| [69] |
Midhun M, Ramesh R. Validation of δ18O as a proxy for past monsoon rain by multi-GCM simulations[J]. Climate Dynamics, 2016, 46(5-6): 1371-1385. DOI:10.1007/s00382-015-2652-8 |
| [70] |
Sinha A, Kathayat G, Cheng H, et al. Trends and oscillations in the Indian summer monsoon rainfall over the last two millennia[J]. Nature Communications, 2015, 6: 6309. DOI:10.1038/ncoroms7309 |
| [71] |
Vuille M, Werner M, Bradley R S, et al. Stable isotopes in precipitation in the Asian monsoon region[J]. Journal of Geophysical Research:Atmospheres, 2005, 110(D23108): 1-15. |
| [72] |
Cheng H, Zhang P Z, Spötl C, et al. The climatic cyclicity in semiarid-arid Central Asia over the past 500, 000 years[J]. Geophysical Research Letters, 2012, 39: L01705. DOI:10.1029/2011GL050202 |
| [73] |
Kathayat G, Cheng H, Sinha A, et al. The Indian monsoon variability and civilization changes in the Indian subcontinent[J]. Science Advances, 2017, 3(12): e1701296. DOI:10.1126/sciadv.1701296 |
| [74] |
Myers C G, Oster J L, Sharp W D, et al. Northeast Indian stalagmite records Pacific decadal climate change:Implications for moisture transport and drought in India[J]. Geophysical Research Letters, 2015, 42(10): 4124-4132. DOI:10.1002/grl.v42.10 |
| [75] |
Sinha A, Stott L, Berkelhammer M, et al. A global context for megadroughts in monsoon Asia during the past millennium[J]. Quaternary Science Reviews, 2011, 30(1-2): 47-62. DOI:10.1016/j.quascirev.2010.10.005 |
| [76] |
Cheng H, Edwards R L, Southon J, et al. Atmospheric 14C/14C changes during the last glacial period from Hulu Cave[J]. Science, 2018, 362(6420): 1293-1297. DOI:10.1126/science.aau0747 |
| [77] |
崔梦月, 洪晖, 孙晓双, 等. 福建仙云洞石笋记录的新仙女木突变事件结束时的缓变特征[J]. 第四纪研究, 2018, 38(3): 711-719. Cui Mengyue, Hong Hui, Sun Xiaoshuang, et al. The gradual change characteristics at the end of the Yonger Dryas Event inferred from a speleothem record from Xianyun Cave, Fujian Province[J]. Quaternary Sciences, 2018, 38(3): 711-719. |
| [78] |
崔梦月, 肖海燕, 孙晓双, 等. 福建仙云洞石笋记录的Heinrich 1事件突变特征[J]. 科学通报, 2017, 62(26): 3078-3088. Cui Mengyue, Xiao Haiyan, Sun Xiaoshuang, et al. Characteristics of the Heinrich 1 abrupt climate event inferred from a speleothem record from Xianyun Cave, Fujian Province[J]. Chinese Science Bulletin, 2017, 62(26): 3078-3088. |
| [79] |
Buizert C, Cuffey K M, Severinghaus J P, et al. The WAIS-Divide deep ice core WD2014 chronology-Part 1:Methane synchronization(68-31 ka BP)and the gas age-ice age difference[J]. Climate of the Past, 2015, 11(4): 153-173. |
| [80] |
Sigl M, Fudge T J, Winstrup M, et al. The WAIS Divide deep ice core WD2014 chronology-Part 2:Annual-layer counting(0-31 ka BP)[J]. Climate of the Past, 2016, 11(4): 3425-3474. |
| [81] |
Rhodes R H, Brook E J, Mcconnell J R, et al. Atmospheric methane variability:Centennial-scale signals in the last glacial period[J]. Global Biogeochemical Cycles, 2017, 31(3): 575-590. DOI:10.1002/2016GB005570 |
| [82] |
Rasmussen S O, Bigler M, Blockley S P, et al. A stratigraphic framework for abrupt climatic changes during the Last Glacial period based on three synchronized Greenland ice-core records:Refining and extending the intimate event stratigraphy[J]. Quaternary Science Reviews, 2014, 106: 14-28. DOI:10.1016/j.quascirev.2014.09.007 |
| [83] |
Rasmussen S O, Seierstad I K, Andersen K K, et al. Synchronization of the NGRIP, GRIP, and GISP2 ice cores across MIS 2 and paleoclimatic implications[J]. Quaternary Science Reviews, 2008, 27(1): 18-28. |
| [84] |
North Greenland Ice Core Project Members. High-resolution record of Northern Hemisphere climate extending into the last interglacial period[J]. Nature, 2004, 431(7005): 147-151. DOI:10.1038/narure02805 |
| [85] |
Sun Y B, Clemens S C, Morrill C, et al. Influence of Atlantic meridional overturning circulation on the East Asian winter monsoon[J]. Nature Geoscience, 2012, 5: 46-49. DOI:10.1038/ngeo1326 |
| [86] |
郭正堂, 刘东生, 吴乃琴, 等. 最后两个冰期黄土中记录的Heinrich型气候节拍[J]. 第四纪研究, 1996(1): 21-30. Guo Zhengtang, Liu Dongsheng, Wu Naiqin, et al. Heinrich-rhythm pulses of climates recorded in loess of the last two glaciations[J]. Quaternary Sciences, 1996(1): 21-30. DOI:10.3321/j.issn:1001-7410.1996.01.003 |
| [87] |
胡小猛, 王杜涛, 陈美君, 等. 山西临汾盆地末次冰期时段湖相沉积中的H、D/O事件记录[J]. 第四纪研究, 2014, 34(2): 354-363. Hu Xiaomeng, Wang Dutao, Chen Meijun, et al. The study on the records of the H and D/O paleoclimatic events during the last glacial period from the lacustrine sediment in Linfen Basin, Shanxi graben[J]. Quaternary Sciences, 2014, 34(2): 354-363. DOI:10.3969/j.issn.1001-7410.2014.02.09 |
| [88] |
Cvijanovic I, Langen P L, Kaas E, et al. Southward intertropical convergence zone shifts and implications for an atmospheric bipolar seesaw[J]. Journal of Climate, 2013, 26(12): 4121-4137. DOI:10.1175/JCLI-D-12-00279.1 |
| [89] |
Rohling E J, Liu Q S, Roberts A P, et al. Controls on the East Asian monsoon during the last glacial cycle, based on comparison between Hulu Cave and polar ice-core records[J]. Quaternary Science Reviews, 2009, 28(27): 3291-3302. |
| [90] |
EPICA Community Members. One-to-one coupling of glacial climate variability in Greenland and Antarctica[J]. Nature, 2006, 444(7116): 195-198. DOI:10.1038/nature05301 |
| [91] |
Blunier T, Brook E J. Timing of millennial-scale climate change in Antarctica and Greenland during the last glacial period[J]. Science, 2001, 291(5501): 109-112. DOI:10.1126/science.291.5501.109 |
| [92] |
Stocker T F, Johnsen S J. A minimum thermodynamic model for the bipolar seesaw[J]. Paleoceanography, 2003, 18(4): 1087. DOI:10.1029/2003PA000920 |
| [93] |
Ding Q H, Steig E J, Battisti D S, et al. Winter warming in West Antarctica caused by central tropical Pacific warming[J]. Nature Geoscience, 2011, 4: 398-403. DOI:10.1038/NGEO1129 |
| [94] |
Cai Y J, An Z S, Cheng H, et al. High-resolution absolute-dated Indian monsoon record between 53 and 36 ka from Xiaobailong Cave, Southwestern China[J]. Geology, 2006, 34(8): 621-624. DOI:10.1130/G22567.1 |
| [95] |
Clemens S C, Murray D W, Prell W L. Nonstationary phase of the Plio-Pleistocene Asian monsoon[J]. Science, 1996, 274(5289): 943-948. DOI:10.1126/science.274.5289.943 |
| [96] |
Partin J W, Cobb K M, Adkins J F, et al. Millennial-scale trends in west Pacific warm pool hydrology since the Last Glacial Maximum[J]. Nature, 2007, 449(7161): 452-455. DOI:10.1038/nature06164 |
| [97] |
Schmittner A, Appenzeller C, Stocker T F. Enhanced Atlantic freshwater export during El Niño[J]. Geophysical Research Letters, 2000, 27(8): 1163-1166. DOI:10.1029/1999GL011048 |
| [98] |
Zhang H B, Griffiths M L, Huang J, et al. Antarctic link with East Asian summer monsoon variability during the Heinrich Stadial-Bølling interstadial transition[J]. Earth and Planetary Science Letters, 2016, 453: 243-251. DOI:10.1016/j.epsl.2016.08.008 |
| [99] |
Knorr G, Lohmann G. Southern Ocean origin for the resumption of Atlantic thermohaline circulation during deglaciation[J]. Nature, 2003, 424(6948): 532-536. DOI:10.1038/nature01855 |
| [100] |
Seidov D, Barron E, Haupt B J. Meltwater and the global ocean conveyor:Northern versus southern connections[J]. Global and Planetary Change, 2001, 30(3): 257-270. |
| [101] |
Shakun J D, Clark P U, He F, et al. Global warming preceded by increasing carbon dioxide concentrations during the last deglaciation[J]. Nature, 2012, 484(7932): 49-54. DOI:10.1038/nature10915 |
| [102] |
Weaver A J, Saenko O A, Clark P U, et al. Meltwater pulse 1 A from Antarctica as a trigger of the Bølling-Allerød warm interval[J]. Science, 2003, 299(5613): 1709-1713. DOI:10.1126/science.1081002 |
| [103] |
Weber M E, Clark P U, Kuhn G, et al. Millennial-scale variability in Antarctic ice-sheet discharge during the last deglaciation[J]. Nature, 2014, 510(7503): 134-138. DOI:10.1038/nature13397 |
2 Department of Earth Sciences, University of Minnesota, Minneapolis, MN 55455, USA;
3 State Key Laboratory of Loess and Quaternary Geology, Institute of Earth Environment, Chinese Academy of Sciences, Xi'an 710061, Shaanxi;
4 University of Chinese Academy of Sciences, Beijing 100049;
5 State Key Laboratory for Manufacturing Systems Engineering, Xi'an Jiaotong University, Xi'an 710054, Shaanxi)
Abstract
The Heinrich 2 (H2) Event is among one of the abrupt cold events, which is first recognized from the North Atlantic Ocean as an ice-rafted debris event during the Last Glacial Period. The detailed structure (e.g., timing, duration) under constraint chronology of this millennial scale climatic event can provide a better understanding of the underlying forcing mechanisms. However, up to now, there are only a few high-resolution and precisely-dated paleoclimate records across the H2 Event, which largely impedes our ability to understand its timing, structure and the potential forcing mechanisms. Here, we present a cave speleothem oxygen isotope (δ18O) record (stalagmite CHE-2, total length is 940 mm) from the Cherrapunji Cave (25°11'59"N, 92°27'11"E; 1100 m a.s.l.), Northeast India. This record has high resolution (259 oxygen isotope data, an average resolution of 8 years between 24.38 ka B. P. (before present, present=1950 A.D.) to 23.08 ka B. P. and 14 years for other period), and reconstruction of the Indian monsoon during H2 Event is constrained not only by 21 high-precision U-Th ages (average age uncertainty is ±60 years), additionally via annual fluorescent lamination counting (2701 annual bands, further supported by the U-Th ages) using the Laser Scanning Confocal Microscope. The unprecedented δ18O resolution and chronology of our record allow us to characterize in detail the Indian monsoon history from 25.50 ka B. P. to 24.76 ka B. P. and 24.38 ka B. P. to 22.42 ka B. P. (sample section between 99.5 mm and 437.0 mm).Our new δ18O record suggests that the total duration of H2 termination spans for 844±3 years (error is determined by the annual fluorescent lamination counting). The termination of the event occurred from 24.280±0.028 ka B. P. to 23.436±0.028 ka B. P. inferred by a δ18O gradual shift of ca. 1.9‰. This process incorporates two negative excursions, from 24.28 ka B. P. to 24.17 ka B. P. and 23.90 ka B. P. to 23.44 ka B. P. and a relatively stable period from 24.17 ka B. P. to 23.90 ka B. P., superimposed on the termination trend are a number of centennial-decadal scale oscillations. The H2 Event in our record coincides within uncertainties with stalagmite records in the East Asian monsoon domain and ice core records from Greenland. Our δ18O record during the H2 Event, compared with existing records from high and low latitudes, suggests:(1) A large amount of fresh water released into the North Atlantic Ocean weakened the Atlantic Meridional Overturning Circulation, thus reduced temperature in north high latitude and shifted the Intertropical Convergence Zone southward; the signal was propagated to the Asian monsoon domain through the Westerlies; (2) The long and gradual termination of the H2 Event may be causally linked to the gradual warming in Antarctica; (3) Changes in low-latitude and the Tibetan Plateau may have a critical response/feedback on the event, thus further model simulations and more high-resolution H2 records are critical to test these hypothesis. In addition, our precise δ18O time series may provide new important constraints on the climate model simulation and the causal link of the H2 Event between high-low latitude climate changes. 2019, Vol.39

