深海底栖有孔虫氧同位素记录表明晚第四纪以来全球冰量存在轨道尺度的周期性波动,主要表现为北半球高纬冰盖的较长时间逐渐累积和短时间的快速消解[1]。基于米兰科维奇理论[2],前人普遍认为这与北半球高纬夏季太阳辐射的周期性波动密切相关[3~6],但频谱分析表明两者的主导周期存在明显差别:深海底栖有孔虫氧同位素记录以10万年的‘冰量’周期和4万年的斜度周期为主[1],且在中更新世革命(Middle-Pleistocene Transition,简称MPT)时(约120万年~ 70万年前)存在主导周期从4万年向10万年的逐渐过渡[7~8],而北半球高纬夏季太阳辐射则以2万年的岁差周期为主[9]。其次,并不是每一次北半球高纬夏季太阳辐射的上升都能导致冰盖的快速消解(冰消期),从而促使全球气候进入间冰期[10]。造成这种差异的原因很有可能是地球内部过程对太阳辐射变化的调谐作用,但什么因素导致了冰期-间冰期的快速转换仍然存在争议[11]。
针对有孔虫氧同位素记录的冰量变化与太阳辐射强度变化存在不同主导周期的问题,前人主要有以下几种看法:第一种是哈佛大学Huybers等[12~15]提出的太阳辐射强度和太阳辐射累计时间相互抵消,或者称为夏季太阳辐射总量变化:根据开普勒第二定律,当北半球夏季出现在地球处于近日点时,夏季的持续时间也会相应地变短,最终导致北半球夏季接受的总太阳辐射并无明显变化。而地球斜度的变化则会直接影响到某一纬度夏季太阳辐射总量的变化。Huybers[15]认为与夏至日太阳辐射强度相比,北半球冰量对夏季太阳辐射总量更敏感,因而具有显著的4万年斜度周期。当然,岁差直接驱动的夏至日太阳辐射强度变化也有可能影响到冰消期开始的具体时间。例如,当地球偏心率较大时,夏至日太阳辐射强度在轨道时间尺度上变化的振幅增大,这更容易导致冰消期的开始[15]。第二种是哥伦比亚大学Raymo等[16]提出的南北两极冰盖生长相互抵消:认为南北两极的冰盖生长都受高纬夏季太阳辐射强度控制而具有显著的2万年岁差周期,但由于南北半球高纬夏季太阳辐射在岁差周期上的相位完全相反,使得其对全球冰量的作用相互抵消,而4万年斜度周期则被凸显出来。第三种是弗吉利亚大Ruddiman[17]提出的大气CO2的反馈作用:冰芯记录表明大气CO2在过去80万年以来存在于冰量变化类似的4万年和10万年周期性变化[18~19]。由于存在大气CO2的反馈作用,导致4万年周期在冰量变化中被放大。第四种是Cheng等[20~21]提出的岁差直接驱动作用:利用石笋氧同位素记录对北半球高纬气候变化的快速响应和铀系绝对定年手段,研究者发现至少过去64万年以来,每一次冰消期的开始都发生在北纬65°夏至日太阳辐射强度上升阶段。北纬65°夏至日太阳辐射强度的快速上升可能导致冰盖的加速崩解,通过调节海洋和大气过程影响全球碳循环,造成大气CO2含量快速上升,从而驱动了冰消期的开始[21]。虽然有孔虫氧同位素记录的冰量变化与太阳辐射强度变化存在不同的主导周期,但是冰量变化仍然受太阳辐射强度变化所驱动。以上这些假说都存在一定的问题。例如,Raymo等[16]认为的南北两极冰盖变化相互抵消所导致的全球冰量变化具有4万年周期,但最近的研究[22~24]指出南北两极冰盖可能存在相互独立的演化历史。
深海氧同位素记录从4万年周期向10万年的过渡,也就是中更新世革命,则再一次挑战了传统的米兰科维奇理论[2]。由于在中更新世革命前后,地球轨道参数并无明显变化[9],因此无法用太阳辐射本身的变化去解释这种4万年周期向10万年周期的逐渐转变问题。前人相继提出了很多假说,例如俄勒冈州立大学的Clark等[7]认为这种周期的转变是由于北半球高纬冰盖对底部基岩的逐步侵蚀,导致了在中更新世时底部基岩从沉积岩石基底向结晶岩石基底的转变,从而能够承载更大的冰盖,冰盖的快速消融则可能会跳过其中几个太阳辐射上升期,造成了中更新世革命后冰盖的准10万年周期性变化。由于缺乏可靠的地质记录,这种解释很难得到验证。最近的研究指出[25],冰盖的快速消融与冰盖范围和太阳辐射强度都有关,中更新世革命周期的转变可能与冰盖消融所需要的有效能量增加有关。
黄土高原(图 1)巨厚的风尘堆积序列为我们研究区域与全球气候变化提供了宝贵的材料[27~29]。第四纪以来的黄土沉积最明显的特征是黄土与古土壤的交替出现[30~31],与之对应的是全球气候的冰期-间冰期循环[32]。冰期时,由于北半球高纬冰盖的逐步扩大,西伯利亚高压得到增强并向南移动,这使得东亚冬季风环流也得到增强,处于下风向的黄土高原风尘的沉积速率和粒度显著增加[33~36];间冰期的情况则正好与之相反。因此,黄土高原黄土的粒度组成很好地记录了东亚冬季风的强弱[23, 32, 37~39],从而与北半球高纬冰盖大小有着直接的联系。但东亚夏季风的演化仍存在很大的争议[21, 26, 30, 38, 40~48],其中最突出的问题是黄土记录(如磁化率[32, 49]等)与石笋氧同位素记录的不一致:在冰期-间冰期尺度上,黄土磁化率具有与全球冰量变化类似的10万年和4万年周期[38],而石笋氧同位素记录则以2万年的岁差周期为主[21]。由于磁化率与土壤中的铁磁性矿物含量直接相关[50],冰期-间冰期黄土沉积速率的变化会对磁化率产生影响[51],因此磁化率很有可能并不是东亚夏季风的唯一函数。石笋氧同位素则可能反映了大尺度的水汽循环[21, 44],或者是东亚夏季风和印度季风共同作用的结果[52~54],因而并不能准确记录东亚夏季风强度。

|
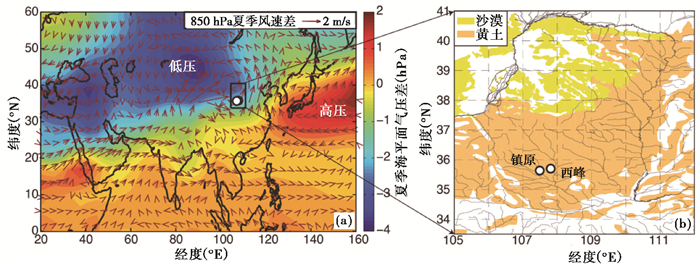
图 1 CESM1模拟的高斜度(24.5°)和低斜度(22.1°)之间的风场差异和海平面气压差异[26]以及采样地点 Fig. 1 CESM1 Modelresults of summer season sea-level pressure and 850 hPa horizontal wind fields between high(24.5°) and low(22.1°)obliquity[26] and the study sites |
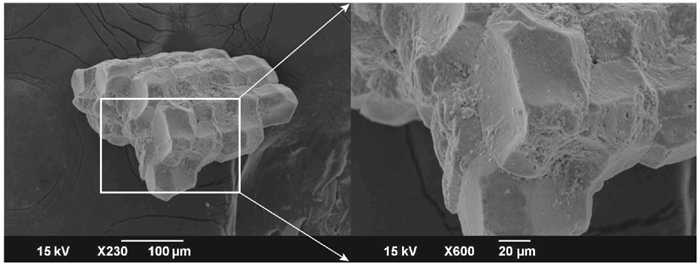
最近的研究发现,黄土中一类纯净的次生碳酸盐,即生物微钙体(图 2)的微量元素组成可以用于定量重建东亚夏季降水量的变化[26, 55]。生物微钙体的微量元素组成反映了土壤水溶液的瑞利分馏程度[55],其氧同位素组成则指示了生物微钙体形成于夏季[26, 56]。因此,生物微钙体微量元素组成与东亚夏季降水量存在直接的联系[55]。利用生物微钙体Sr/Ca比值重建的东亚夏季降水变化具有很强的4万年斜度周期,结合气候模式的模拟结果,研究者认为这与北半球中高纬度和低纬度之间的夏季太阳辐射差异有关[26]。因此,黄土沉积同时记录了冰量信息(黄土粒度)和地球轨道斜度变化(生物微钙体Sr/Ca夏季降水量),两者的结合为探讨斜度变化与冰期-间冰期北半球高纬冰量变化之间的关系提供了一种可靠的途径。

|
图 2 生物微钙体SEM图片 Fig. 2 Microcodiumunder scanning electron microscope(SEM) |
本文利用最近发表的过去1.5 Ma以来的高分辨率生物微钙体Sr/Ca夏季降水记录[26],结合统计分析手段,详细探讨了地球斜度变化与全球冰量变化之间的相位关系,揭示了第四纪快速冰消期的开始与地球斜度的直接关系,这对于理解第四纪冰期-间冰期气候旋回具有重要的指示意义。
1 材料与方法 1.1 样品采集本研究共采集了两个高分辨率黄土-古土壤剖面。西峰剖面(35°45′N,107°47′E)位于黄土高原中部(图 1),属于典型的黄土-古土壤剖面之一[51]。土壤样品在野外按照5 cm的分辨率进行采集,从S0到S20一共采集了120 m,共计约2400个样品。同时,在西峰剖面以西约80 km处的镇原剖面(35°43′N,107°12′E)按照5 cm的分辨率采集了一个自S5以来的平行剖面(图 1),共计约1000个样品。两个剖面的磁化率记录具有很好的一致性。
1.2 生物微钙体挑选和微量元素分析黄土-古土壤样品经烘干后取约300 g用于生物微钙体的挑选。首先将样品用去离子水浸泡约30 min,使得块状样品充分分散。然后过200目尼龙筛,得到大于75 μm的组分。生物微钙体粒径约100 μm到300 μm,具有典型的细胞状结构[55](图 2),易于在双目镜下进行挑选。从大于75 μm的组分中,每个样品挑选约20粒生物微钙体。经去离子水润洗3次之后,溶解在1 ml 0.03 mol/L的硝酸中。微量元素组成是在ICP-OES上分析的。溶解后的样品首先取10μL稀释20倍测定Ca含量,然后根据测试结果将原样Ca浓度调节至40 mg/kg后上机测试。对于实验室内部标准的长期监测结果表明Mg/Ca和Sr/Ca的分析精度分别优于5 %和3 %。
1.3 年龄模式西峰剖面的初始年龄模式是将黄土-古土壤转换时粒度的快速变化和LR04氧同位素记录[1]的冰期-间冰期转化对应起来,黄土和古土壤内部的年龄根据线性插值得到。与轨道调谐得到的年龄模式相比[38],该方法可以避免讨论周期问题时可能存在的循环论证。镇原剖面的年龄则通过将镇原剖面磁化率曲线调谐到西峰剖面磁化率曲线得到。据此得到的西峰剖面底部年龄为1.5 Ma,镇原剖面底部年龄为0.48 Ma。
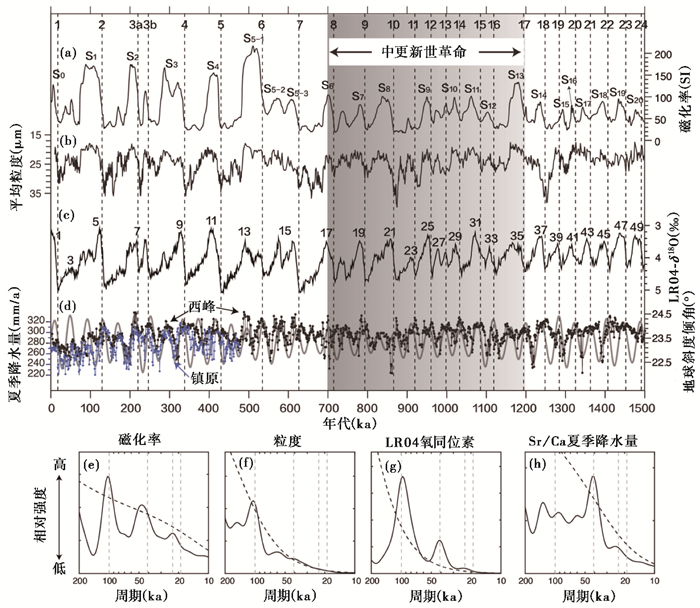
2 结果与讨论 2.1 斜度驱动东亚夏季风变化古土壤层S5以来(约0.48 Ma)西峰和镇原剖面的生物微钙体Sr/Ca夏季降水记录具有很好的一致性(图 3),这表明生物微钙体Sr/Ca夏季降水记录能够代表区域夏季降水的变化。与黄土磁化率等夏季风气候替代指标[30, 57~67]和石笋氧同位素记录[20~21, 41, 68]不同,过去1.5 Ma以来的生物微钙体Sr/Ca夏季降水记录具有典型的4万年斜度周期,其变化也与地球轨道斜度变化基本同步(图 3)。

|
图 3 过去1500 ka以来的黄土记录与深海氧同位素记录对比 (a)西峰剖面磁化率记录;(b)西峰剖面平均粒度变化[38];(c)LR04深海氧同位素记录[1],数字为深海氧同位素间冰期(阶)序号;(d)西峰和镇原剖面生物微钙体Sr/Ca夏季降水量记录[26]和地球轨道斜度[9];(e~h)黄土记录和深海氧同位素记录频谱分析结果(a~d)虚线和图上方数字为冰消期序号;(e~h)虚线代表几个典型的周期:10万年、4.1万年、2.3万年和1.9万年 Fig. 3 Loessrecords in comparison with deep-sea benthic oxygen isotopic record for the last 1.5 million years.(a)Magnetic susceptibility record from Xifeng section; (b)Mean grain size record from Xifeng section[38]; (c)LR04 benthic oxygen isotopic record[1], and numbers represent different interglacials (interstadials) or Marine Oxygen Isotope Stage; (d)MicrocodiumSr/Cabased summer precipitation reconstruction from Xifeng and Zhenyuan sections[26] in comparison with obliquity[9]; (e~h)Spectral analysis of the loess records and LR04 record. Dashed lines marked with numbers in(a~d)represent different deglaciations while dashed lines in(e~h)denote different typical periods(100-ka, 41-ka, 23-ka and 19-ka) |
研究者认为这可能与东亚地区特殊的海陆分布格局有关[26]。热带季风可能受到太阳辐射变化所导致的海陆热力差异变化直接驱动,但东亚内陆主要分布在中高纬度地区,而作为水汽源区的海洋则主要处于低纬度地区,斜度变化所引起的太阳辐射的纬向重新分布会使得处于不同纬度的地区受热情况发生不同程度的变化[9]。由于处于低纬度的海洋对斜度变化并不敏感,而斜度变高会使得处于中高纬的东亚大陆在夏季时更靠近太阳,从而接收到更多的太阳辐射,导致东亚大陆相对于海洋变暖,海陆热力差异进一步增大,东亚夏季风环流增强[26]。天文轨道计算[69~70]发现过去1.5 Ma北纬45°与北纬25°之间的夏至日太阳辐射强度梯度与地球轨道斜度变化几乎同步(图 4),这表明斜度通过控制东亚地区高低纬辐射差异从而直接影响了东亚夏季风强度。这一结果与气候模式的模拟结果[26]也基本一致。模拟结果表明,当地球处于较高斜度时,位于亚洲内陆的低压中心和位于北太平洋的高压中心都得到显著增强,与之对应的风场强度也明显增加[26](图 1)。因此,在同一记录载体中同时存在着冰量记录(黄土粒度组成)和地球轨道斜度记录(生物微钙体Sr/Ca夏季降水记录),这给探讨斜度与冰量变化的关系提供了可能。

|
图 4 过去1500 ka北纬45°与北纬25°之间的夏至日太阳辐射强度梯度与地球轨道斜度变化[70] Fig. 4 Evolutionof obliquity and boreal insolation differences between 45°N and 25°N at the summer solstice over the past 1500 thousand years[70] |
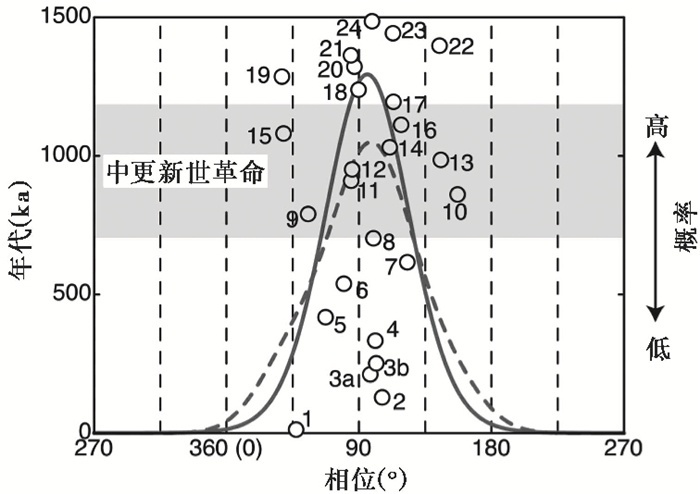
在认识到斜度对东亚夏季降水的直接控制作用后,本文首先将基于生物微钙体Sr/Ca比值重建得到的夏季降水记录与地球轨道斜度调谐到一起:高(低)夏季降水与高(低)斜度值一一对应。据此得到的年龄模式与初始年龄模式差别不大(图 3)。通过对比,我们发现过去1.5 Ma以来冰消期时粒度的快速变细总是发生在夏季降水处于极高值的时候。通过计算黄土-古土壤转换时粒度的突变在调谐后的生物微钙体Sr/Ca降水记录上的位置,我们得到了冰消期与斜度变化的相位关系。为了避免千年尺度的快速波动对结果产生影响,我们首先以41±3 ka的窗口大小对生物微钙体Sr/Ca降水记录进行滤波处理,得到与地球轨道斜度基本一致的纯41 ka周期变化。然后人为定义相位关系,降水最大值(斜度最大值)为90°,降水最小值(斜度最小值)为180°(0°)。选择粒度快速变化的中值点作为冰消期在黄土中的记录,计算其在生物微钙体Sr/Ca降水记录上的相位值大小,据此得到冰消期所处的斜度变化位置。角度数据拟合结果表明过去1.5 Ma以来几乎所有的冰消期都发生在地球处于高斜度的时候(96°±29°) (图 5)。利用瑞利检验(Rayleigh test)、综合检验(Omnibus test)和饶氏空间检验(Rao's spacing test)[71],数据拟合结果的p值都小于0.001,这进一步证实了高斜度与冰消期的对应关系。

|
图 5 冰消期在降水斜度周期上的相对相位变化 数字代表不同的冰消期序号(见图 3);冰消期与斜度的相位关系定义为粒度和磁化率从黄土向古土壤快速转变时所处的降水变化(经41±3 ka窗口滤波后)位置;降水最大值为90°,最小值为180°(0°)虚线为基于核密度估计得到的高斯包罗宽度为45°相位数据的正态分布;实线为基于冯米塞斯分布(也称为圆正态分布)的拟合结果[71],拟合得到的平均相位值为96°±29° Fig. 5 Phaseof glacial terminations in the obliquity band of precipitation. Terminations are labeled by sequential numbers(see Fig. 3). The phase position of the glacial terminations is constrained by rapid shifts of grain size and magnetic susceptibility to filtered precipitation in the obliquity band(41±3 ka)in Fig. 3. For the phase determination, the filtered precipitation maximum is defined as 90°and minimum as 180°.Dashed curve shows the kernel density applied to a circular data of phase distribution using a Gaussian envelope with width(2×standard deviation)of 45°, indicating a normal-like global distribution. The solid curve fits the phase distribution to von Mises distribution[71], a circular analogue of the normal distribution, which results in a mean value of 96°±29° |
斜度对于冰量的控制可能反映在以下两个方面:其一是对冰盖质量平衡的直接控制作用,与米兰科维奇理论提出的北纬65°夏至日太阳辐射强度[2]相比,Huybers等[12, 15]提出的夏季太阳辐射总量对于冰盖的质量平衡可能更为重要。这可能与夏季太阳辐射总量直接控制了冰盖的消融速度有关[72]。其二是斜度通过控制不同纬度的海洋和大气过程[17, 73~75],进而影响到冰盖的质量平衡。例如,除温度外,充足的水汽供给对于冰盖的生长也显得尤为重要。当地球处于高斜度时,高纬和热带之间的夏季温度差异变小,这不利于水汽从热带海洋向高纬传输,进一步加速了冰盖的消融[74~75]。
2.3 对中更新世革命的指示意义中更新世革命前,几乎每一次斜度高值都能导致冰消期的发生,但中更新世革命后,并不是每一次地球轨道处于高于平均斜度时都会导致冰消期的发生,例如,在过去1 Ma中,25次斜度峰值中有12次被跳过了(图 3)。中更新世革命前后,冰消期在降水斜度周期上的相位也发生了明显变化(图 5)。中更新世革命以前,虽然大部分冰消期都发生在地球轨道斜度处于较高值时(约90°),但少数冰消期发生时(如倒数第19次和第22次冰消期,见图 3和图 5),地球轨道斜度值都较低(< 45°或> 135°),这可能与岁差驱动的夏至日太阳辐射强度变化有关,虽然岁差变化本身并不能导致冰消期的开始,但其振幅的变化可能影响冰消期在斜度周期上的开始时间[14]。而中更新世革命后,所有的冰消期(末次冰消期除外)都发生在地球轨道斜度处于较高值时(约90°) (见图 3)。这表明中更新世革命后,冰消期的发生对夏季太阳辐射总量的依赖受岁差变化的影响变小。这一方面可能与冰消期发生时所需要的有效能量增加有关[25],另一方面也可能与冰期时北半球高纬冰盖范围的变化有关[7]。最近的研究表明[25],冰消期的发生不仅需要较高的夏季太阳辐射总量,还需要冰盖的范围达到一定程度。因此,中更新世革命后,间冰期-冰期转换时冰盖的逐步生长过程中有可能会跳过其中一个甚至两个斜度高值,从而造成了中更新世革命前后气候旋回从4万年周期向准10万年周期的转变。
3 结论利用黄土沉积的粒度和生物微钙体Sr/Ca夏季降水记录,本研究将过去1.5 Ma以来北半球高纬冰量变化和地球轨道斜度变化在同一黄土-古土壤剖面中结合起来,避免了沉积年龄模式的较大误差对计算不同指标相对相位关系的影响。结果表明,第四纪冰消期的发生与地球轨道斜度存在密切联系,这可能与斜度对夏季太阳辐射总量变化和经向水汽循环的控制作用有关。
(1) 重建的过去1.5 Ma以来的高分辨率生物微钙体Sr/Ca夏季降水记录和气候模式模拟结果表明斜度通过控制夏季太阳辐射强度的纬向梯度从而影响海陆热力差异和东亚夏季风强度。
(2) 统计分析表明,过去1.5 Ma以来的冰消期都发生在地球轨道处于较高斜度时,这与斜度变化引起的高纬度夏季太阳辐射总量和纬向温度梯度变化导致的水汽运输过程变化有关。
(3) 中更新世革命后,冰消期在降水斜度周期上的相位发生了明显变化,这可能与冰盖消融所需的有效能量增加有关,从而导致了气候旋回从4万年周期向准10万年周期的转变。
因此,本文证明了第四纪冰消期与地球斜度变化的直接关系,对于理解第四纪冰期-间冰期气候旋回具有重要的指示意义。
致谢: 感谢审稿专家和编辑部杨美芳老师建设性的修改意见。
| [1] |
Lisiecki L E, Raymo M E. A Pliocene-Pleistocene stack of 57 globally distributed benthic δ18O records[J]. Paleoceanography, 2005, 20(1): 1-16. DOI:10.1029/2004PA00107 |
| [2] |
Milankovitch M M. Canon of Insolation and the Ice-age Problem(Beograd:Koniglich Serbische Akademie, 1941)English Translation by the Israel Program for Scientific Translations[J]. Washington D C:Published for the US Department of Commerce and the National Science Foundation, 1969, 1-633. |
| [3] |
Hays J D, Imbrie J, Shackleton N J. Variations in the Earth's orbit:Pacemaker of the ice ages[J]. Science, 1976, 194(4270): 1121-1132. DOI:10.1126/science.194.4270.1121 |
| [4] |
Broecker W S, Donk J. Insolation changes, ice volumes, and the O18 record in deep-sea cores[J]. Reviews of Geophysics, 1970, 8(1): 169-198. |
| [5] |
Imbrie J, Boyle E A, Clemens S C, et al. On the structure and origin of major glaciation cycles 1. Linear responses to Milankovitch forcing[J]. Paleoceanography, 1992, 7(6): 701-738. DOI:10.1029/92PA02253 |
| [6] |
Imbrie J, Imbrie J Z. Modeling the climatic response to orbital variations[J]. Science, 1980, 207(4434): 943-953. DOI:10.1126/science.207.4434.943 |
| [7] |
Clark P U, Archer D, Pollard D, et al. The Middle Pleistocene transition:Characteristics, mechanisms, and implications for long-term changes in atmospheric pCO2[J]. Quaternary Science Reviews, 2006, 25(23): 3150-3184. |
| [8] |
Elderfield H, Ferretti P, Greaves M, et al. Evolution of ocean temperature and ice volume through the mid-Pleistocene Climate Transition[J]. Science, 2012, 337(6095): 704-709. DOI:10.1126/science.1221294 |
| [9] |
Berger A. Long-term variations of caloric insolation resulting from the Earth's orbital elements[J]. Quaternary Research, 1978, 9(2): 139-167. DOI:10.1016/0033-5894(78)90064-9 |
| [10] |
Berger A. Interglacials of the last 800, 000 years[J]. Reviews of Geophysics, 2016, 54(1): 162-219. DOI:10.1002/2015RG000482 |
| [11] |
丁仲礼. 米兰科维奇冰期旋回理论:挑战与机遇[J]. 第四纪研究, 2006, 26(5): 710-717. Ding Zhongli. The Milankovitch theory of Pleistocene glacial cycles:Challenges and chances[J]. Quaternary Sciences, 2006, 26(5): 710-717. DOI:10.3321/j.issn:1001-7410.2006.05.005 |
| [12] |
Huybers P, Tziperman E. Integrated summer insolation forcing and 40, 000-year glacial cycles:The perspective from an ice-sheet/energy-balance model[J]. Paleoceanography, 2008, 23(1): 1-18. |
| [13] |
Huybers P, Wunsch C. Obliquity pacing of the Late Pleistocene glacial terminations[J]. Nature, 2005, 434(7032): 491-494. DOI:10.1038/nature03401 |
| [14] |
Huybers P. Combined obliquity and precession pacing of Late Pleistocene deglaciations[J]. Nature, 2011, 480(7376): 229-232. DOI:10.1038/nature10626 |
| [15] |
Huybers P. Early Pleistocene glacial cycles and the integrated summer insolation forcing[J]. Science, 2006, 313(5786): 508-511. DOI:10.1126/science.1125249 |
| [16] |
Raymo M E, Lisiecki L E, Nisancioglu K H. Plio-Pleistocene ice volume, Antarctic climate, and the global δ18O record[J]. Science, 2006, 313(5786): 492-495. DOI:10.1126/science.1123296 |
| [17] |
Ruddiman W F. Orbital changes and climate[J]. Quaternary Science Reviews, 2006, 25(23): 3092-3112. |
| [18] |
Monnin E, Indermühle A, Dällenbach A, et al. Atmospheric CO2 concentrations over the Last Glacial Termination[J]. Science, 2001, 291(5501): 112-114. DOI:10.1126/science.291.5501.112 |
| [19] |
Luthi D, Le Floch M, Bereiter B, et al. High-resolution carbon dioxide concentration record 650, 000-800, 000 years before present[J]. Nature, 2008, 453(7193): 379-382. DOI:10.1038/nature06949 |
| [20] |
Cheng H, Edwards R L, Broecker W S, et al. Ice age terminations[J]. Science, 2009, 326(5950): 248-252. DOI:10.1126/science.1177840 |
| [21] |
Cheng H, Edwards R L, Sinha A, et al. The Asian monsoon over the past 640, 000 years and ice age terminations[J]. Nature, 2016, 534(7609): 640-646. DOI:10.1038/nature18591 |
| [22] |
de Vernal A, Hillaire-Marcel C. Natural variability of Greenland climate, vegetation, and ice volume during the past million years[J]. Science, 2008, 320(5883): 1622-1625. DOI:10.1126/science.1153929 |
| [23] |
Hao Q, Wang L, Oldfield F, et al. Delayed build-up of Arctic ice sheets during 400, 000-year minima in insolation variability[J]. Nature, 2012, 490(7420): 393-396. DOI:10.1038/nature11493 |
| [24] |
Patterson M O, McKay R, Naish T, et al. Orbital forcing of the East Antarctic ice sheet during the Pliocene and Early Pleistocene[J]. Nature Geoscience, 2014, 7(11): 841-847. DOI:10.1038/ngeo2273 |
| [25] |
Tzedakis P C, Crucifix M, Mitsui T, et al. A simple rule to determine which insolation cycles lead to interglacials[J]. Nature, 2017, 542(7642): 427-432. DOI:10.1038/nature21364 |
| [26] |
Li T, Liu F, Abels H A, et al. Continued obliquity pacing of East Asian summer precipitation after the mid-Pleistocene transition[J]. Earth and Planetary Science Letters, 2017, 457: 181-190. DOI:10.1016/j.epsl.2016.09.045 |
| [27] |
Liu T, Ding Z. Chinese loess and the paleomonsoon[J]. Annual Review of Earth and Planetary Sciences, 1998, 26(1): 111-145. DOI:10.1146/annurev.earth.26.1.111 |
| [28] |
刘东生, 等. 黃土与环境[M]. 北京: 科学出版社, 1985: 1-200. Liu Tungsheng, et al. Loess and Environment[M]. Beijing: Science Press, 1985: 1-200. |
| [29] |
孙有斌, 郭飞. 中国黄土记录的季风快速变化[J]. 第四纪研究, 2017, 37(5): 963-973. Sun Youbin, Guo Fei. Rapid monsoon changes recorded by Chinese loess deposits[J]. Quaternary Sciences, 2017, 37(5): 963-973. |
| [30] |
An Z, Kukla G J, Porter S C, et al. Magnetic susceptibility evidence of monsoon variation on the Loess Plateau of Central China during the last 130, 000 years[J]. Quaternary Research, 1991, 36(1): 29-36. DOI:10.1016/0033-5894(91)90015-W |
| [31] |
Ding Z, Yu Z, Rutter N, et al. Towards an orbital time scale for Chinese loess deposits[J]. Quaternary Science Reviews, 1994, 13(1): 39-70. DOI:10.1016/0277-3791(94)90124-4 |
| [32] |
Heller F, Liu Tungsheng. Magnetism of Chinese loess deposits[J]. Geophysical Journal of the Royal Astronomical Society, 1984, 77(1): 125-141. DOI:10.1111/j.1365-246X.1984.tb01928.x |
| [33] |
Ding Z, Liu T, Rutter N W, et al. Ice-volume forcing of East Asian winter monsoon variations in the past 800, 000 years[J]. Quaternary Research, 1995, 44(2): 149-159. DOI:10.1006/qres.1995.1059 |
| [34] |
鹿化煜, 安芷生. 黄土高原黄土粒度组成的古气候意义[J]. 中国科学(D辑), 1998(3): 278-283. Lu Huayu, An Zhisheng. The paleoclimatic significance of grain size distribution of loess deposits in the Chinese Loess Plateau[J]. Science in China(Series D), 1998(3): 278-283. DOI:10.3321/j.issn:1006-9267.1998.03.002 |
| [35] |
Xiao J, Porter S C, An Z, et al. Grain size of quartz as an indicator of winter monsoon strength on the Loess Plateau of Central China during the last 130, 000 yr[J]. Quaternary Research, 1995, 43(1): 22-29. DOI:10.1006/qres.1995.1003 |
| [36] |
鹿化煜, 安芷生. 洛川黄土粒度组成的古气候意义[J]. 科学通报, 1997, 42(1): 67-69. Lu Huayu, An Zhisheng. The paleoclimatic significance of grain size distribution of the Luochuan loess deposits[J]. Chinese Science Bulletin, 1997, 42(1): 67-69. |
| [37] |
An Z, Kukla G, Porter S C, et al. Late Quaternary dust flow on the Chinese Loess Plateau[J]. Catena, 1991, 18(2): 125-132. DOI:10.1016/0341-8162(91)90012-M |
| [38] |
Sun Y, Clemens S C, An Z, et al. Astronomical timescale and palaeoclimatic implication of stacked 3.6-Myr monsoon records from the Chinese Loess Plateau[J]. Quaternary Science Reviews, 2006, 25(1-2): 33-48. DOI:10.1016/j.quascirev.2005.07.005 |
| [39] |
杨石岭, 丁仲礼. 黄土高原黄土粒度的空间变化及其古环境意义[J]. 第四纪研究, 2017, 37(5): 934-944. Yang Shiling, Ding Zhongli. Spatial changes in grain size of loess deposits in the Chinese Loess Plateau and implications for palaeoenvironment[J]. Quaternary Sciences, 2017, 37(5): 934-944. |
| [40] |
Ao H, Dekkers M J, Xiao G, et al. Different orbital rhythms in the Asian summer monsoon records from North and South China during the Pleistocene[J]. Global and Planetary Change, 2012, 80-81: 51-60. DOI:10.1016/j.gloplacha.2011.09.012 |
| [41] |
Wang Y, Cheng H, Edwards R L, et al. Millennial-and orbital-scale changes in the East Asian monsoon over the past 224, 000 years[J]. Nature, 2008, 451(7182): 1090-1093. DOI:10.1038/nature06692 |
| [42] |
Clemens S C, Prell W L, Sun Y. Orbital-scale timing and mechanisms driving Late Pleistocene Indo-Asian summer monsoons:Reinterpreting cave speleothem δ18O[J]. Paleoceanography, 2010, 25(4): 1-19. |
| [43] |
Caley T, Malaizé B, Zaragosi S, et al. New Arabian Sea records help decipher orbital timing of Indo-Asian monsoon[J]. Earth and Planetary Science Letters, 2011, 308(3-4): 433-444. DOI:10.1016/j.epsl.2011.06.019 |
| [44] |
Caley T, Roche D M, Renssen H. Orbital Asian summer monsoon dynamics revealed using an isotope-enabled global climate model[J]. Nature Communications, 2014, 5: 5371-5376. DOI:10.1038/ncomms6371 |
| [45] |
An Zhisheng, Clemens S C, Shen J, et al. Glacial-interglacial Indian summer monsoon dynamics[J]. Science, 2011, 333(6043): 719-723. DOI:10.1126/science.1203752 |
| [46] |
Thomas E K, Clemens S C, Prell W L, et al. Temperature and leaf wax δ2H records demonstrate seasonal and regional controls on Asian monsoon proxies[J]. Geology, 2014, 42(12): 1075-1078. DOI:10.1130/G36289.1 |
| [47] |
Thomas E K, Clemens S C, Sun Y, et al. Heterodynes dominate precipitation isotopes in the East Asian monsoon region, reflecting interaction of multiple climate factors[J]. Earth and Planetary Science Letters, 2016, 455: 196-206. DOI:10.1016/j.epsl.2016.09.044 |
| [48] |
Wen X, Liu Z, Wang S, et al. Correlation and anti-correlation of the East Asian summer and winter monsoons during the last 21, 000 years[J]. Nature Communications, 2016, 7: 1-7. |
| [49] |
Zhou L P, Oldfield F, Wintle A G, et al. Partly pedogenic origin of magnetic variations in Chinese loess[J]. Nature, 1990, 346: 737-739. DOI:10.1038/346737a0 |
| [50] |
Maher B. Characterisation of soils by mineral magnetic measurements[J]. Physics of the Earth and Planetary Interiors, 1986, 42(1-2): 76-92. DOI:10.1016/S0031-9201(86)80010-3 |
| [51] |
Kukla G, Heller F, Liu X. M, et al. Pleistocene climates in China dated by magnetic susceptibility[J]. Geology, 1988, 16(9): 811-814. DOI:10.1130/0091-7613(1988)016<0811:PCICDB>2.3.CO;2 |
| [52] |
Pausata F S R, Battisti D S, Nisancioglu K H, et al. Chinese stalagmite δ18O controlled by changes in the Indian monsoon during a simulated Heinrich event[J]. Nature Geoscience, 2011, 4(7): 474-480. DOI:10.1038/ngeo1169 |
| [53] |
Beck J W, Zhou W, Li C, et al. A 550, 000-year record of East Asian monsoon rainfall from 10Be in loess[J]. Science, 2018, 360(6391): 877-881. DOI:10.1126/science.aam5825 |
| [54] |
Maher B A. Palaeoclimatic records of the loess/palaeosol sequences of the Chinese Loess Plateau[J]. Quaternary Science Reviews, 2016, 154: 23-84. DOI:10.1016/j.quascirev.2016.08.004 |
| [55] |
Li T, Li G. Incorporation of trace metals into microcodium as novel proxies for paleo-precipitation[J]. Earth and Planetary Science Letters, 2014, 386: 34-40. DOI:10.1016/j.epsl.2013.10.011 |
| [56] |
Zhang Z, Li G, Yan H, et al. Microcodium in Chinese loess as a recorder for the oxygen isotopic composition of monsoonal rainwater[J]. Quaternary International, 2018, 464: 364-369. DOI:10.1016/j.quaint.2017.10.050 |
| [57] |
Guo Z, Biscaye P, Wei L, et al. Summer monsoon variations over the last 1.2 Ma from the weathering of loess-soil sequences in China[J]. Geophysical Research Letters, 2000, 27(12): 1751-1754. DOI:10.1029/1999GL008419 |
| [58] |
Ding Z L, Yang S L, Sun J M, et al. Iron geochemistry of loess and red clay deposits in the Chinese Loess Plateau and implications for long-term Asian monsoon evolution in the last 7.0 Ma[J]. Earth and Planetary Science Letters, 2001, 185(1-2): 99-109. DOI:10.1016/S0012-821X(00)00366-6 |
| [59] |
Ding Z L, Yang S L. C3/C4 vegetation evolution over the last 7.0 Myr in the Chinese Loess Plateau:Evidence from pedogenic carbonate δ13C[J]. Palaeogeography, Palaeoclimatology, Palaeoecology, 2000, 160(3-4): 291-299. DOI:10.1016/S0031-0182(00)00076-6 |
| [60] |
Chen J, Wang Y, Chen Y, et al. Rb and Sr geochemical characterization of the Chinese loess stratigraphy and its implications for palaeomonsoon climate[J]. Acta Geologica Sinica(English Edition), 2000, 74(2): 279-288. |
| [61] |
Sun Y, He L, Liang L, et al. Changing color of Chinese loess:Geochemical constraint and paleoclimatic significance[J]. Journal of Asian Earth Sciences, 2011, 40(6): 1131-1138. DOI:10.1016/j.jseaes.2010.08.006 |
| [62] |
Chen J, An Z, Head J. Variation of Rb/Sr ratios in the loess-paleosol sequences of Central China during the Last 130, 000 years and their implications for monsoon paleoclimatology[J]. Quaternary Research, 1999, 51(3): 215-219. DOI:10.1006/qres.1999.2038 |
| [63] |
Ji J, Balsam W, Chen J. Mineralogic and climatic interpretations of the Luochuan loess section(China)based on diffuse reflectance spectrophotometry[J]. Quaternary Research, 2001, 56(1): 23-30. DOI:10.1006/qres.2001.2238 |
| [64] |
Sun Y, Kutzbach J, An Z, et al. Astronomical and glacial forcing of East Asian summer monsoon variability[J]. Quaternary Science Reviews, 2015, 115: 132-142. DOI:10.1016/j.quascirev.2015.03.009 |
| [65] |
Liu W, Yang H, Sun Y, et al. δ13C values of loess total carbonate:A sensitive proxy for Asian summer monsoon in arid northwestern margin of the Chinese Loess Plateau[J]. Chemical Geology, 2011, 284(3-4): 317-322. DOI:10.1016/j.chemgeo.2011.03.011 |
| [66] |
刘丛强, 张劲. 黄土中CaCO3含量及其Sr同位素组成变化与古气候波动记录[J]. 科学通报, 1999, 44(10): 1088-1092. Liu Congqiang, Zhang Jing. The variations of CaCO3 contents and their Sr isotopic compositions of the loess deposits and records of paleoclimatic cycles[J]. Chinese Science Bulletin, 1999, 44(10): 1088-1092. DOI:10.3321/j.issn:0023-074X.1999.10.016 |
| [67] |
Rao Z, Zhu Z, Chen F, et al. Does δ13C carb of the Chinese loess indicate past C3/C4 abundance? A review of research on stable carbon isotopes of the Chinese loess[J]. Quaternary Science Reviews, 2006, 25(17-18): 2251-2257. DOI:10.1016/j.quascirev.2006.03.013 |
| [68] |
Wang Y J, Cheng H, Edwards R L, et al. A high-resolution absolute-dated Late Pleistocene monsoon record from Hulu cave, China[J]. Science, 2001, 294(5550): 2345-2348. DOI:10.1126/science.1064618 |
| [69] |
Paillard D, Labeyrie L, Yiou P. Macintosh program performs time-series analysis[J]. Eos, Transactions American Geophysical Union, 1996, 77(39): 379-379. |
| [70] |
Berger A, Loutre M F. Insolation values for the climate of the last 10 million years[J]. Quaternary Science Reviews, 1991, 10(4): 297-317. |
| [71] |
Berens P. CircStat:A MATLAB toolbox for circular statistics[J]. Journal of Statistical Software, 2009, 31(10): 1-21. |
| [72] |
Wunsch C. The spectral description of climate change including the 100 ky energy[J]. Climate Dynamics, 2003, 20(4): 353-363. DOI:10.1007/s00382-002-0279-z |
| [73] |
Lee S Y, Poulsen C J. Tropical Pacific climate response to obliquity forcing in the Pleistocene[J]. Paleoceanography, 2005, 20(4): 1-10. |
| [74] |
Mantsis D F, Lintner B R, Broccoli A J, et al. The response of large-scale circulation to obliquity-induced changes in Meridional Heating Gradients[J]. Journal of Climate, 2014, 27(14): 5504-5516. DOI:10.1175/JCLI-D-13-00526.1 |
| [75] |
Mantsis D F, Clement A C, Broccoli A J, et al. Climate feedbacks in response to changes in obliquity[J]. Journal of Climate, 2011, 24(11): 2830-2845. DOI:10.1175/2010JCLI3986.1 |
Abstract
Investigating the causal link between Earth's orbital parameters and Quaternary glacial-interglacial cycles remains one of the most important branches of paleoclimatic research. This is largely due to the discrepancies between the intensity of summer insolation in the precession band and Pleistocene glacial cycles in the obliquity and eccentricity bands. In this study, we have reconstructed proxy records that document both the Northern Hemisphere ice-sheet volume and the obliquity of Earth from the same loess-paleosol profile on the central Chinese Loess Plateau over the last 1.5 million years, enabling us to explore the potential connections between them. Loess-paleosol samples were collected every 5 cm at Xifeng(35°45'N, 107°47'E) and Zhenyuan(35°43'N, 107°12'E) sections, which can be well correlated to each other using magnetic susceptibility stratigraphy. Secondary carbonate samples(microcodium) were then picked out from the >75 μm fraction of the loess-paleosol samples. Previous studies have suggested that microcodium Sr/Ca ratio can be used as a regional measure of summer precipitation. The reconstructed paleo-precipitation records at Xifeng and Zhenyuan show consistent variations over the last 480 thousand years, confirming the reliability of microcodium Sr/Ca as a summer precipitation proxy. The summer precipitation records show a persistent obliquity cycle of the 41-ka over the last 1.5 million years, which can be attributed to the gradient of boreal summer insolation that modulates the thermal contrast between the Asian continent and surrounding oceans and thus the strength of East Asian summer monsoon. In the loess deposits, the position of terminations in the record can be precisely constrained by rapid shift in grain size and magnetic susceptibility. We find that the mid-points of the terminations are always associated with the peak precipitation. By tuning the summer precipitation to the obliquity periodicity, i.e., matching the peaks and valleys of the precipitation to the obliquity highs and lows, we determine the phase of the terminations in the obliquity band of the precipitation record. We find that the terminations always occurred at high obliquity during the past 1.5 million years, which lends support to the hypothesis of obliquity pacing of glacial terminations. By controlling the insolation integrated over the duration of the boreal summer season and influencing the meridional transport of moist air, obliquity has played a major role in regulating the ice age terminations since the Early Pleistocene. The gradual transition at the Middle-Pleistocene Transition(MPT) is likely a result of the increasing energy threshold that is required to melt the ice-sheet rapidly, causing one or two obliquity maxima being skimmed and explaining the quasi 100-ka cycles after the MPT. 2018, Vol.38
