2 中国地震局地质研究所, 地震动力学国家重点实验室, 北京 100029)
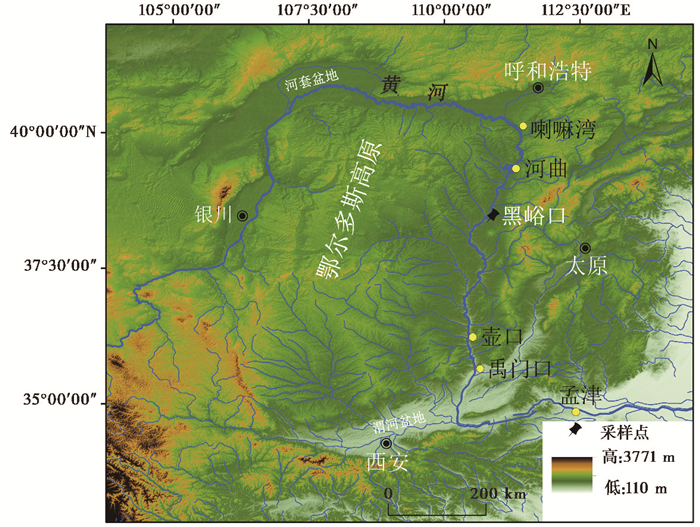
黄河起源于青藏高原东北部,向东流入渤海,以其巨大的输沙量著名。黄河流经中国黄土高原和鄂尔多斯高原东部,并形成了晋陕峡谷(图 1)。作为世界上最长的河流之一,黄河的演化一直是中国地貌学研究的一个热点问题。河流阶地是了解河流演化历史最直接的证据[1~2]。尽管黄河晋陕峡谷沿岸的河流阶地已经进行了广泛研究[3~16],在这些研究中主要应用了释光测年技术[17~19]、古地磁测年[20]和宇宙成因核素技术[21]等方法。但现有的阶地年代数据还不足以在该区域建立系列的阶地精确年代框架,例如:由于受到裂点迁移影响[4, 10],一些相同拔河高度的阶地有不同的形成年代。因此,对黄河不同地区的阶地进行更多的年代研究是非常有必要的。
|
图 1 鄂尔多斯高原数字高程图(DEM),图中标示了研究地点(黑峪口)和正文中提到的其他地点 Fig. 1 DEM showing the Yellow River, the Ordos Plateau and the locations of study section(Heiyukou)and other sites mentioned in the text |
光释光测年技术近年来的发展使其能够更加精确地测定河流阶地的形成年代[22~24]。与其他测年方法相比,光释光测年方法的主要优点是可以直接测定阶地沉积物中的矿物质。近年发展的一些释光测年技术如应用于石英的TT-OSL方法[25~27]、应用于钾长石的post-IR IRSL方法[28~34]等大大扩展了沉积物光释光测年上限。这些新技术或许可以用于测定黄河较高级阶地的形成年代,但是在将这些新技术应用于黄河高级阶地测年前,我们应该先检验它们的可靠性。同时,对相对传统的石英OSL-SAR方法在阶地堆积物中不同粒级石英上的应用的可靠性也需要进一步的探讨,因为同一级黄河阶地样品,用不同的光释光方法和不同粒级的石英颗粒会产生不同的光释光年龄[35~37]。在本研究中,我们对山西兴县与陕西神木县之间的黑峪口地区的二级黄河基座阶地上的堆积物(图 2a)进行了系统的释光测年研究,将不同的释光方法应用在粒级不同的矿物颗粒上,最后对各种释光方法得到的释光年龄的可靠性进行了系统的分析。
|
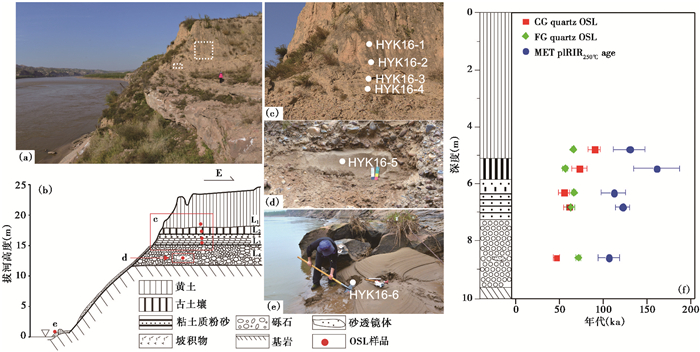
图 2 黑峪口二级黄河阶地剖面(a,b)、样品采集位置(c,d,e)以及剖面样品年龄与深度图(f) 图 2a中的虚线框表示图 2c与2d的大致位置 Fig. 2 Photographs showing the studied terrace section (a) and the sampling positions(c, d and e)(view is toward the north). Diagrams showing the lithology of the terrace section and sampling positions (b). The coarse-grained(CG)and fine-grained(FG)quartz OSL and coarse-grained feldspar MET-pIRIR250 ℃ ages are shown in (f). The dashed boxes in (a) indicate the positions of (c) and (d) |
鄂尔多斯高原海拔1050~1500 m,黄河在中游段由北向南沿着吕梁山西麓贯穿鄂尔多斯高原和黄土高原,形成了一个规模宏大的深切河谷——晋陕峡谷(图 1)。晋陕峡谷北起喇嘛湾,南至禹门口,并连接着河套地堑与渭河地堑[16]。在晋陕峡谷沿岸发育一系列基座阶地,阶地上堆积厚度不一的黄土。
我们在晋陕峡谷黑峪口地区(38°32′36.34″N,110°54′25.88″E) (图 1)的黄河两岸识别了至少5级基座阶地,本研究选取了其中的二级阶地(图 2a和2b)进行系统的光释光测年研究。黑峪口地区二级阶地上的河流堆积物的平均海拔约770 m,拔河高度12.6 m。阶地堆积物剖面在河流陡岸和附近的采砂场内均有发现,本文研究阶地的堆积物剖面约9.66 m,从上往下可分为4层:
第一层(5.10 m厚)是马兰黄土。沉积物相对松散,以灰黄色、发育垂直节理和块状构造为特点。在该层下部采集样品HYK16-1(图 2c),该样品的OSL年龄可限制下层河流沉积物的年龄下限。这是因为马兰黄土(< 71 ka)[38]作为风成沉积物通常可获得可靠的石英OSL年龄。
第二层(0.75 m厚)以浅红色粉砂质-粘土古土壤为主,中间夹4层粉砂质细砂,每小层厚约3~5 cm。该层发育土壤结构,在此处采集样品HYK16-2(图 2c),利用该样品确定古河漫滩最后一次河流沉积物的堆积年龄。因为该层主要是风成沉积,可利用该样品得到可靠的石英OSL年龄。
第三层(1.4 m厚)以灰色、具水平层理的河漫滩粉砂为主。该层夹3条红褐色泥质条带,泥质条带厚度约3~5 cm。在该层采集了两个OSL样品(HYK16-3和HYK16-4)(图 2c),可用于确定河漫滩沉积物的堆积年龄。
第四层(2.41 m厚)以砾石为主。砾石最大直径30 cm,主要由紫红色砂岩(59 %)和石灰岩(36 %)组成。这些砾石的磨圆度和球度都很好,指示其河流搬运性质。在该层发育着一个长67 cm,宽7.5 cm的砂透镜体,样品HYK16-5采自该砂透镜体内(图 2d)。由于砂镜体厚度不足30 cm,因此采集了砂透镜体外部周围的砂砾石样品(HYK16-5′)用来校正砂透镜体样品(HYK16-5)的伽马剂量率。样品HYK16-5的OSL年龄便是该基座阶地的形成年龄(河床底或基岩面停止下切的年代)。
基岩出露厚度大约12.6 m,主要由三叠纪的紫红色砂岩组成,层理发育,有泥岩夹层。由于风化作用,基岩表面很松散。我们采集了一个基岩样品,但并未测年,仅用来对比粗粒、细粒石英与基岩样品、标准样品的衰减曲线和灵敏度释光性质变化,以此说明细粒石英与粗粒石英的来源问题。为了评估河流样品的晒退情况,我们在黄河边采集了一个现代样品(HYK16-6)(图 2e),该样品可能是在上一次洪水时堆积形成的。
样品采集前考虑了注意样品的代表性和辐射场的均一性,并去掉剖面至少30 cm厚的表层,然后将不锈钢管(直径3.5 cm,长30 cm)水平方向打入新鲜剖面中。取出采样管时用铝箔塞紧采样管两端,用胶带将整个采样管密封并编号。随后,在所采集样品的周围采集少量样品装于密封袋内,用于测定含水量与U、Th、K、Rb含量。现代样品是取自河岸边20 cm深度以下的位置,利用直径为5 cm,长度为20 cm的管子采集。所有样品在采集时应尽量避光或选择剖面背光时间取样,密封时应尽量将样品密封紧实,以防止在运输过程中包裹的样品因为晃动发生扰乱。回到实验室后,应立即测定密封袋内样品的含水量,避免样品因放置过久水分流失过多。
2 测量方法 2.1 释光测量为避免光对样品的影响,所有样品都在红光暗室中处理。首先,将不锈钢管中的样品两端(各2 cm)可能曝光部分去除,取适量剩余部分的样品,分别用10 %盐酸和30 %双氧水除去样品中的碳酸盐和有机质。其次,根据已报道的本实验室的前处理方法[39]进行细粒(FG,4~11 μm)石英的提取。用多钨酸钠(密度:2.58 g/cm3)重液从> 11 μm的样品中提取出粗粒(CG)石英与粗粒钾长石组分[40]。HYK16-1、HYK16-2和HYK16-4这3个样品的粗粒石英和粗粒钾长石的粒径均是90~125 μm,HYK16-3和HYK16-6的粗粒石英和粗粒钾长石的粒径均是125~150 μm,HYK16-5的粗粒石英和粗粒钾长石的粒径均是150~200 μm。对于粗粒钾长石组分,用10 %的氢氟酸刻蚀40 min去除受过α辐照的颗粒外层,再用10 %盐酸去除反应过程中产生的氟化物,最后用清水洗至中性。对于细粒石英与粗粒石英组分,在室温下分别用饱和的氟硅酸溶液和40 %氢氟酸溶液刻蚀以去除样品中多余的长石和粗颗粒石英受过α辐照的颗粒外层,再用10 %盐酸去除反应生成的氟化物,最后用清水洗至中性。再次,为避免长石杂质对石英样品释光信号产生影响,对提取的石英颗粒进行纯度检验。将石英颗粒制片上机做红外检测,当样品的红外释光信号与OSL信号的比值< 3 %,则认为样品的石英纯度达到要求。否则重复上述氢氟酸处理过程一次。最后,细颗粒石英采用丙酮沉降法制片;粗颗粒石英与长石直接用硅胶将样品颗粒粘到直径为9.7 mm的铝片上,制成小片(涂抹面积是半径2 mm的范围)。
用单片再生剂量法(SAR)程序测量样品石英颗粒的等效剂量(De)[41]。在SAR法中,每个测片分别进行6~7个回合的测量,其中每个回合包括一个零剂量和一个重复的再生剂量。零剂量与自然信号的比值称为回授率(Recuperation),用来检测SAR每个循环结束时是否会将过多信号带入下一轮回。样品测量时将第一个再生剂量重复一次,两次再生剂量得到的光释光强度比值称为循环比(Recycling ratios)。SAR程序中的预热温度(220 ℃预热10 s)是通过剂量恢复实验确定的(见下文),而检测剂量的预热温度是160 ℃。在这里每个OSL信号测量前均加了一步红外激发[39, 42~43],这是因为粗粒石英中残余的长石颗粒并没有完全清除(见下文)。在每个循环最后,用280 ℃蓝光激发40 s,是为了减少转移至下一循环的残余剂量。
为了探究回授光释光(TT-OSL)应用在阶地沉积物的可行性及晒退能力,我们分别尝试使用Wang等[25~27]和Stevens等[44]的方法测定现代样品(HYK16-6)粗粒石英的回授光释光信号。在实验中,我们对测量步骤做了修改,每个测量步骤均采用了两组不同的再生剂量,第一组再生剂量是180 Gy、360 Gy、600 Gy、0 Gy和180 Gy,第二组再生剂量是3 Gy、6 Gy、30 Gy、0 Gy和3 Gy。预热条件是260 ℃预热10 s,检测剂量是6 Gy。在改自Wang等[25~27]的测量步骤中,激发时间是100 s,检测剂量的预热温度是220 ℃。在每个循环最后,用280 ℃蓝光激发10 s。在改自Stevens等[44]的测量步骤中,激发温度是125 ℃,激发时间是60 s。每个循环的最后,用280 ℃蓝光激发400 s。
样品中钾长石的等效剂量是利用红外后多步高温红外法(MET-pIRIR)测定的[31]。在本研究中,我们使用逐步升高的温度对样品进行6次红外激发,激发温度分别是50 ℃、100 ℃、150 ℃、200 ℃、250 ℃和290 ℃,激发时间是100 s。样品在320 ℃预热60 s,检测剂量是36 Gy。在每个循环最后,为了减少转移至下一次循环的残余剂量,对样品在320 ℃激发100 s。
所有光释光测量均在北京大学地表过程分析与模拟教育部重点实验室的热释光/光释光测量仪(Risø TL/OSL-DA-15)上进行,放射源是90Sr/90Y[45]。测量石英的蓝光信号(OSL),激发光源是蓝光二极管(LEDs)(λ=470±30 nm)[45]。激发出的光子通过U-340 (290~370 nm)滤光片进入EMI 9235QA型光电倍增管,在光电倍增管中光信号转化为电信号并通过电脑输出以检测OSL信号。测量钾长石的红外信号(IRSL信号),激发光源是红外光LEDs(λ=870±40 nm)。滤光片是由Schoot BG-39和Coming 7-59组合形成的(透射波长320~480 nm)。激发出的光子通过滤光片,进入EMI 9235QA型光电倍增管,在光电倍增管中光信号转化为电信号并通过电脑输出以检测IRSL信号。
2.2 剂量率测量样品的U、Th、K和Rb的含量检测是在中国原子能科学研究院通过中子活化分析技术完成的。由于采样剖面在采样前长时间暴露在空气中导致靠近剖面表面附近的样品部分变干,因此根据样品的岩性我们将样品HYK16-1~4的含水量设为10±5 %,砂透镜体样品HYK16-5设为5±5 %,现代样品(HYK16-6)的含水量在实验室测得为80 %;细粒石英的α值是0.038±0.003[46]。基于以上实验,我们利用在线的剂量和年龄计算器DRAC v1.2[47]计算样品年龄,同时可得宇宙射线的贡献值和转换因子。样品HYK16-5伽马剂量率的校正是应用Aitken[48]的叠加模型完成的。
3 结果 3.1 剂量率样品的U、Th、K和Rb含量测量结果及计算的有关剂量率列于表 1。结果表明,黄土和古土壤样品中的U、Th和K含量基本相同。砂透镜体样品(HYK16-5)中的U和Th含量相对较低,样品HYK16-5和砂砾石样品HYK16-5′的K含量相等,但前者的U和Th含量较低。经校正,样品HYK16-5的伽马剂量率约为1 Gy/ka,分别占粗粒石英和粗粒钾长石总剂量率的37 %和30 %。
| 表 1 黑峪口地区黄河阶地样品U、Th和K含量及计算的剂量率 Table 1 Summary of the dose rates for the samples in this study |
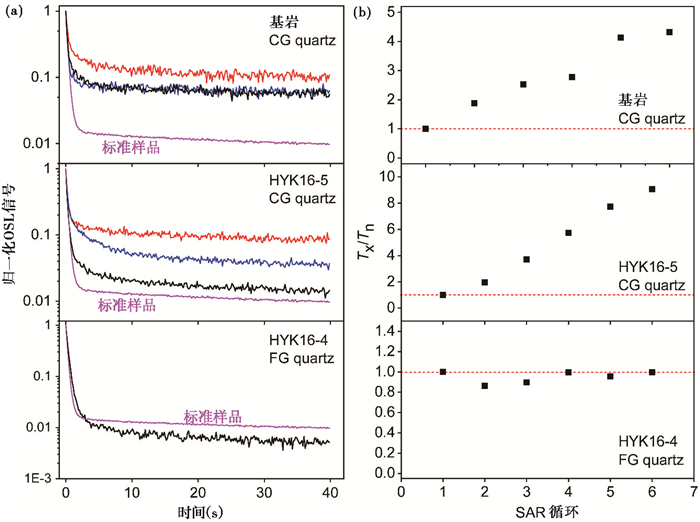
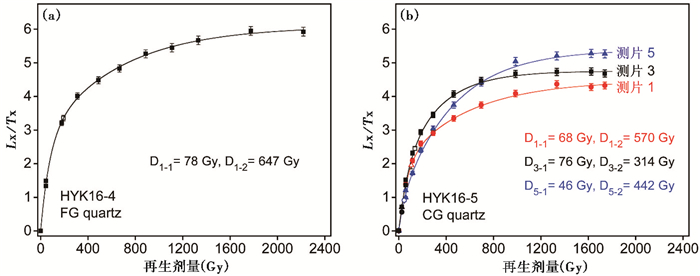
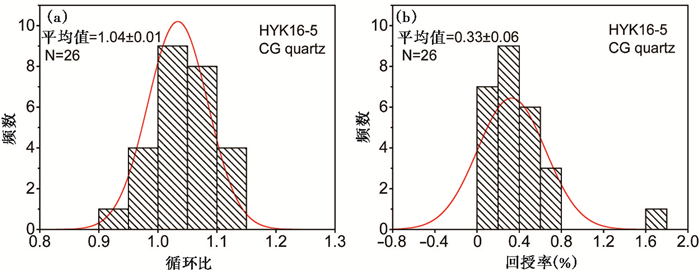
样品的细粒(FG)石英和粗粒(CG)石英的OSL衰减曲线见图 3a。结果表明,与Risø国家实验室的标准样品[49]比较,细粒石英和粗粒石英的OSL初始信号晒退都较快,相对地,粗粒石英含有更多的中组分和慢组分,且测片之间差异较大,而细粒石英的中组分和慢组分少于标准样品。细粒石英(图 4a)和粗粒石英(图 4b)的剂量响应曲线(DRC)可以用饱和双指数方程很好地拟合。一些粗粒石英测片中的OSL灵敏度随SAR测量循环而明显增大,这与基岩样品的OSL信号相似(图 3b)。样品HYK16-1~6的粗粒石英的平均灵敏度变化(T6/Tn)分别是2.1、6.5、7.3、6.4、6.6和5.6。然而,样品HYK16-5的粗粒石英测片中的循环比和回授率表明这些灵敏度变化已经被成功校正(图 5)。循环比和回授率分别是1.04±0.01和0.33±0.06 %,表明SAR方法适用于该样品。在SAR程序运行过程中,细粒石英的灵敏度却保持不变(图 3b)。细粒石英OSL信号在2000 Gy仍没有达到饱和,而粗粒石英显示测片之间具有不同的释光性质,图 4a和4b中也列出了两个样品的饱和特征剂量。
|
图 3 沉积物样品和基岩样品的自然信号衰减曲线(a)和在SAR测量过程中的灵敏度变化(b) 标准样品来自Risø国家实验室;Tx/Tn表示SAR循环中再生剂量的检测剂量的信号强度(Tx)与自然信号的检测信号强度(Tn)的比值 x表示SAR循环数(即x=1,2,3,4,5,6) Fig. 3 Natural SAR-OSL decay curves (a) and OSL sensitivity(Tx/Tn)change during SAR measurements with increasing SAR cycles (b) for three quartz aliquots of samples HYK16-4~5 and the bedrock. The standard sample comes from Risø. Tx/Tn represents the signal intensity ratio of the test does of regeneration dose to natural dose in SAR cycle. x represents the number of SAR cycle(x=1, 2, 3, 4, 5, 6) |
|
图 4 样品HYK16-4细粒(FG)石英(a)与HYK16-5粗粒(CG)石英(b)的生长曲线和饱和特征剂量 Lx/Tx代表经灵敏度校正后的自然信号强度 Fig. 4 Dose response curves for fine-grained (a) and coarse-grained (b) quartz extracts and their characteristic saturation doses. Lx/Tx represent the sensitivity-corected natural signals |
|
图 5 样品HYK16-5等效剂量的循环比(a)与回授率(b)的频率分布直方图 Fig. 5 Frequency distribution histograms of recycling ratios (a) and recuperation (b) for coarse-grained quartz from sample HYK16-5 |
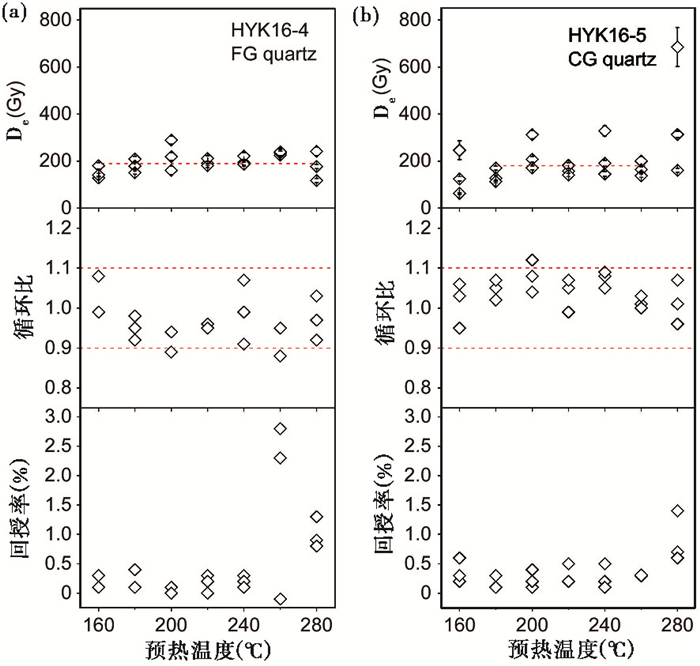
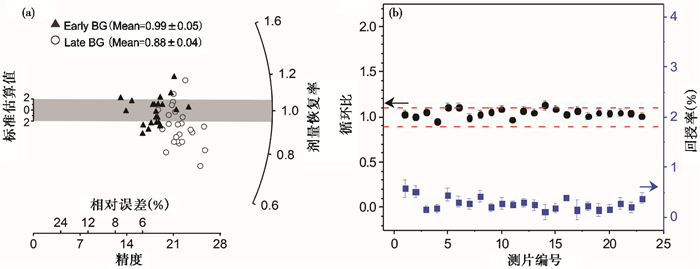
我们同样对样品HYK16-4的细粒石英和样品HYK16-5的粗粒石英做了预热坪实验(图 6)。预热温度是160~280 ℃,温度梯度是20 ℃。在每个预热温度下利用SAR程序测量3个测片。结果表明,粗粒石英和细粒石英的De值在180~280 ℃之间有一个明显的坪区。因此,本研究选择在220 ℃预热10 s作为石英样品测定De值的预热条件。为了进一步验证该预热条件的可靠性,本研究利用同样的程序分别对样品HYK16-4的细粒石英和HYK16-5的粗粒石英做剂量恢复实验[40],其中粗粒石英做24个测片(图 7),细粒石英做7个测片。在计算粗粒石英De值时,使用前背景(EBS)[50]得到的剂量恢复率是0.99±0.05,后背景得到的剂量恢复率是0.88±0.04。计算细粒石英De值时,使用前背景得到的剂量恢复率是1.16±0.03,后背景得到的剂量恢复率是1.11±0.03,两者基本一致。根据上述实验结果,在本研究中石英De测量的预热条件设定为220 ℃预热10 s,分别使用前背景和后背景计算粗粒石英和细粒石英的De值。
|
图 6 细粒样品HYK16-4 (a)与粗粒样品HYK16-5 (b)预热实验结果 Fig. 6 Results of preheat test on fine-grained (a) and coarse-grained (b) quartz grains |
|
图 7 样品(HYK16-5)粗粒石英剂量恢复实验 (a)剂量恢复率(Measured/Given dose ratio)辐射图,灰色条带区域代表范围是0.9~1.1的剂量恢复率:实心三角形代表信号值减去前背景(EBS)得到的De值,空心圆圈代表信号值减去后背景(LBS)得到的De值;(b)剂量恢复实验的循环比和回授率,每个数据点代表 1个测片 Fig. 7 Results of dose recovery tests on the CG quartz of sample HYK16-5. (a)Radial plot showing the ratio of measured to given dose. The grey shaded region is centered on a recovered to given dose ratio of one. The triangles(EBS)and circles(LBS)represent the results obtained using early and late background subtraction, respectively. (b)The recycling ratio and recuperation obtained in the tests. Each data point represents a result from a single aliquot |
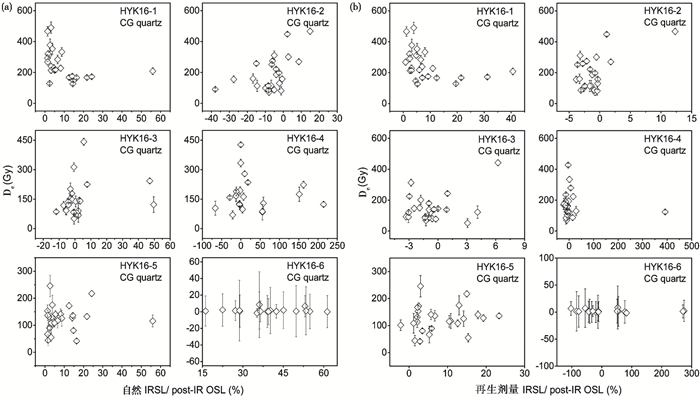
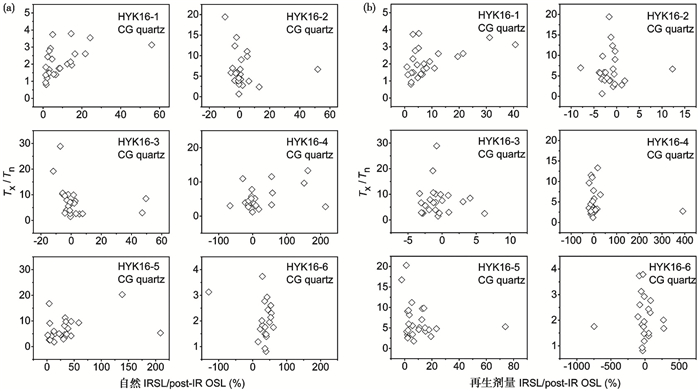
所有测片中IRSL与后红外post-IR OSL信号比值(图 8)表明粗粒石英中的长石颗粒基本被消除,但有的测片中有明显的IRSL信号,表明还有长石颗粒没有被去除。图 8也表明尽管部分测片中的IRSL/post-IR OSL比值较大,但其与De值没有相关性(除样品HYK16-1外)。样品HYK16-1中有4个IRSL/post-IR OSL比值高的测片,但其相对较低的De值对整个样品的平均De值的影响是可以忽略的。此外,粗粒石英灵敏度变化与IRSL/post-IR OSL比值的相关性见图 9,同样表明了长石残余量对石英灵敏度变化的影响是可以忽略的。
|
图 8 研究样品粗粒石英的De值与自然(a)和再生剂量(b)IRSL/post-IR OSL比的相关性 横轴的负值是由背景值的选择引起的,自然IRSL/post-IR OSL指的是自然的IRSL信号与post-IR OSL的比值,再生剂量IRSL/post-IR OSL指第一个再生剂量产生的信号与post-IR OSL的比值,每个数据点均代表 1个独立测片 Fig. 8 Plots of the coarse-grained quartz De values versus the ratios of the IRSL to post-IR OSL signals(natural (a) and regenerative dose (b)). Note that the minus values in X-axis is due to background subtraction. Natural IRSL/post-IR OSL ratios refer to the natural IRSL signal to the post-IR OSL signal. Regenerative IRSL/post-OSL ratios refer to the first regeneration dose IRSL signal to the post-IR OSL signal. Each data point represents a result from a single aliquot |
|
图 9 研究样品粗粒石英的灵敏度变化与自然(a)和再生剂量(b)IRSL/post-IR OSL比的相关性 Fig. 9 Plots of sensitivity change versus the ratios of the IRSL to post-IR OSL signals(natural (a) and regenerative dose (b)) |
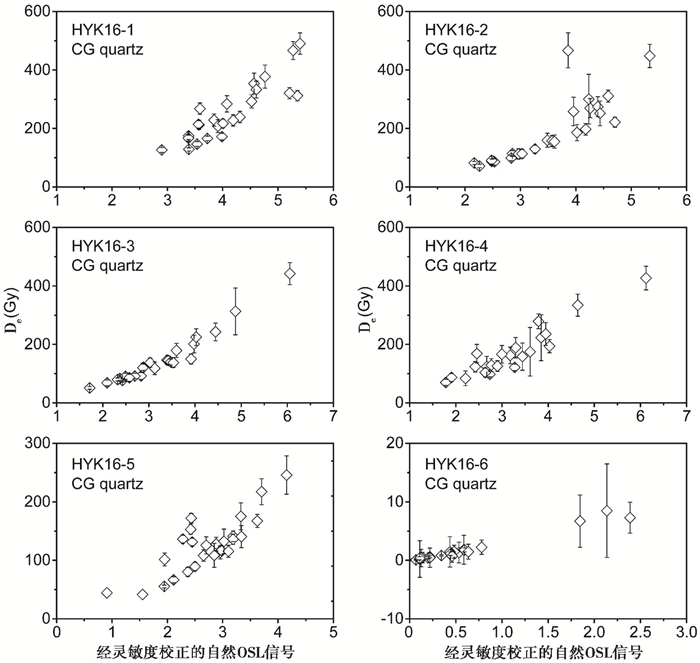
细粒和粗粒石英的平均De值见表 2,粗粒石英De值的分布情况见图 10。值得注意的是,现代样品(HYK16-6)的细粒石英和粗粒石英De值分别是99.5±9.6 Gy和1.9±0.5 Gy。根据CAM模型(Central Age Model)[51]计算的粗粒石英De值的离散度(Over-Dispersion,简称OD值)列于表 2。结果显示样品HYK16-1~5的OD值介于36 % ~53 %之间,远高于样品HYK16-5粗粒石英剂量恢复实验所得De值的OD值(12±2 %),该现象可能是由于样品颗粒之间的释光性质不同,而不是由沉积时晒退情况不好引起的(见后面讨论)。
| 表 2 黑峪口二级阶地样品光释光测年结果 Table 2 Results of luminescence dating of the sediments from the Heiyukou area |
|
图 10 研究样品粗粒石英De值与经灵敏度校正的自然OSL信号相关图 Fig. 10 Plots of De as a function of sensitivity-corrected natural OSL signals |
样品的石英SAR-OSL年龄值列于表 2示于图 2f。结果表明阶地样品粗粒石英的SAR-OSL年龄值与地层层序并不完全相符。另一方面,除古土壤样品(HYK16-2,56.7±3.0 ka),其他4个阶地样品的细粒石英年龄在误差范围内是完全一致的,约66 ka。黄土样品HYK16-1的粗粒石英OSL年龄是89.8±7.2 ka,远大于其对应的细粒石英年龄(66.0±1.8 ka);砂透镜体样品HYK16-5的粗粒石英年龄是46.2±3.7 ka,小于其对应的细粒石英年龄(71.7±3.1 ka);河漫滩样品HYK16-3和HYK16-4两个样品的细粒石英和粗粒石英年龄在误差范围内是一致的。需要注意的是,现代样品的细粒石英和粗粒石英的年龄分别是52.1±5.4 ka和1.1±0.3 ka。
3.4 现代样品石英颗粒的TT-OSL等效剂量如果使用改自Wang等[25~27]和Stevens等[44]的测量步骤,当再生剂量分别是180 Gy、360 Gy、600 Gy、0 Gy和180 Gy,现代样品的De值分别是384.4±8.4 Gy和112.5±7.3 Gy。当再生剂量分别是3 Gy、6 Gy、30 Gy、0 Gy和3 Gy时,使用改自Stevens等[44]的测量步骤得到的De值是41.8±0.4 Gy,而使用改自Wang等[25~27]的测量步骤却得不到结果。这表明,现代样品TT-OSL的De值的大小,在一定程度上取决于测量步骤的选用以及再生剂量的大小;另一方面,现代样品粗粒石英TT-OSL的De值远大于其对应的SAR-OSL De值(1.9±0.5 Gy)。
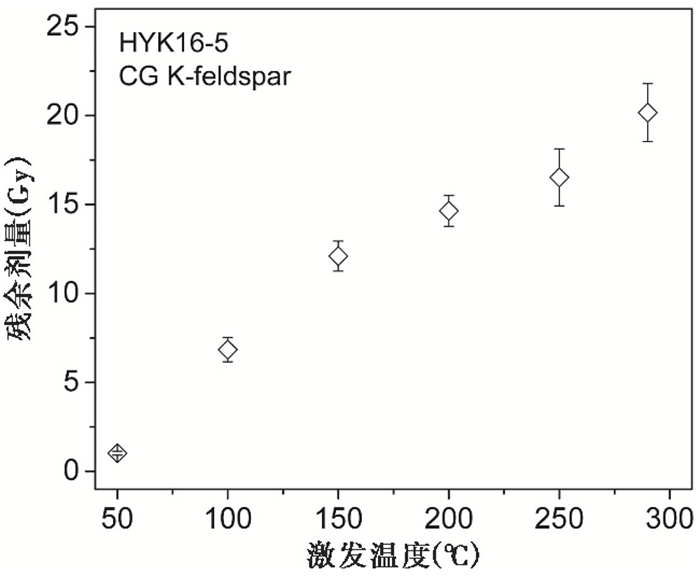
3.5 钾长石IRSL和MET-pIRIR年龄为了估算长石样品的残余剂量,对样品HYK16-5的粗粒长石进行了晒退实验。首先将5个测片置于460 W的太阳光模拟器(Höonle UVACUBE 400)下8 h,将测片取出后使用MET-pIRIR方法测量其残余剂量,结果(图 11)显示该样品粗粒长石的残余剂量略高于中国其他区域的黄土样品[31, 35, 52~53]。鉴于残余剂量高于所测De值的3 %,在计算阶地样品长石的埋藏De值时均减去该残余剂量。
|
图 11 样品HYK16-5粗粒长石经8 h晒退后MET-pIRIR信号残余剂量随激发温度的变化 每个数据点代表 3个测片的平均结果 Fig. 11 Residual dose values of feldspar using the MET-pIRIR procedure after 8 h bleaching with a Höonle UVACUBE 400 solar simulator(460 W). Each data point refers to the mean of three aliquots |
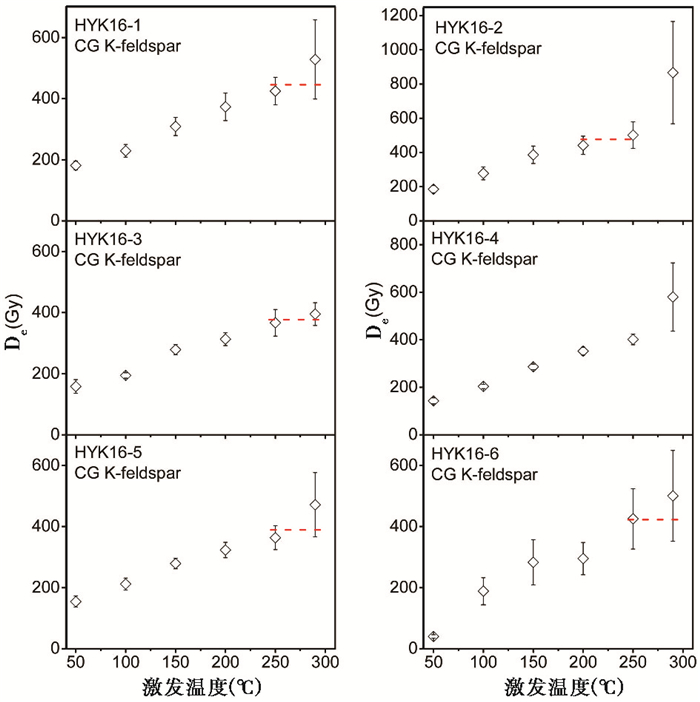
研究样品的钾长石IRSL与MET-pIRIR的De值列于表 3示于图 12。De值随激发温度的升高而增加,如果考虑误差,样品HYK16-1、HYK16-3、HYK16-5和HYK16-6这4个样品的De值在激发温度为250~290 ℃内存在坪区。这表明在该温度区间内长石的pIRIR信号的异常衰退是可以忽略的[31~32]。值得注意的是,现代样品(HYK16-6)的IRSL50℃的De值约为40 Gy,而MET-pIRIR的De值在182~480 Gy之间。为了对比石英SAR-OSL与长石的MET-pIRIR年龄,我们将pIRIR250 ℃年龄做了校正(即减去长石的残余剂量),结果(图 2f和表 2)显示pIRIR250 ℃的年龄(106~148 ka)远大于石英SAR-OSL的年龄;另外,现代样品的pIRIR250 ℃的年龄达到191±47 ka。
| 表 3 黑峪口二级阶地样品粗颗粒钾长石MET-pIRIR的测年结果 Table 3 De values(Gy)obtained using the MET-pIRIR protocol on coarse-grained K-feldspar |
|
图 12 各样品粗颗粒钾长石De值随激发温度的变化 每个数据点代表 5个测片的平均结果与误差值 Fig. 12 Plots of coarse-grained K-feldspar IRSL and MET-pIRIR De values versus stimulation temperature. Each point refers to the mean of five aliquots and associated errors |
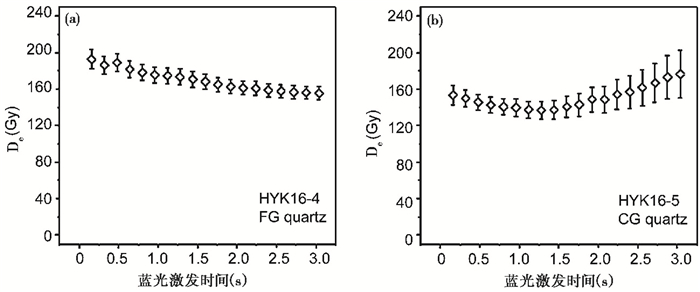
6个样品的粗粒石英的OD值在36 % ~53 %之间,远高于Arnold等[54]报道的晒退良好样品的大测片得到的等效剂量的全球平均OD值(9±3 %),也高于本研究中剂量恢复实验恢复剂量的OD值(12±2 %)。这种情况通常认为是样品在沉积时晒退不彻底引起的。然而,如果本阶地样品粗粒石英晒退不好,那么下部的河流样品粗粒石英SAR-OSL的年龄应该远大于其上覆的黄土样品年代,然而事实并非如此(图 2f)。另外,现代样品HYK16-6的粗粒石英SAR-OSL De值是1.9±0.5 Gy,这与前人在黄河其他地点得到的现代样品的结果是一致的[10, 55],这意味着本研究中的阶地样品的粗粒石英颗粒在沉积时OSL信号晒退相对良好,该结论也得到了De(t)图(图 13)的支持,它显示样品的De值随激发时间的增加并无明显增长的趋势。因此,我们推断样品较大的OD值应该是与释光性质有关的内在De值的离散度和辐射环境状况有关,而不是晒退程度不均一引起的[56]。
|
图 13 样品HYK16-4 (a)细粒石英与样品HYK16-5 (b)粗粒石英的De (t)图 Fig. 13 De(t) plots of De values versus stimulation time for fine-grained and coarse-grained quartz extracts |
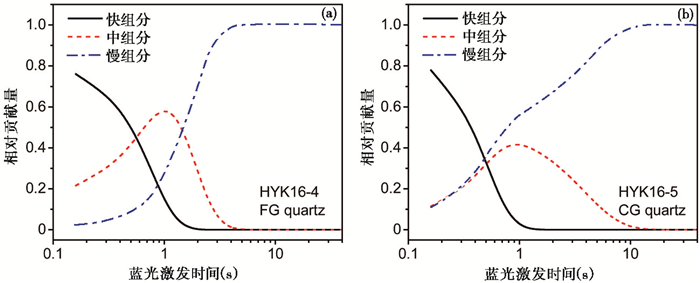
图 3a和图 14说明细颗粒中的光释光信号相对粗颗粒有更多的快组分成分,说明细颗粒比粗颗粒石英在搬运过程中其光释光信号更容易被晒退。但研究中的现代样品细粒石英的SAR-OSL残余剂量为99.5±9.6 Gy,其对应的SAR-OSL年龄约52 ka(见表 2),说明该现代样品的细粒石英在沉积时晒退不好。该结果与Zhang等[36]在黄河壶口地区对阶地上的高含沙水流堆积物的相关报道结果一致,其细粒和粗粒石英的SAR-OSL年龄分别是90 ka和30 ka,结合地层和系列光释光年龄后认为细颗粒的光释光年龄明显高估,说明细颗粒的光释光信号在搬运过程中没有完全晒退。但黄河流域其他地区的现代样品并非如此,它们的细粒石英的残余剂量通常 < 7 Gy[55],这说明细粒样品的光释光信号在沉积时的晒退情况较复杂,本研究中的阶地样品的细粒石英SAR-OSL年龄与地层层序相符,而且基本上不大于粗粒样品的SAR-OSL年龄,这表明阶地样品在沉积时细粒晒退良好。
|
图 14 样品HYK16-4细粒石英(a)与HYK16-5粗粒石英(b)的组分分离 Fig. 14 The relative contributions of the fast, medium and slow plus background components of the OSL signals for fine-grained (a) and coarse-grained (b) quartz extracts |
现代样品粗粒石英TT-OSL的De值表明其信号在埋藏前晒退不好,该结果与Hu等[55]之前在黄河流域其他地方对现代样品的测量结果相一致,表明TT-OSL程序不适用于黄河阶地的河流样品。在本研究中,样品的TT-OSL信号远比OSL信号难晒退。
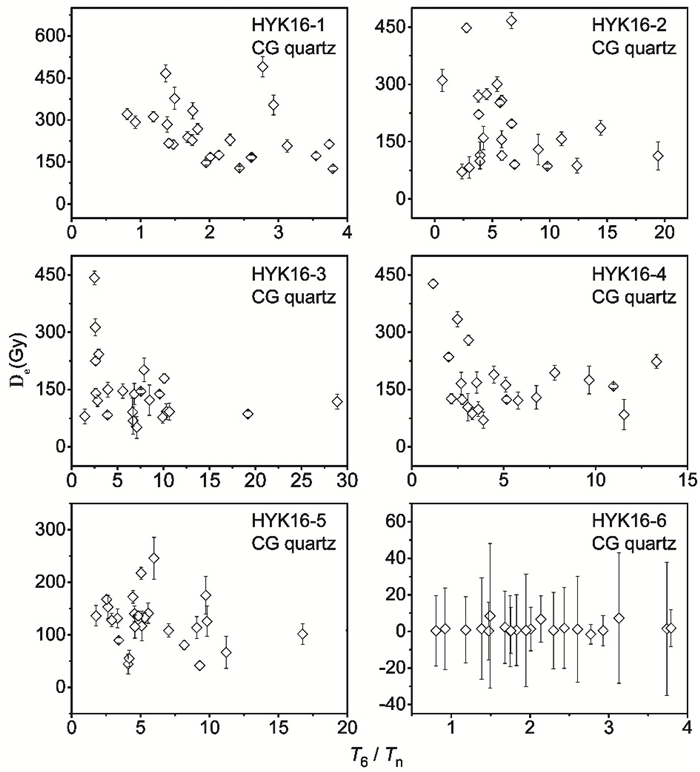
4.1.2 OSL信号在SAR测量过程中的灵敏度变化正如前文所述,样品粗粒石英在SAR测量过程中,其OSL信号的灵敏度变化显著,并且每个测片变化的程度不同(图 15)。虽然OSL灵敏度已经通过检测剂量成功校正,但粗粒石英SAR-OSL De值与灵敏度变化(T6/Tn)的相关性表明随着灵敏度变化增大,对应的De值有下降的趋势(现代样品除外)(图 15),这可能是自然光释光信号与再生剂量信号的灵敏度校正不同步引起的[57]。另外,我们推测各测片灵敏度变化的不同或许是样品粗粒石英De值离散较大的因素之一。基于样品粗粒与基岩具有相似的OSL衰减曲线(图 3a)和灵敏度变化(图 3b),我们推断样品中的部分粗粒石英可能来自当地砂岩基岩的风化产物,这些石英颗粒的光释光性质可能不适宜用OSL-SAR方法测量其等效剂量。另一方面,细粒石英的快组分含量高(图 3a和图 14),特征饱合剂量更高(图 4),SAR测量过程中灵敏度没有显著变化(图 3b),细粒石英所表现出的良好的释光性质表明在本研究中利用细粒石英可以得到更可靠的OSL年龄。
|
图 15 粗粒石英在SAR循环的灵敏度变化(T6/Tn)与对应的De值相关性 每个数据点均代表 1个独立的测片 Fig. 15 Plots of the De values versus the sensitivity change(T6/Tn)during the SAR measurements. Each data point means an individual aliquot |
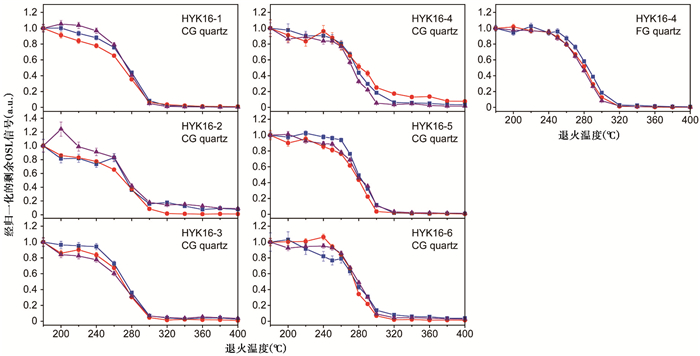
通过对样品HYK16-1~5粗粒石英和样品HYK16-4细粒石英(每个样品有3个测片)进行脉冲退火实验(表 4)可得到本研究中样品的石英信号稳定性。结果显示(图 16),粗粒石英的稳定性在各个测片之间并不相同,有些测片的不稳定OSL信号在200 ℃就开始衰减。这种情况在中国其他地区的粗粒样品中也同样存在[58~59]。而细粒石英的OSL信号相对稳定。因此,测片之间热稳定性的差异可能也是影响粗粒石英SAR-OSL De值离散度大的因素之一。
| 表 4 脉冲退火实验步骤 Table 4 The procedure used for pulse annealing experiments |
|
图 16 粗粒石英和细粒石英的脉冲退火曲线 所有信号归一为160 ℃对应信号的百分比;各个数据点均代表 1个测片 Fig. 16 Pulse annealing curves for the coarse-grained and fine-grained quartz extracts. The heating rate used for each step is 5 ℃/s. In order to compare, all points were normalized to the value of initial temperature. Each point represents the result of one aliquot and its associated error |
前面的讨论说明相对粗颗粒石英光释光信号,细颗粒石英的光释光信号具有更多的快组分成分,更高的饱和剂量和更好的信号热稳定性,在SAR测量过程中灵敏度变化小。这些说明细粒石英更适合用OSL-SAR方法测量其等效剂量。但细颗粒的光释光信号在沉积时的晒退程度较复杂,需要对具体测量样品进行评价。正如前面描述的,本研究中的细粒石英和粗粒石英SAR-OSL年龄与地层的关系(图 2f)表明细粒石英的SAR-OSL年龄相对粗粒石英是更可靠的和更精确的。该结果也与Zhang等[37]对黄河壶口地区的低级阶地剖面研究结果相似,壶口地区的剖面样品得到的粗粒石英的OSL年龄与地层层序并不完全符合,且大于或等于其对应的细粒石英SAR-OSL年龄,细粒石英年龄的可靠性得到了该剖面炭屑样品的放射性碳同位素年龄以及与地层一致性的支持。另一方面,Zhang等[36]在黄河壶口地区更高级阶地上的高含沙水流堆积物的粗粒石英的SAR-OSL年龄是可靠的,而细粒的年龄是严重高估了,说明细粒在搬运中晒退不彻底。如前文所述,同一个样品细粒和粗粒石英表现出不同的释光性质,可能是由于它们来源不同和搬运的方式不同造成的[36~37, 55, 60]。粗粒主要来源于风化基岩、上一次冬天风成堆积的砂或早前的河道堆积物,这些不同的来源使其具有不同的释光性质。细颗粒主要来源于黄河流域内的黄土堆积,在搬运过程中部分颗粒可能以团块的方式或在高含沙水流中没有机会暴露在阳光下,或者是在夜晚搬运和沉积的,这些造成它们的光释光信号在沉积前没有晒退完全。所以,尽管细颗粒有更好的适合SAR方法测量的光释光性质,但其光释光信号的晒退情况较复杂。
由上面讨论可知,本阶地上的细颗粒石英光释光年代是相对可靠的。除HYK16-2(56.7±3.0 ka)样品外,其他4个样品细颗粒光释光年代基本一致(约66 ka),说明阶地上的沉积物是快速堆积。5个样品的平均光释光年龄值为64.7±2.5 ka,该年龄值就是本阶地的形成年龄。
4.3 钾长石的MET-pIRIR信号晒退及其年龄的可靠性现代样品(HYK16-6)的粗粒长石在pIRIR100 ℃到pIRIR290 ℃的De值在182~480 Gy之间,表明该样品在沉积时的长石信号晒退不好。此外,现代样品的MET-pIRIR De值在误差范围内与阶地其他样品结果一致,这显然是不可能的。阶地样品的长石pIRIR250 ℃年龄在106~148 ka之间,系统性地远大于细粒石英(50~70 ka)和粗粒石英的SAR-OSL年龄。特别是对于黄土(HYK16-1)和古土壤样品(HYK16-2),它们的pIRIR250 ℃年龄显然已经超过了马兰黄土的年龄上限(71 ka)[38]。因此,我们认为阶地样品的长石MET-pIRIR年龄是明显高估的,是不可靠的。这种钾长石红外后的高温红外释光信号年代高估现象,我们发现在其他河流沉积上也有类似现象[53, 61],这说明利用这种信号测量阶地沉积物的年代时要特别小心。
5 结论对黄河黑峪口地区的一个典型基座阶地(阶地沉积物由河床砂砾石相、漫滩粉砂相及上覆黄土相组成)上的5个阶地堆积物样品及1个现代黄河样品进行的光释光测年研究表明,细颗粒和粗颗粒石英有不同的释光性质。细颗粒石英有更高的饱和剂量(> 2000 Gy)、在SAR测量过程中光释光信号灵敏度变化小和热稳定性高,以及快组分多等特点。除样品HYK16-2以外,其他4个阶地样品的细粒石英SAR-OSL年龄在误差范围内完全一致。粗粒石英的光释光信号在SAR测量过程中灵敏度变化大,De值离散度(OD值)大以及测片之间的热稳定性不同。粗粒石英在SAR测量过程中光释光信号灵敏度变化大并非由长石残余量引起。粗粒石英SAR-OSL De值离散度大可能与测片之间热稳定性差异有关。粗粒石英的SAR-OSL年龄与地层层序并不完全相符。粗、细粒石英的光释光性质差异可能与它们的不同来源有关,尤其是部分粗粒石英来自本地的砂岩基岩的风化产物。阶地沉积物的细粒石英晒退比粗粒石英好,但现代样品却相反。虽然现代样品的细粒石英在沉积时晒退不好,而粗粒石英晒退较好,但基于地层一致性,我们认为细粒石英的SAR-OSL年龄更加可靠。结合其他黄河阶地堆积物的粗细粒石英的光释光测年,可以认为细颗粒在沉积前的晒退情况较复杂。根据细粒石英的SAR-OSL年龄得到研究阶地的形成年龄是64.7±2.5 ka。基于本研究中样品的粗细粒石英光释光性质的差异和晒退复杂性,我们认为在对黄河阶地样品进行释光测年时应该同时考虑细粒和粗粒石英样品,对得到的SAR-OSL年龄的可靠性要具体分析。
利用TT-OSL方法测定现代黄河样品粗粒石英的残余剂量,发现粗粒石英的TT-OSL信号晒退不完全,残余等效剂量高达380 Gy,远大于SAR-OSL信号得到的等效剂量,且其残余剂量的De值与所采用的测量步骤及再生剂量大小有关。这表明TT-OSL程序不适用于本研究区黄河阶地的河流样品,具体的原因还需要进一步研究。现代样品中的粗粒钾长石的MET-pIRIR信号晒退也不完全,阶地样品的钾长石MET-pIRIR年龄(106~148 ka)系统性地远大于对应的细粒石英SAR-OSL年龄(50~70 ka),并且已经超过了上覆马兰黄土的年龄上限(71 ka),表明钾长石红外后的高温红外释光信号年代出现高估现象。因此在对黄河阶地的河流沉积物运用TT-OSL和MET-pIRIR进行测年时要谨慎。
致谢: 感谢韩业松、王俊康在野外采样过程中的帮助;感谢审稿专家和编辑部杨美芳老师建设性的修改意见。
| [1] |
Bridgland D, Westaway R. Climatically controlled river terrace staircases:A worldwide Quaternary phenomenon. Geomorphology, 2008, 98(3-4): 285-315. DOI:10.1016/j.geomorph.2006.12.032 |
| [2] |
Vandenberghe J. River terraces as a response to climatic forcing:Formation processes, sedimentary characteristics and sites for human occupation. Quaternary International, 2015, 370: 3-11. DOI:10.1016/j.quaint.2014.05.046 |
| [3] |
Cheng S P, Deng Q D, Zhou S W et al. Strath terraces of Jinshaan Canyon, Yellow River, and Quaternary tectonic movements of the Ordos Plateau, North China. Terra Nova, 2002, 14(4): 215-224. DOI:10.1046/j.1365-3121.2002.00350.x |
| [4] |
Guo Y J, Zhang J F, Qiu W L et al. Luminescence dating of the Yellow River terraces in the Hukou area, China. Quaternary Geochronology, 2012, 10(7): 129-135. |
| [5] |
Hu Z B, Pan B T, Guo L Y et al. Rapid fluvial incision and headward erosion by the Yellow River along the Jinshaan Gorge during the past 1.2 Ma as a result of tectonic extension. Quaternary Science Reviews, 2016, 133: 1-14. DOI:10.1016/j.quascirev.2015.12.003 |
| [6] |
Hu Z B, Pan B T, Wang J P et al. Fluvial terrace formation in the eastern Fenwei Basin, China, during the past 1.2 Ma as a combined archive of tectonics and climate change. Journal of Asian Earth Sciences, 2012, 60: 235-245. DOI:10.1016/j.jseaes.2012.09.016 |
| [7] |
潘保田, 胡振波, 胡小飞等. 晋陕峡谷北段晚新生代河流演化初步研究. 第四纪研究, 2012, 32(1): 111-121. Pan Baotian, Hu Zhenbo, Hu Xiaofei et al. Time-slice of the fluvial evolution in the northern Jinshaan Gorge during Late Cenozoic. Quaternary Sciences, 2012, 32(1): 111-121. |
| [8] |
Pan B T, Hu Z B, Wang J P et al. A magnetostratigraphic record of landscape development in the eastern Ordos Plateau, China:Transition from Late Miocene and Early Pliocene stacked sedimentation to Late Pliocene and Quaternary uplift and incision by the Yellow River. Geomorphology, 2011, 125(1): 225-238. DOI:10.1016/j.geomorph.2010.09.019 |
| [9] |
Pan B T, Hu Z B, Wang J P et al. The approximate age of the planation surface and the incision of the Yellow River. Palaeogeography, Palaeoclimatology, Palaeoecology, 2012, 356-357(9): 54-61. |
| [10] |
Qiu W L, Zhang J F, Wang X Y et al. The evolution of the Shiwanghe River valley in response to the Yellow River incision in the Hukou area, Shaanxi, China. Geomorphology, 2014, 215(3): 34-44. |
| [11] |
王小燕, 邱维理, 张家富等. 晋陕峡谷北段保德-府谷地区唐县面上冲积物的特征及其地貌意义. 第四纪研究, 2013, 33(4): 715-722. Wang Xiaoyan, Qiu Weili, Zhang Jiafu et al. Features of the alluvium on Tangxian surface near Baode-Fugu and its geomorphologic implications in the northeran Jinshaan Gorge, Yellow River. Quaternary Sciences, 2013, 33(4): 715-722. |
| [12] |
邱维理, 张家富, 周力平等. 山西河曲黄河阶地序列初步研究. 第四纪研究, 2008, 28(4): 544-552. Qiu Weili, Zhang Jiafu, Zhou Liping et al. Preliminary study of the terrace sequence of the Huanghe River in Hequ area, Shanxi, China. Quaternary Sciences, 2008, 28(4): 544-552. |
| [13] |
Zhang J F, Qiu W L, Li R Q et al. The evolution of a terrace sequence along the Yellow River(Huanghe) in Hequ, Shanxi, China, as inferred from optical dating. Geomorphology, 2009, 109(1-2): 54-65. DOI:10.1016/j.geomorph.2008.08.024 |
| [14] |
程绍平, 邓起东. 黄河晋陕峡谷河流阶地和鄂尔多斯高原第四纪构造运动. 第四纪研究, 1998(3): 238-239. Cheng Shaoping, Deng Qidong. Yellow River and Quaternary tectonic movements of the Ordos Plateau. Quaternary Sciences, 1998(3): 238-239. |
| [15] |
尹功明, 王旭龙, 韩非. 宁夏沙坡头沙漠扩张的时代:来自黄河阶地光释光年龄证据. 第四纪研究, 2013, 33(2): 269-275. Yin Gongming, Wang Xulong, Han Fei. The age of the Shapotou desert expansion based on OSL ages of aeolian sediments in the Yellow River terraces, Ningxia Hui Autonomous Region, Northern China. Quaternary Sciences, 2013, 33(2): 269-275. |
| [16] |
施炜. 黄河中游晋陕峡谷的DEM流域特征分析及其新构造意义. 第四纪研究, 2008, 28(2): 288-298. Shi Wei. DEM drainage analysis of the Shanxi-Shaanxi gorge in the middle reaches of the Huanghe River and its neotectonic implications. Quaternary Sciences, 2008, 28(2): 288-298. |
| [17] |
杜金花, 卢演俦, 王旭龙等. 晋豫间黄河峡谷黄土状沙丘的光释光年代学探讨. 第四纪研究, 2010, 30(5): 946-955. Du Jinhua, Lu Yanchou, Wang Xulong et al. Optically stimulated luminescence dating of loess-like sand-dune along the Yellow River valley between Henan and Shannxi Provinces. Quaternary Sciences, 2010, 30(5): 946-955. |
| [18] |
马玉改, 黄春长, 周亚利等. 黄河中游吉县段全新世古洪水滞流沉积物光释光测年研究. 第四纪研究, 2014, 34(2): 372-380. Ma Yugai, Huang Chunchang, Zhou Yali et al. OSL dating of the Holocene paleoflood events in the Jixian reach along the middle Yellow River. Quaternary Sciences, 2014, 34(2): 372-380. |
| [19] |
王萍, 蒋汉朝, 袁道阳等. 兰州黄河Ⅱ和Ⅲ级阶地的地层结构、年龄及环境意义. 第四纪研究, 2008, 28(4): 553-563. Wang Ping, Jiang Hanchao, Yuan Daoyang et al. Stratigraphic structures and ages of the second and third fluvial terraces along the bank of Huanghe River in Lanzhou Basin, Western China, and their environmental implications. Quaternary Sciences, 2008, 28(4): 553-563. |
| [20] |
刘运明. 山西河曲地区新近纪砾石层的磁性地层年代与成因. 第四纪研究, 2017, 37(3): 597-611. Liu Yunming. Magnetostratigraphy and origin of Neogene conglomerate in Hequ, Shanxi Province. Quaternary Sciences, 2017, 37(3): 597-611. |
| [21] |
韩非, 顾兆炎, 尹功明等. 宇宙成因核素26Al/10Be埋藏测年法在宁夏沙坡头黄河砾石阶地年代研究中的应用. 第四纪研究, 2016, 36(5): 1216-1223. Han Fei, Gu Zhaoyan, Yin Gongming et al. Cosmogenic nuclides 26Al/10Be burial dating of Yellow River gravel terraces around Yemingshan hill, Ningxia, China. Quaternary Sciences, 2016, 36(5): 1216-1223. |
| [22] |
Fu X, Li S H, Li B et al. A fluvial terrace record of Late Quaternary folding rate of the Anjihai anticline in the northern piedmont of Tian Shan, China. Geomorphology, 2016, 278: 91-104. |
| [23] |
Gong Z J, Li S H, Li B. The evolution of a terrace sequence along the Manas River in the northern foreland basin of Tian Shan, China, as inferred from optical dating. Geomorphology, 2014, 213(5): 201-212. |
| [24] |
邱思静, 陈一凡, 王振等. 天山北麓乌鲁木齐河阶地晚更新世黄土磁学特征及古气候意义. 第四纪研究, 2016, 36(5): 1319-1330. Qiu Sijing, Chen Yifan, Wang Zhen et al. Rock magnetic properties and paleoclimatic implications of Late Pleistocene loess in the range front of the Vrümqi River, Xinjiang, NW China. Quaternary Sciences, 2016, 36(5): 1319-1330. |
| [25] |
Wang X L, Lu Y C, Wintle A G. Recuperated OSL dating of fine-grained quartz in Chinese loess. Quaternary Geochronology, 2006, 1(2): 89-100. DOI:10.1016/j.quageo.2006.05.020 |
| [26] |
Wang X L, Wintle A G, Lu Y C. Thermally transferred luminescence in fine-grained quartz from Chinese loess:Basic observations. Radiation Measurements, 2006, 41(6): 649-658. DOI:10.1016/j.radmeas.2006.01.001 |
| [27] |
Wang X L, Wintle A G, Lu Y C. Testing a single-aliquot protocol for recuperated OSL dating. Radiation Measurements, 2007, 42(3): 380-391. DOI:10.1016/j.radmeas.2006.12.015 |
| [28] |
Buylaert J P, Murray A S, Thomsen K J et al. Testing the potential of an elevated temperature IRSL signal from K-feldspar. Radiation Measurements, 2009, 44(5): 560-565. |
| [29] |
Li B, Jacobs Z, Roberts R G et al. Extending the age limit of luminescence dating using the dose-dependent sensitivity of MET-pIRIR signals from K-feldspar. Quaternary Geochronology, 2013, 17(1): 55-67. |
| [30] |
Li B, Jacobs Z, Roberts R G et al. Review and assessment of the potential of post-IR IRSL dating methods to circumvent the problem of anomalous fading in feldspar luminescence. Geochronometria, 2014, 41(3): 178-201. |
| [31] |
Li B, Li S H. Luminescence dating of K-feldspar from sediments:A protocol without anomalous fading correction. Quaternary Geochronology, 2011, 6(5): 468-479. DOI:10.1016/j.quageo.2011.05.001 |
| [32] |
Li B, Li S H. Thermal stability of infrared stimulated luminescence of sedimentary K-feldspar. Radiation Measurements, 2011, 46(1): 29-36. DOI:10.1016/j.radmeas.2010.10.002 |
| [33] |
Li B, Li S H. Luminescence dating of Chinese loess beyond 130 ka using the non-fading signal from K-feldspar. Quaternary Geochronology, 2012, 10(7): 24-31. |
| [34] |
Thomsen K J, Murray A S, Jain M et al. Laboratory fading rates of various luminescence signals from feldspar-rich sediment extracts. Radiation Measurements, 2008, 43(9): 1474-1486. |
| [35] |
Meng Y M, Zhang J F, Qiu W L et al. Optical dating of the Yellow River terraces in the Mengjin area(China):First results. Quaternary Geochronology, 2015, 30: 219-225. DOI:10.1016/j.quageo.2015.03.006 |
| [36] |
Zhang J F, Qiu W L, Wang X Q et al. Optical dating of a hyperconcentrated flow deposit on a Yellow River terrace in Hukou, Shaanxi, China. Quaternary Geochronology, 2010, 5(2): 194-199. |
| [37] |
Zhang J F, Wang X Q, Qiu W L et al. The paleolithic site of Longwangchan in the middle Yellow River, China:Chronology, paleoenvironment and implications. Journal of Archaeological Science, 2011, 38(7): 1537-1550. DOI:10.1016/j.jas.2011.02.019 |
| [38] |
Lu H Y, Liu X D, Zhang F Q et al. Astronomical calibration of loess-paleosol deposits at Luochuan, central Chinese Loess Plateau. Palaeogeography, Palaeoclimatology, Palaeoecology, 1999, 154(3): 237-246. DOI:10.1016/S0031-0182(99)00113-3 |
| [39] |
Zhang J F, Zhou L P. Optimization of the 'double SAR' procedure for polymineral fine grains. Radiation Measurements, 2007, 42(9): 1475-1482. DOI:10.1016/j.radmeas.2007.06.007 |
| [40] |
Zhang J F, Zhou L P, Yue S Y. Dating fluvial sediments by optically stimulated luminescence:Selection of equivalent doses for age calculation. Quaternary Science Reviews, 2003, 22(10): 1123-1129. |
| [41] |
Murray A S, Wintle A G. The single aliquot regenerative dose protocol:Potential for improvements in reliability. Radiation Measurements, 2003, 37(4): 377-381. |
| [42] |
Banerjee D, Bøtter-Jensen L, Murray A S. Retrospective dosimetry:Estimation of the dose to quartz using the single-aliquot regenerative-dose protocol. Applied Radiation and Isotopes, 2000, 52(4): 831-844. DOI:10.1016/S0969-8043(99)00247-X |
| [43] |
Roberts H M, Wintle A G. Equivalent dose determinations for polymineralic fine-grains using the SAR protocol:Application to a Holocene sequence of the Chinese Loess Plateau. Quaternary Science Reviews, 2001, 20(5-9): 859-863. DOI:10.1016/S0277-3791(00)00051-2 |
| [44] |
Stevens T, Buylaert J P, Murray A S. Towards development of a broadly-applicable SAR TT-OSL dating protocol for quartz. Radiation Measurements, 2009, 44(5): 639-645. |
| [45] |
Bøtter-Jensen L, Andersen C E, Duller G A T et al. Developments in radiation, stimulation and observation facilities in luminescence measurements. Radiation Measurements, 2003, 37(4): 535-541. |
| [46] |
Rees-Jones J. Optical dating of young sediments using fine-grain quartz. Ancient TL, 1995, 13(2): 9-14. |
| [47] |
Durcan J A, King G E, Duller G A T. DRAC:Dose rate and age calculator for trapped charge dating. Quaternary Geochronology, 2015, 28: 54-61. DOI:10.1016/j.quageo.2015.03.012 |
| [48] |
Aitken M J. Thermoluminescence Dating. London: Academic Press, 1985: 289-293.
|
| [49] |
Hansen V, Murray A, Buylaert J P et al. A new irradiated quartz for beta source calibration. Radiation Measurements, 2015, 81: 123-127. DOI:10.1016/j.radmeas.2015.02.017 |
| [50] |
Ballarini M, Wallinga J, Wintle A G et al. Analysis of equivalent-dose distributions for single grains of quartz from modern deposits. Quaternary Geochronology, 2007, 2(1): 77-82. |
| [51] |
Galbraith R F, Roberts R G, Laslett G M et al. Optical dating of single and multiple grains of quartz from Jinmium Rock Shelter, Northern Australia:Part Ⅰ, Experimental design and statistical models. Archaeometry, 1999, 41(2): 339-364. DOI:10.1111/arch.1999.41.issue-2 |
| [52] |
Fu X, Li B, Li S H. Testing a multi-step post-IR IRSL dating method using polymineral fine grains from Chinese loess. Quaternary Geochronology, 2012, 10: 8-15. DOI:10.1016/j.quageo.2011.12.004 |
| [53] |
Rui X, Zhang J F, Hou Y M et al. Feldspar multi-elevated-temperature post-IR IRSL dating of the Wulanmulun Paleolithic site and its implication. Quaternary Geochronology, 2015, 30: 438-444. DOI:10.1016/j.quageo.2015.05.004 |
| [54] |
Arnold L J, Roberts R G, Macphee R D E et al. Optical dating of perennially frozen deposits associated with preserved ancient plant and animal DNA in north-central Siberia. Quaternary Geochronology, 2008, 3(1-2): 114-136. DOI:10.1016/j.quageo.2007.09.002 |
| [55] |
Hu G, Zhang J F, Qiu W L et al. Residual OSL signals in modern fluvial sediments from the Yellow River(Huanghe) and the implications for dating young sediments. Quaternary Geochronology, 2010, 5(2): 187-193. |
| [56] |
Fu X, Cohen T J, Arnold L J. Extending the record of lacustrine phases beyond the last interglacial for Lake Eyre in Central Australia using luminescence dating. Quaternary Science Reviews, 2017, 162: 88-110. DOI:10.1016/j.quascirev.2017.03.002 |
| [57] |
Singhvi A K, Stokes S C, Chauhan N et al. Changes in natural OSL sensitivity during single aliquot regeneration procedure and their implications for equivalent dose determination. Geochronometria, 2011, 38(3): 231-241. |
| [58] |
Fan A C, Li S H, Li B. Observation of unstable fast component in OSL of quartz. Radiation Measurements, 2011, 46(1): 21-28. DOI:10.1016/j.radmeas.2010.10.001 |
| [59] |
Rui X, Li B, Guo Y J, et al. Variability in the thermal stability of OSL signal of single-grain quartz from the Nihewan Basin, North China[J]. Quaternary Geochronology. Submitted.
|
| [60] |
Xu J X, Yang J S, Yan Y X. Erosion and sediment yields as influenced by coupled eolian and fluvial processes:The Yellow River, China. Geomorphology, 2006, 73(1): 1-15. |
| [61] |
Nian X M, Bailey R M, Zhou L P. Investigations of the post-IR IRSL protocol applied to single K-feldspar grains from fluvial sediment samples. Radiation Measurements, 2012, 47(9): 703-709. DOI:10.1016/j.radmeas.2012.03.024 |
2 State Key Laboratory of Earthquake Dynamics, Institute of Geology, China Earthquake Administration, Beijing 100029)
Abstract
The Yellow River flows along the northern and northeastern and borders of the Ordos Plateau, and cuts through the eastern plateau at an average elevation of 1050 m to 1500 m above sea level(a.s.l.) from north to south. Results in the formation of the Jinshaan Canyon limited to the reach from Lamawan to Yumenkou, and the canyon links the Weihe graben and the Hetao graben in the middle reach of the Yellow River. A series of strath terraces have been developed along the banks of the canyon, and the fluvial terrace deposits are covered by loess with various thicknesses. It is one of the key issues for its geomorphological studies to determine the accurate formation age of the terraces. Although there have been a lot of investigations about dating of the Yellow River terraces, especially for luminescence dating, the comparison of reliabilities of the ages obtained using different methods is rare. In this study, a typical strath terrace of the river in the Heiyukou area(38°32'36.34″N, 110°54'25.88″E) in the Jinshaan Canyon was identified at least five strath terraces on the two banks of the Yellow River. The second terraces was selected to be investigated in this study. The elevation of the river course in this area is about 770 m a.s.l., and the elevation of the strath surface is about 12.6 m above the modern channel. The terrace deposits which are 9.66 m in thick, are exposed in the river cliff and a sandpit, and can be divided into four layers. Five samples(samples HYK16-1~5) were collected from the fresh profile. About 12.6 m thick bedrock is exposed, which mainly comprises Triassic sandstone with a horizontal bedding. Note that the surface of the bedrock is loose because of weathering. A bedrock sample was also collected for testing its luminescence properties. In order to assess the bleaching of the fluvial deposits, a modern sample(HYK16-6) was taken from a sidebar at the foot of the river cliff. The modern sample is most likely deposited during the last flood. All six samples for luminescence dating using a single-aliquot regenerative-dose(OSL-SAR) protocol on fine-grained(FG) and coarse-grained(CG) quartz, and a multiple-elevated-temperature post-IR IRSL(MET-pIRIR) procedure on CG K-feldspar. A modern sample was also tested for its residual dose using two thermally transferred OSL(TT-OSL) procedure with different regenerative dose. The results show that the fine and coarse quartz grains have different luminescence properties due to their different sources, especially for some coarse quartz grains derived from the surface materials of local weathered sandstone bedrock. The fine quartz grains exhibit more fast component, higher saturation dose(>2000 Gy) and more thermal stability, which make them more suitable than the CG grains for luminescence dating. Although a large residual dose of the FG grains from the modern sample was detected, the FG quartz SAR-OSL ages are in stratigraphic order. This implies that the FG quartz SAR-OSL ages are more reliable. The CG quartz SAR-OSL ages are large scatter, and not stratigraphically consistent, suggesting that these ages are not reliable. Based on the FG SAR-OSL ages, the studied terrace was determined to 64.7±2.5 ka. The CG quartz thermally-transferred OSL(TT-OSL) and CG K-feldspar MET-pIRIR signals from the modern sample are very poorly bleached at deposition. The TT-OSL De value of up to 380 Gy for CG quartz is much larger than its corresponding SAR-OSL De value. The residual TT-OSL dose of the modern sample is related to the measured procedures and the size of the regenerate doses used. And the MET-pIRIR ages(106~148 ka) obtained for the terrace samples are much larger than their quartz SAR-OSL ages(50~70 ka) and beyond the upper age limit of the overlying Malan loess(71 ka). This study implies that when dating other Yellow River terraces both fine and coarse quartz fractions should be used in order to obtain reliable ages, and the reliability of FG and CG quartz OSL ages obtained must be evaluated on a case-by-case basis. Caution is needed when dating the Yellow River terraces with the MET-pIRIR and TT-OSL procedures. 2018, Vol.38
