2 中国科学院青藏高原研究所, 环境变化与地表过程重点实验室, 北京 100101;
3 Department of Geography, University of Tennessee, Knoxville, TN 37996, USA)
新仙女木事件结束后,气温回升,进入温暖的全新世[1]。但全新世气候并不一直稳定,期间有多次千年尺度的气候震荡,最突出的便是北大西洋冷事件,发生时间大致对应为11.1、10.3、9.5、8.2、5.9、4.3、2.8、1.4和0.4 ka B.P. [2~4]。全新世分早、中、晚3个阶段,早中全新世气候整体温和湿润,此时期夏季风强盛,全新世大暖期出现在此阶段[5]。大暖期时山地冰川大规模退缩、有些小冰川甚至消失;之后气候转为冷干,晚全新世的降温导致山地冰川再度扩张或者重新生成,学者们将距今约3000~1500年的冰川前进时期称为新冰期[6~7]。由于这一时期与人类文明密切相关,因此研究这一时期的气候特点和冰川变化具有十分重要的意义。
冰川发育受控于气候、地形和海拔等因素,冰川地貌是研究气候变化的良好媒介。全新世冰川波动距今较近,冰川退缩后留下了丰富的冰川遗迹,在喜马拉雅山北坡卡鲁雄峰枪勇谷中保留相对完好,指示了古冰川的分布范围。冰川面积变化反映冰川规模的变化,是研究冰川变化的重要指标。冰川体积/冰储量是冰川面积和厚度的函数,体积的变化对径流及下游水资源等均有很大影响。冰川体积的变化幅度大于面积变化的幅度,更能反映冰川的变化。随着研究的深入,越来越多的学者开始关注冰川的厚度变化和体积变化[8~12]。
本文以枪勇沟新冰期冰川为研究对象,结合遥感影像和模型方法恢复并计算新冰期时枪勇冰川的面积、厚度和体积,结合冰川平衡线高度变化和相关气候记录探讨气候的变化。
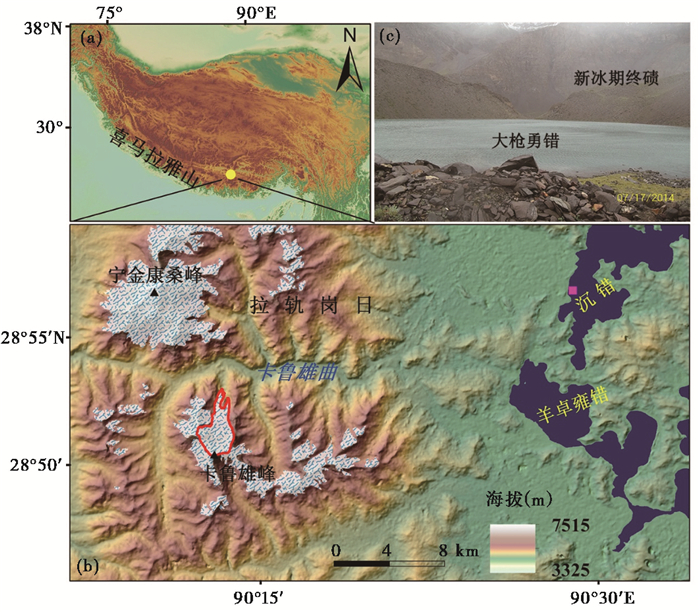
1 研究区概况卡鲁雄峰(28.8°N,90.3°E;海拔6674 m,图 1)位于西藏南部,雅鲁藏布江以南,喜马拉雅山北坡雨影区。北边为拉轨岗日东段最高峰宁金康桑峰(海拔7191 m),距拉萨-亚东公路上最高的卡若拉垭口约6 km。该区属于温带半干旱气候,受南亚夏季风影响,降水约90%集中在5~9月,垭口附近年降水量约为500~600 mm[13]。距离本区最近的浪卡子高海拔气象站(4433 m)1962~2014年间年降水量平均为381.1 mm,年均温为3.39 ℃。枪勇冰川发源于卡鲁雄峰,现代冰川末端在5000 m附近,冰川长约4.8 km,面积为6.63 km2。该区冰川属于大陆性山谷冰川,受降水影响,冰川积累和消融均集中在夏季,冰川融水经卡鲁雄曲向东流入羊卓雍错。枪勇沟从外至内共保存有4期冰碛垄,其中以“大枪勇错”外侧冰碛垄最为高大,野外观察终碛垄高约30 m,且形态清晰(图 1c)。Zheng[14]根据地貌和冰碛物特征认为大枪勇错外围冰碛形成于末次冰期,但缺乏年代学约束。Owen等[13]利用宇生核素10Be暴露测年法获得该终碛垄的形成时间,经Heyman[15]校正为3.7~2.5 ka,对应新冰期时代。现代冰川末端和新冰期终碛垄之间被冰碛物阻塞形成“小枪勇错”和“大枪勇错”两个冰川湖,中间由疑似小冰期冰碛物隔开。在全球变暖的背景下,本区冰川正在经历着持续的退缩。估算本区现代冰川体积,并模拟古冰川体积将加深对冰川退缩的理解,并可对枪勇冰川对流域水资源的贡献探知一二。
|
图 1 研究区概况图 (a)研究区位置;(b)研究区位置详图,红色框为枪勇冰川;(c)大枪勇错和新冰期冰碛垄位置 Fig. 1 Sketch map of study area. (a)Location of study area; (b)Detailed map of study area, and the red polygon is Qiangyong Glacier; (c)Locations of bigger Qiangyong Co and Neoglacial moraine |
结合野外调查和新冰期年代学研究,以新冰期侧碛垄和终碛垄所在位置为边界,在谷歌地球(Google Earth)中描绘新冰期时冰川分布的范围,导入ArcGIS中计算可得到冰川的面积。
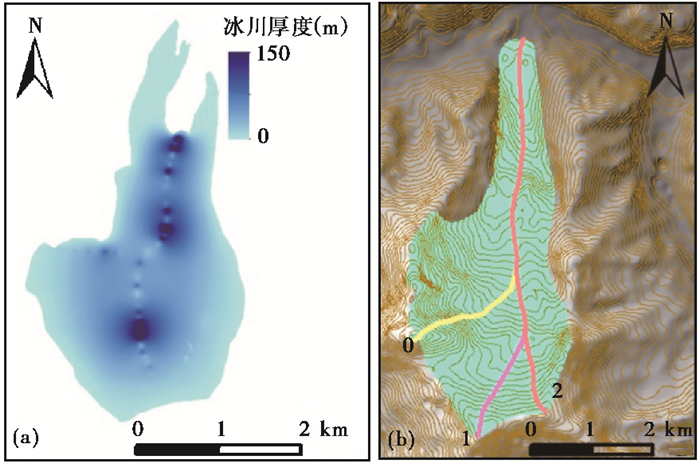
本文选择Schilling和Hollin[16]提出的纵剖线模型(Longitudinal Flowline Model)来模拟新冰期冰川中流线(图 2b)上的冰川表面高程,该模型基于Nye[17]的冰川动力学方程:τ=ρghsinα,其中τ为剪切应力,ρ是冰川密度,g是重力加速度,h是冰川厚度,α是冰川表面坡度。冰川处于稳定状态时,冰川的剪切应力等于冰川自身重力在平行于冰川表面的分量。
|
图 2 现代冰川厚度分布(a)和新冰期冰川中流线(b) Fig. 2 Distribution of Modern glacier thickness (a) and central lines of Neoglacial glacier (b) |
假设冰川为理想塑性体,冰川的形变是由驱应力(冰川自身重力与冰川表面坡度的函数)和屈服应力的变化引起的。当驱应力大于屈服应力时,冰体移动,冰川将变薄或冰川表面变缓,从而减小驱应力;当驱应力小于屈服应力时,冰体不移动,冰川将变厚或冰川表面变陡,以增加驱应力;当驱应力等于屈服应力时,冰川处于稳定状态,根据动力学方程可求冰面高程[18]。Vieira[19]、Benn和Hulton[20]分别对Schilling和Hollin[16]提出的纵剖线模型进行扩展,他们将该模型写入Excel程序,增加了模型的可操作性。金耀[18]曾利用此模型在念青唐古拉山西段古仁河口和曲嘎切进行验证和模拟,取得了良好的模拟结果。
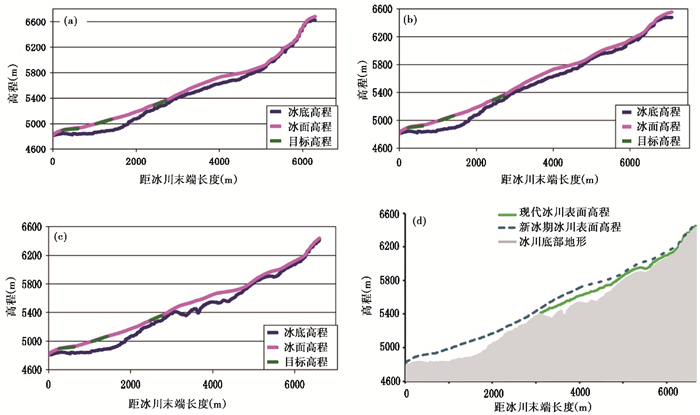
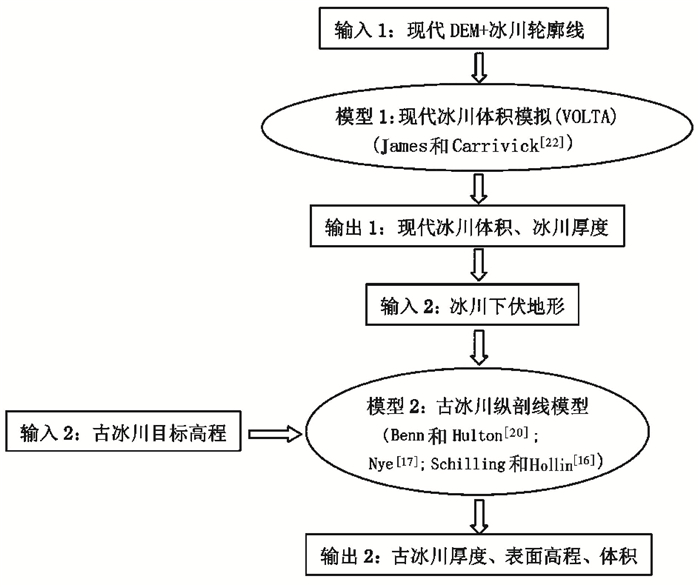
在Excel中进行冰川表面高程模拟时,首先输入冰川底部高程、目标高程及山谷形态因子,然后不断调整底部剪切力的大小,使模拟的冰面高程和目标高程吻合(图 3a~3c)。其中目标高程可由侧碛垄及冰川槽谷谷肩高度得到。模拟获得中流线上冰川表面高程后,横剖面上的冰川表面高程可由中流线上对应的高程值插值得到。由于冰川积累区横截面一般呈下凹形、而消融区则呈上凸形,且很难找到合适的方程来真实的表达冰川横剖面上的高程分布。因此本文在插值时将积累区和消融区冰川横剖面均当作是平的处理,以抵消掉部分误差。在计算冰川体积时,参考前人在不同区域基于冰川动力学方程估算的古冰川及现代冰川体积和相应的体积误差,本文冰川体积误差取平均值± 20%进行估算[21~23]。考虑到此模型需要输入冰川底部高程,为获得真实的底部地形,需要把现代冰川厚度扣除。本文选择同样基于Nye[17]的冰川动力学方程,与Schilling和Hollin[16]提出的纵剖线模型物理基础一致的James和Carrivick[22]开发的冰量模型(VOLTA)来模拟现代冰川的厚度,继而获得冰川底部地形。本文使用由德国发布的30 m高分辨率的SRTM DEM作为地形输入数据(https://centaurus.caf.dlr.de:8443/eoweb-ng/template/default/welcome/entryPage.vm),模拟流程见图 4。
|
图 3 新冰期中流线上冰面高程模拟 (a)~(c)分别对应图 2b中中流线编号0~2,(d)示意图 2b中流线2上的新冰期冰面高程和现代冰面高程的变化 Fig. 3 Simulations of ice surface elevations in Neoglacial central lines, panel (a) to (c) represent number 0 to 2 of central lines in Fig. 2b, panel d shows the glacier surface elevation changes from Neoglacial to Modern on the central line 2 in Fig. 2b |
|
图 4 冰川体积模拟流程图 Fig. 4 Flow chart of glacier volume simulation |
冰川物质平衡线高度(Equilibrium Line Altitude,简称ELA)为积累区和消融区的分界,是气候的良好指示器[24~26]。积累区面积比率法(Accumulation Area Ratio Method,简称AAR)是最常用且相对可靠的方法之一。该方法指的是冰川处于稳定状态时,冰川积累区面积占冰川总面积的比例是固定的,该比值就是AAR值[24, 27~28]。大陆性冰川AAR值相对较高,由于本区缺乏实测AAR值,因此参考中国西部山地冰川的AAR值平均值0.71[29]、雅江流域平均值0.62[29]及羊湖流域0.8[30],本文在计算中采用0.7±0.05。AAR法计算冰川物质平衡线高度(ELA)的准确性依赖于冰川表面高程分布的精度。前人在利用AAR法计算冰川物质平衡线高度时,通常用现代DEM代替古冰川时期的冰面高程分布,可能导致低估古冰川的平衡线高度,进而高估冰川平衡线变化值及相应的气候变化幅度[23, 31]。本文计算平衡线高度时基于恢复的新冰期古冰面高程分布,将有效的减小输入数据带来的误差,提高平衡线计算的准确度。
3 结果与讨论 3.1 新冰期冰川体积估算将枪勇冰川轮廓和SRTM DEM输入到VOLTA模型中,模型根据地形数据自动计算现代冰川中流线,模拟中流线上冰川厚度,并插值到整条冰川,模拟结果见图 2a。枪勇现代冰川厚度在0~150 m之间,平均厚度31.7 m,体积为0.21±0.04 km3。
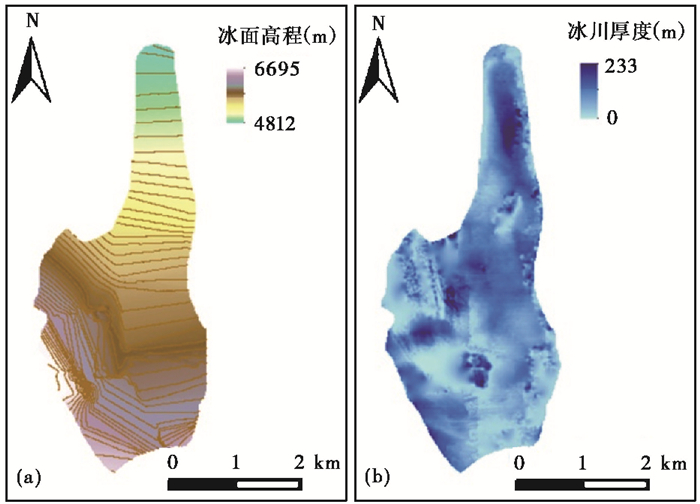
在ArcGIS中计算枪勇冰川新冰期时面积为10.0 km2,是现代冰川面积的1.5倍。结合谷歌影像和DEM提取新冰期时冰川中流线,编号为0~2,见图 2b。在3条中流线上拟合冰川表面高程,0~2号中流线上冰面高程模拟见图 3a~3c。其中,底部剪切力平均值为94 kPa,符合山谷冰川底部剪切力的合理取值(50~150 kPa)[17, 23]。可以看出,中流线上冰川中部和下部厚度较大,这可能是由于冰川上游地形较陡、冰川不易积累,因此厚度较薄,而冰川下游地形较缓利于冰川积累。将3条中流线上冰川表面高程插值至整条冰川,获得新冰期时冰川表面高程分布,见图 5a。由于新冰期冰川底部地形在前文已经通过DEM和现代冰川厚度相减获得,因此可得新冰期时冰川厚度分布。本文中新冰期冰川边界清晰,因此将边界处冰川厚度为零作为检验新冰期冰川厚度分布的约束条件,最终新冰期时枪勇冰川厚度分布见图 5b。在ArcGIS中进行计算,新冰期冰川平均厚度为58.5 m,体积为0.59±0.12 km3,约为现代冰川的2.8倍,新冰期至今体积变化了约0.38 km3。为了直观的显示冰川厚度的变化,以中流线2为例,将新冰期、现代冰川表面高程和底部地形绘制在同一图中(图 3d),可以清楚地看到冰川厚度沿中流线从下游至上游的变化,图中冰川厚度的变化主要集中在中下游。
|
图 5 模拟的新冰期冰面高程分布(a)和冰川厚度分布(b) Fig. 5 Distributions of simulated Neoglacial ice surface elevations (a), and ice thickness (b) |
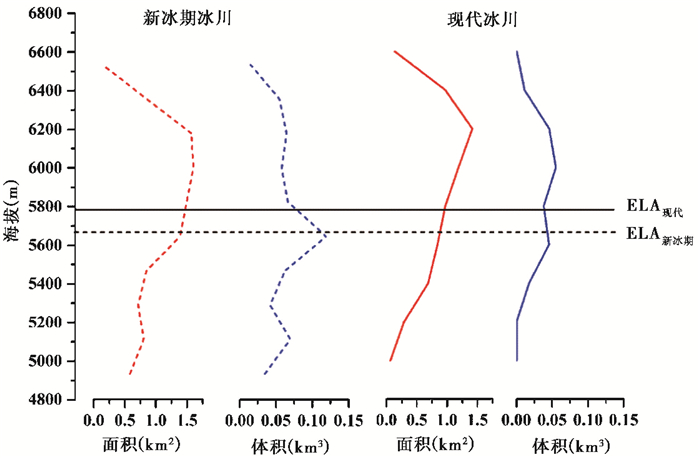
采用AAR方法,在AAR值为0.7±0.05时,枪勇现代冰川平衡线高度为5780±70 m(ELA现代)。若基于现代DEM计算,新冰期冰川平衡线高度为5540±100 m,相对于现代高度降低了240 m。基于模型恢复的新冰期冰川表面计算得到的冰川平衡线高度为5660±100 m(ELA新冰期),相对于现代平衡线高度降低了仅120 m。模拟古冰川表面高程前后,新冰期冰川平衡线降低值减少了120 m。若不考虑新冰期降水的变化,将平衡线高度的变化仅归因为温度的变化,那么是否恢复古冰川表面高程将造成约0.7 ℃的温度估算误差。从新冰期和现代冰川面积、体积沿高程带的分布,以及与冰川平衡线高度的关系(图 6),发现新冰期冰川平衡线处面积和体积都较大。新冰期以来冰川平衡线升高,冰川面积和体积分布的适宜高程也升高至6000~6200 m。
|
图 6 冰川面积和体积随高程的变化(虚线代表新冰期,实线代表现代冰川) Fig. 6 Glacier area and volume changes along the altitudes. Dash lines represent Neoglacial and solid lines represent modern glacier |
基于枪勇冰川东侧25 km处沉错钻孔沉积物中孢粉分析(图 1b),Lu等[32]认为中全新世向晚全新世过渡时期,本区气候转冷,降水减少,与著名的4.2 ka冷事件[33~34]在时间上有所重叠。这一时期,由于温度降低,导致卡鲁雄峰及宁金康桑峰冰川均出现扩张,这一现象被冰川谷中保留的高大冰碛垄所记录。冰碛垄顶面上的宇生核素10Be暴露年代代表冰川退缩的信号,枪勇沟新冰期冰碛漂砾暴露年代为3.7~2.5 ka[13],因此冰川扩张的时间可能早于3.7 ka。我们在宁金康桑峰东侧岗布沟获得此期冰碛垄顶部漂砾暴露年代为2.5±0.2 ka[35]。两条沟的10Be测年结果共同指示,至少在2.5 ka时冰川已经退缩。此外,Zhang等[36]基于大枪勇错冰川湖沉积物多种方法放射性碳测年的研究,提出了一个重建古冰川融化强度的新指标“老孢粉效应”,其文章认为枪勇冰川可能在2.2 ka时融化加剧。
4 结论基于新冰期时冰碛垄的分布范围,本文恢复并计算了这一时期枪勇冰川面积约为10.0 km2,较现代冰川扩张了1.5倍。采用VOLTA模型计算了现代冰川的体积为0.21±0.04 km3,平均厚度约为31.7 m。在此基础上,我们用纵剖线模型模拟了新冰期冰川表面高程。新冰期时期,冰川平均厚度约为58.5 m,冰川体积约0.59±0.12 km3,为现代冰川体积的2.8倍。相较于面积的变化,新冰期至今体积减小的更剧烈。
采用AAR值为0.7±0.05,基于现代冰川表面高程和模拟恢复的新冰期冰川表面高程,计算现代冰川和新冰期冰川的平衡线高度分别为5780±70 m和5660±100 m,新冰期时平衡线高度降低了约120 m。而不利用模型恢复新冰期表面高程时,平衡线降低值将高估约120 m。
枪勇冰川新冰期冰川扩张受区域降温控制,冰川前进可能是对4.2 ka冷事件的响应,目前仍需要进一步验证。冰碛垄顶部宇生核素测年和大枪勇错湖芯孢粉资料表明,冰川可能在2.5 ka左右已经退缩,2.2 ka时退缩加剧。
致谢: 非常感谢审稿专家和编辑部杨美芳老师建设性的修改意见。
| [1] |
Dansgaard W, White J W C, Johnsen S J. The abrupt termination of the Younger Dryas climate event. Science, 1989, 339(6225): 532-534. |
| [2] |
Bianchi G G, Mccave I N. Holocene periodicity in North Atlantic climate and deep-ocean flow south of Iceland. Nature, 1999, 397(6719): 515-517. DOI:10.1038/17362 |
| [3] |
Bond G. A pervasive millennial-scale cycle in North Atlantic Holocene and glacial climates. Science, 1997, 278(7): 1257-1266. |
| [4] |
王绍武, 朱锦红. 全新世千年尺度气候振荡的年代学研究. 气候变化研究进展, 2005, 1(4): 157-160. Wang Shaowu, Zhu Jinhong. Studies of chronology of millennial time scale climate oscillations in the Holocene. Advances in Climate Change Research, 2005, 1(4): 157-160. |
| [5] |
Renssen H, Seppä H, Heiri O et al. The spatial and temporal complexity of the Holocene Thermal Maximum. Nature Geoscience, 2009, 2(6): 411-414. DOI:10.1038/ngeo513 |
| [6] |
崔之久, 陈艺鑫, 张威等. 中国第四纪冰期历史、特征及成因探讨. 第四纪研究, 2011, 31(5): 749-764. Cui Zhijiu, Chen Yixin, Zhang Wei et al. Research history, glacial chronology and origins of Quaternary glaciations in China. Quaternary Sciences, 2011, 31(5): 749-764. |
| [7] |
易朝路, 崔之久, 熊黑钢. 中国第四纪冰期数值年表初步划分. 第四纪研究, 2005, 25(5): 609-619. Yi Chaolu, Cui Zhijiu, Xiong Heigang. Numerical periods of Quaternary glaciations in China. Quaternary Sciences, 2005, 25(5): 609-619. |
| [8] |
Frey H, Machguth H, Huss M et al. Estimating the volume of glaciers in the Himalayan-Karakoram region using different methods. The Cryosphere, 2014, 8(6): 2313-2333. DOI:10.5194/tc-8-2313-2014 |
| [9] |
Huss M, Farinotti D. Distributed ice thickness and volume of all glaciers around the globe. Journal of Geophysical Research:Earth Surface, 2012, 117(F4): F04010. |
| [10] |
Wei J F, Liu S Y, Guo W Q et al. Changes in glacier volume in the north bank of the Bangong Co Basin from 1968 to 2007 based on historical topographic maps, SRTM, and ASTER stereo images. Arctic, Antarctic, and Alpine Research, 2015, 47(2): 301-311. DOI:10.1657/AAAR00C-13-129 |
| [11] |
Xu X K, Pan B L, Dong G C et al. Last glacial climate reconstruction by exploring glacier sensitivity to climate on the southeastern slope of the western Nyaiqentanglha Shan, Tibetan Plateau. Journal of Glaciology, 2017, 63(238): 361-371. DOI:10.1017/jog.2016.147 |
| [12] |
吴珊珊, 姚治君, 姜丽光等. 现代冰川体积变化研究方法综述. 地球科学进展, 2015, 30(2): 237-246. Wu Shanshan, Yao Zhijun, Jiang Liguang et al. Method review of modern glacier volume change. Advances in Earth Science, 2015, 30(2): 237-246. DOI:10.11867/j.issn.1001-8166.2015.02.0237 |
| [13] |
Owen L A, Finkel R C, Barnard P L et al. Climatic and topographic controls on the style and timing of Late Quaternary glaciation throughout Tibet and the Himalaya defined by 10Be cosmogenic radionuclide surface exposure dating. Quaternary Science Reviews, 2005, 24(12-13): 1391-1411. DOI:10.1016/j.quascirev.2004.10.014 |
| [14] |
Zheng B X. The influence of Himalayan uplift on the development of Quateranry glaciers. Berlin Stuttgart, 1989, 76: 89-115. |
| [15] |
Heyman J. Paleoglaciation of the Tibetan Plateau and surrounding mountains based on exposure ages and ELA depression estimates. Quaternary Science Reviews, 2014, 91(3): 30-41. |
| [16] |
Schilling D H, Hollin J T. Numerical reconstructions of valley glaciers and small ice caps[M]//Denton G H, Hughes T J. The Last Great Ice Sheets. New York: Wiley, 1981: 207-220.
|
| [17] |
Nye J F. The mechanics of glacier flow. Journal of Glaciology, 1952, 2(12): 82-93. DOI:10.1017/S0022143000033967 |
| [18] |
金耀. 念青唐古拉山曲嘎切末次冰盛期古冰川重建[D]. 北京: 中国科学院大学硕士论文, 2013: 26-28. Jin Yao. Reconstruction of Last Glacial Maximum Palaeoglacier in the Qugaqie Valley in Nyainqêntanglha Range[D]. Beijing: The Master's Dissertation of University of Chinese Academy of Sciences, 2013: 26-28. http://www.wanfangdata.com.cn/details/detail.do?_type=degree&id=Y2430780 |
| [19] |
Vieira G. Combined numerical and geomorphological reconstruction of the Serra da Estrela Plateau icefield, Portugal. Geomorphology, 2008, 97(1-2): 190-207. DOI:10.1016/j.geomorph.2007.02.042 |
| [20] |
Benn D I, Hulton N R J. An ExcelTM spreadsheet program for reconstructing the surface profile of former mountain glaciers and ice caps. Computers & Geosciences, 2010, 36(5): 605-610. |
| [21] |
Carrivick J L, Davies B J, James W H M et al. Distributed ice thickness and glacier volume in southern South America. Global and Planetary Change, 2016, 146: 122-132. DOI:10.1016/j.gloplacha.2016.09.010 |
| [22] |
James W H M, Carrivick J L. Automated modelling of spatially-distributed glacier ice thickness and volume. Computers & Geosciences, 2016, 92(C): 90-103. |
| [23] |
Pellitero R, Rea B R, Spagnolo M et al. GlaRe, a GIS tool to reconstruct the 3D surface of palaeoglaciers. Computers & Geosciences, 2016, 94: 77-85. |
| [24] |
Porter S C. Snowline depression in the tropics during the Last Glaciation. Quaternary Science Reviews, 2001, 20(10): 1067-1091. |
| [25] |
鞠远江, 刘耕年, 魏遐. 山地冰川平衡线高度作为气候变化代用指标的讨论. 冰川冻土, 2007, 29(4): 613-616. Ju Yuanjiang, Liu Gengnian, Wei Xia. Equilibrium line altitude of mountain glacier as a proxy of climate changes. Journal of Glaciolgy & Geocryology, 2007, 29(4): 613-616. |
| [26] |
施雅风. 对青藏高原末次冰盛期降温值、平衡线下降值与模拟结果的讨论. 第四纪研究, 2002, 22(4): 312-322. Shi Yafeng. Discussion on temperature lowering values and equilibrium line altitude in the Qianghai-Xizang Plateau during the Last Glacial Maximum and their simulated results. Quaternary Sciences, 2002, 22(4): 312-322. |
| [27] |
Meier M, Post A. Recent variations in mass net budgets of glaciers in western North America[C]//International Association of Scientific Hydrological Sciences Publication, 1962, 58: 63-77. https://www.researchgate.net/publication/247352587_Recent_variations_in_mass_net_budgets_of_glaciers_in_western_North_America
|
| [28] |
张威, 闫玲, 崔之久等. 长白山现代理论雪线和古雪线高度. 第四纪研究, 2008, 28(4): 373-383. Zhang Wei, Yan Ling, Cui Zhijiu et al. Present and Late Pleistocene equilibrium line altitudes in Changbai Mountains, Northeast China. Quaternary Sciences, 2008, 28(4): 373-383. |
| [29] |
刘潮海, 施雅风, 王宗太等. 中国冰川资源及其分布特征:中国冰川目录编制完成. 冰川冻土, 2000, 22(2): 106-112. Liu Chaohai, Shi Yafeng, Wang Zongtai et al. Glacier resources and their distributive characteristics in China-A review on Chinese Glacier Inventory. Journal of Glaciolgy & Geocryology, 2000, 22(2): 106-112. |
| [30] |
罗日升, 曹峻, 刘耕年等. 西藏枪勇冰川冰下富碎屑化学沉淀特征与冰下过程. 地理学报, 2003, 58(5): 757-764. Luo Risheng, Cao Jun, Liu Gengnian et al. Characteristics of the subglacially-formed debris-rich chemical deposits and subglacial processes of Qiangyong Glacier. Journal of Geographical Sciences, 2003, 58(5): 757-764. DOI:10.11821/xb200305015 |
| [31] |
Pellitero R, Rea B R, Spagnolo M et al. A GIS tool for automatic calculation of glacier equilibrium-line altitudes. Computers & Geosciences, 2015, 82(C): 55-62. |
| [32] |
Lu H Y, Wu N Q, Liu K B et al. Modern pollen distributions in Qinghai-Tibetan Plateau and the development of transfer functions for reconstructing Holocene environmental changes. Quaternary Science Reviews, 2011, 30(7-8): 947-966. DOI:10.1016/j.quascirev.2011.01.008 |
| [33] |
刘思丝, 黄小忠, 强明瑞等. 孢粉记录的青藏高原东北部更尕海地区中晚全新世植被和气候变化. 第四纪研究, 2016, 36(2): 247-256. Liu Sisi, Huang Xiaozhong, Qiang Mingrui et al. Vegetation and climate change during the Mid-Late Holocene reflected by the pollen record from Lake Genggahai, northeastern Tibetan Plateau. Quaternary Sciences, 2016, 36(2): 247-256. |
| [34] |
王庆锋, 金会军, 吴青柏等. 距今约6000年以来青藏高原东北部黄河源区冻结泥炭沉积记录的气候演化. 第四纪研究, 2017, 37(2): 403-415. Wang Qingfeng, Jin Huijun, Wu Qingbai et al. Climatic evolution since 6 cal.ka B.P. recorded by frozen peat deposits in the source area of the Yellow River, northeastern Qinghai-Tibet Plateau. Quaternary Sciences, 2017, 37(2): 403-415. |
| [35] |
Liu J H, Yi C L, Li Y K et al. Glacial fluctuations around the Karola Pass, eastern Lhagoi Kangri Range, since the Last Glacial Maximum. Journal of Quaternary Sciences, 2017, 32(4): 516-527. DOI:10.1002/jqs.v32.4 |
| [36] |
Zhang J F, Xu B Q, Turner F et al. Long-term glacier melt fluctuations over the past 2500 yr in monsoonal high Asia revealed by radiocarbon-dated lacustrine pollen concentrates. Geology, 2017, 45(4): 359-362. DOI:10.1130/G38690.1 |
2 Key Laboratory of Tibetan Environment Changes and Land Surface Processes, Institute of Tibetan Plateau Research, Chinese Academy of Sciences, Beijing 100101;
3 Department of Geography, University of Tennessee, Knoxville, TN 37996, USA)
Abstract
Mountain glaciers are sensitive to climate change. Glaciers have retreated significantly since the Holocene. Landforms left behind by glaciers are direct evidences of glacier changes. The Qiangyong Glacier originates from Mt. Kaluxung (28.8°N, 90.3°E; 6674 m a.s.l.) at the northern side of the central Himalayas, which is a rain shadow region on the southern side of the Yarlung Tsangpo River. The present glacier terminates around 5000 m above sea level with an area of 6.63 km2. Four moraine sets are well-preserved in the Qiangyong valley, especially the outer moraine at the end of the bigger Qiangyong Co, which has been dated to the Neoglacial by cosmogenic 10 Be dating. The Neoglacial end moraine is about 30 m above the lake, with a sharp crest. We reconstructed the extent of the Neoglacial glacier based on the field investigation and Google Earth imagery of this outer moraine. Glacier area during the Neoglacial was about 10.0 km2, about 1.5 times of modern glacier area. Based on the simulated results of the VOLTA model, the volume of the modern glacier is about 0.21±0.04 km3 and the mean ice thickness is roughly 31.7 m. We simulated ice surface elevations during the Neoglacial based on the Longitudinal Flowline Model. The ice thickness during the Neoglacial was about 58.5 m, and the ice volume was roughly 0.59±0.12 km3, which was 2.8 times of the Modern glacier volume. The glacier volume changed more severely than the glacier area. Using the Accumulation Area Ratio Method(AAR, 0.7±0.05)and the reconstructed ice surface elevations, the Equilibrium Line Altitudes(ELA)of the Modern glacier and the Neoglacial are 5780±70 m and 5660±100 m, respectively. The ELA during Neoglacial dropped about 120 m compared to Modern ELA. Without the simulation of the ice surface elevations, the ELA during Neoglacial was derived to drop about 240 m, indicating about 120 m overestimated. Glacier expansion was driven by regional cooling during the Neoglacial, especially the cooling event at 4.2 ka. The timing of moraine formation and pollen analysis in the bigger Qiangyong Co indicated the glacier may already began to retreat at about 2.5 ka, then accelerated since about 2.2 ka. 2018, Vol.38
