2 中国科学院地质与地球物理研究所, 中国科学院新生代地质与环境重点实验室, 北京 100029;
3 浙江师范大学地理与环境科学学院, 浙江 金华 321004;
4 中国科学院大学地球科学学院, 北京 100049)
黄土高原的第四纪黄土-古土壤序列与冰芯和深海沉积是全球气候变化的三大信息库,记录了2.6 Ma以来古气候和古环境的演化历史,为东亚季风环流变化、中国西北内陆干旱化以及青藏高原隆升等方面提供了许多有价值的信息[1~10]。在黄土高原地区,东亚夏季风的强弱变化使不同时期的黄土沉积经历了不同程度的风化成壤作用,一些反映黄土风化强度的地球化学指标和同位素指标,如化学蚀变指数(CIA)[11]、Fed/Fet值[12~13]、Rb/Sr值[14~15]、Na/Al值[16]和87Sr/86Sr[17]等已被一些学者成功地用于研究东亚季风多时间尺度的演化过程。但是,由于黄土的矿物和化学成分受粒度分选效应影响[1, 11],且不同指标往往受控于特定的化学风化过程,存在不同的敏感区间。采用多指标相互印证的方法,能够更加客观的认识黄土沉积中包含的古气候信息。因此,反映黄土沉积后的风化成壤强度的指标还需进一步探索。
已有研究[18~25]已经表明,在陆相沉积中,粘土矿物组成及其结晶度的变化与过去气候变化具有密切联系。伊利石是黄土沉积中最主要的粘土矿物(<2 μm)[1]。早期的一些学者对第四纪黄土与相邻古土壤伊利石结晶度进行了对比研究[18, 26~30],发现伊利石的结晶度在剖面上的变化与黄土风化成壤强度联系密切。近年来一些学者从时空变化角度的考察结果证实了这一认识[19],并进一步提出伊利石结晶度可作为东亚夏季风强度的有效指标[20]。但以前的研究主要集中在末次间冰期以来的黄土沉积,更老层位的时空对比研究尚未报道,黄土伊利石结晶度指标的有效性需要在更长时间尺度和更广区域内开展实证研究,为进一步挖掘该指标记录的长序列古环境信息奠定基础。
基于此,本文采用X射线衍射技术,对黄土高原地区西北至东南方向的4个典型剖面代表性古土壤(S0、S1、S3、S5-1)及其下覆黄土(L1、L2、L4、L6)共8个层位开展了粘粒组分(<2 μm)的伊利石结晶度和化学指数测试分析,主要探讨:1)黄土沉积伊利石结晶度的时空变化特征及其原因;2)伊利石结晶度指标对东亚夏季风指示的有效性及空间上反映的气候梯度。
1 材料与方法 1.1 研究剖面概况在黄土高原主体地区,选择的4个研究剖面自西北向东南依次为西峰(35°53′N,107°58′E)、长武(35°12′N,107°48′E)、永寿(34°41′N,108°9′E)和渭南(34°18′N,109°30′E)(图 1)。4个剖面均处于东亚季风区,时间跨度约600 ka[31],冬季受西伯利亚高压控制,夏季盛行暖湿气流[1]。气候类型属暖温带半湿润季风气候,年平均温度分别为8.3 ℃、9.1 ℃、10.8 ℃和13.6 ℃,年平均降水量分别为555 mm、584 mm、619 mm和691 mm。剖面均选择在地势开阔、出露较好的黄土塬面上。每个剖面包含L6以来较为完整的黄土-古土壤地层序列。

|
图 1 黄土高原采样剖面位置示意图 Fig. 1 Schematic map showing the locations of sampling sections in the Chinese Loess Plateau |
在野外,以10 cm间距对每个剖面的L6上部以上(S0~L6)进行散样采集。样品在室内自然条件下风干后,通过Bartington Instruments MS2磁化率仪测量低频磁化率(MS),用于划分各剖面地层和对比成壤强度。每个剖面粘土矿物测试样品是根据其野外成壤特征和磁化率数值,分别选取古土壤层(S0、S1、S3、S5-1)发育最强的层位和下覆黄土层(L1、L2、L4、L6)发育最弱的层位的样品进行研究,每个典型层位采集一个样品,8个典型层位,4个剖面,共计选取32个样品。
粘粒样品提取步骤如下:1)分别选取黄土和古土壤样品15 g和10 g,放入烧杯后先后添加2次(每次间隔4 h)10 ml 10%的双氧水去除有机质;2)加入两次(每次间隔4 h)40 ml 1 mol/L的醋酸去除碳酸盐;3)静置过夜后,根据Stokes静水沉降法提取<2 μm的粘粒样品。所有粘粒样品分为两份,分别用1 mol/L MgCl2和1 mol/L KCl溶液饱和处理,浓缩后制成定向薄片,在自然条件下风干后上机测试。
粘土矿物测试采用PANalytical X'Pert Pro MPD粉末X射线衍射仪。仪器参数如下:电压40 kV,电流40 mA,Cu靶;扫描速度为0.002°/s,步长为0.0131°2θ,扫描范围为4°~32°2θ。测试在6种条件下分别进行,其中MgCl2薄片的测试分为原样、乙二醇和甘油处理3种;KCl薄片的测试则分为常温、400 ℃和550 ℃加热处理3种。伊利石的鉴别采用对比各种条件下的X射线衍射曲线的方法进行[32]。伊利石结晶度指数采用伊利石1.0 nm衍射峰的半高宽,即Kübler指数(KI)[33]。较低的KI值指示伊利石结晶度较好,反之结晶度较差。数据处理采用MacDiff(4.2.5)软件[34],根据乙二醇饱和处理样品的X射线衍射曲线进行拟合获得,单位为°Δ2θ。为配合研究伊利石结晶度时空变化的指示意义,本文同时计算了伊利石化学指数,即I(002)/I(001)值,是根据伊利石0.5 nm(002)与1.0 nm(001)衍射峰面积比获得[20, 35]。
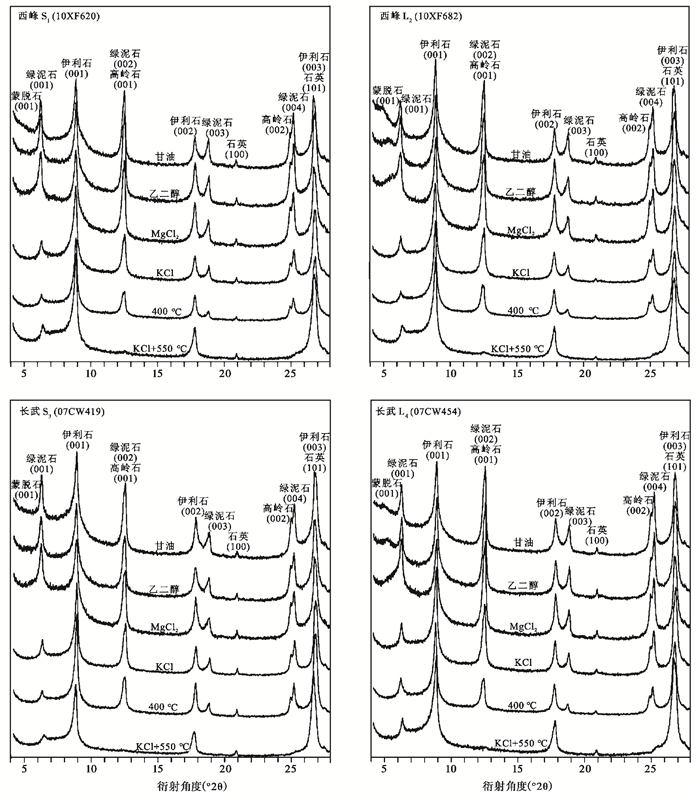
2 结果 2.1 伊利石鉴别图 2是代表性粘粒样品的X射线衍射曲线。由图 2可见,在各种测试条件下样品均在1.41 nm (6.25°2θ)、1.0 nm(8.87°2θ)、0.71 nm(12.45°2θ)、0.50 nm(17.72°2θ)、0.47 nm(18.86°2θ)、0.354 nm(25.13°2θ)和0.334 nm(26.67°2θ)处呈现较强的衍射峰。在MgCl2饱和处理的样品中,1.0 nm、0.5 nm和0.334 nm峰乙二醇和甘油饱和处理测试的结果与原样测试结果未发生变化。在KCl饱和处理的样品中,1.0 nm、0.5 nm和0.334 nm峰与原样测试结果相比基本没有发生变化,而其他衍射峰在加热处理后,峰的衍射强度显著降低或者消失。上述特征表明粘粒样品中含有伊利石,其中的1.0 nm、0.5 nm和0.334 nm峰分别为伊利石(001)、(002)和(003)峰,而伊利石0.334 nm(003)峰叠加了石英(101)衍射峰[32]。另外,根据乙二醇、甘油和加热处理可以鉴别出样品中的粘土矿物还包括高岭石、绿泥石和少量的蒙脱石,非粘土矿物主要是石英[32]。

|
图 2 西峰和长武剖面代表性粘粒样品(<2 μm)的X射线衍射曲线 Fig. 2 The typical XRD patterns of < 2 μm fraction from Xifeng and Changwu sections |
图 3是西峰、长武、永寿和渭南剖面磁化率曲线和特征时期代表样品的伊利石结晶度KI值。由图 3可见,4个剖面古土壤样品中的伊利石结晶度KI值在0.316°~0.399°Δ2θ之间,平均值为0.355°Δ2θ,黄土样品的伊利石结晶度在0.283°~0.333°Δ2θ之间,平均值为0.310°Δ2θ。每个剖面古土壤样品的伊利石结晶度KI值均高于其下覆黄土(图 3)。上述特征表明古土壤样品的伊利石结晶程度较差,黄土伊利石结晶程度较好。

|
图 3 西峰、长武、永寿和渭南剖面磁化率曲线和特征时期代表样品的伊利石结晶度KI值 五角星指示代表性样品位置 Fig. 3 Variations magnetic susceptibility and KI from Xifeng, Changwu, Yongshou, and Weinan sections. Five-pointed stars show the location of the samples |
在西峰、长武和渭南剖面,每个剖面古土壤S5-1的伊利石结晶度KI值最大,其次为S3、S1和S0。永寿剖面古土壤KI值亦为S5-1最大,其次为S1、S3和S0。上述现象与各剖面古土壤层磁化率数值大小相吻合,如长武剖面的S5-1、S3、 S1和S0的KI值分别为0.358°Δ2θ、0.353°Δ2θ、0.335°Δ2θ和0.328°Δ2θ,磁化率分别为314×10-8 m3/kg、289×10-8 m3/kg、271×10-8 m3/kg和181×10-8 m3/kg(图 3),说明本文根据野外观察和磁化率数值所选取的代表性古土壤样品基本代表了每层风化强度最高的位置。与古土壤相比,各剖面黄土样品伊利石结晶度KI值较低,并未表现出明显的规律。
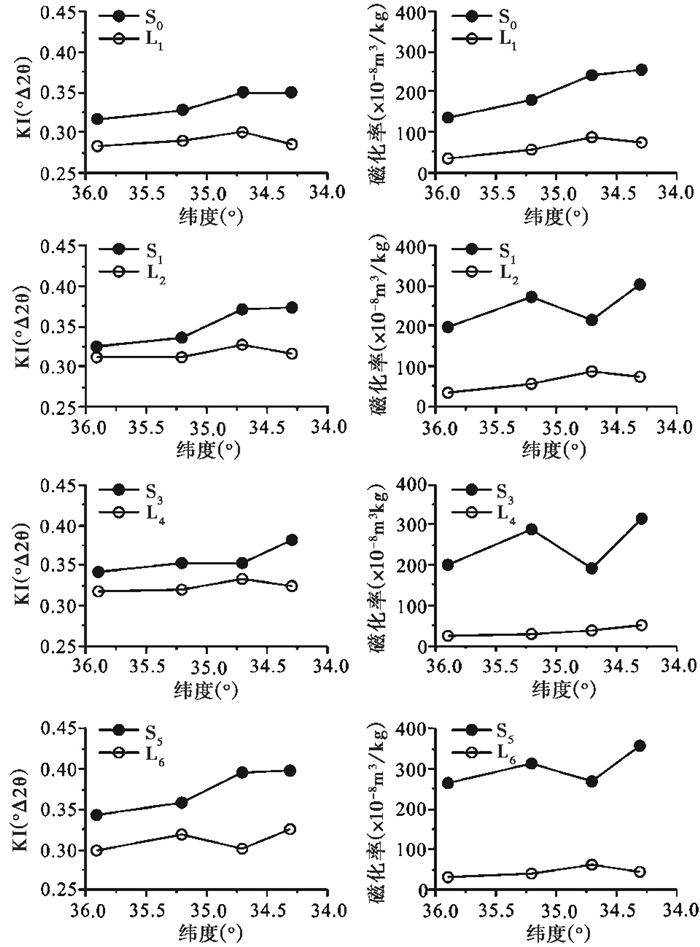
2.3 伊利石结晶度空间变化为研究伊利石结晶度空间变化特征,本文对4个剖面的每个地层单元的伊利石结晶度和磁化率进行了空间对比分析(图 4)。在每个古土壤层中,伊利石结晶度KI值和磁化率自西北向东南均呈现显著增加趋势,如S1层中,西峰的KI值为0.324°Δ2θ,至渭南则达0.373°Δ2θ;西峰的磁化率为196.5×10⁻⁸ m3/kg,到渭南则为302×10-8 m3/kg。在每个黄土层中,伊利石结晶度KI值自西北向东南呈现出较小的增加趋势,如在L1层中,变化范围在0.283°~0.3°Δ2θ之间,最北部的西峰剖面为0.283°Δ2θ,而最南部的渭南剖面仅为0.285°Δ2θ。而每个黄土层磁化率呈现出相对较显著的增加趋势,如在L1层中,最北部的西峰剖面为35.1×10-8 m3/kg,而最南部的渭南剖面则为75×10-8 m3/kg。

|
图 4 西峰、长武、永寿和渭南剖面伊利石结晶度和磁化率空间变化 Fig. 4 Spatial changes of the illite crystallinity and magnetic susceptibility from Xifeng, Changwu, Yongshou, and Weinan sections |
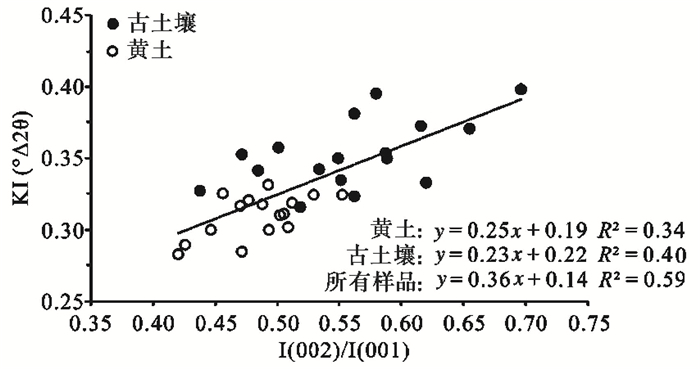
伊利石化学风化指数能够反映伊利石的性质和成因[20, 35~36]。按照Esquevin[35]的划分标准,伊利石化学指数I(002)/I(001)比值小于0.15代表富Fe-Mg伊利石(黑云母),为物理风化作用的结果,而比值大于0.5则指示富Al伊利石(白云母),代表了较为强烈的水解作用。由图 5看出,伊利石化学指数I(002)/I(001)值在黄土-古土壤中的变化范围为0.421~0.696,其中,黄土变化范围在0.421~0.552之间(平均值为0.484),总体上指示了介于富Fe-Mg和富Al伊利石之间的类型,而古土壤变化范围在0.438~0.696之间(平均值为0.556),总体上指示了富Al伊利石的类型。上述特征表明古土壤的风化强度显著高于黄土。

|
图 5 西峰、长武、永寿和渭南剖面黄土-古土壤样品的化学风化指数与伊利石结晶度相关关系 Fig. 5 Linear correlation between the illite chemistry index and illite crystallinity from Xifeng, Changwu, Yongshou and Weinan eolian deposits |
现代土壤学研究[37]表明,土壤和沉积物中碎屑成因的伊利石在干冷气候条件下以物理风化作用为主,伊利石保存良好,晶体结构没有发生变化;在暖湿的温带地区,随着成壤作用的增强,伊利石晶体结构发生变化,结晶程度降低[37]。因此,伊利石结晶度指数被广泛用来指示土壤或沉积物风化作用强度[19~20]。
在黄土高原地区的黄土-古土壤序列中,黄土层一般形成于干冷的冰期,此时粉尘以堆积过程为主,风化成壤作用较弱,而古土壤则是形成在较为暖湿的间冰期,风化成壤作用较强[1]。由图 3和图 4可见,所有剖面黄土样品的伊利石结晶度KI值在时间和空间变化上差异不大,并且与上覆古土壤相比呈现出较低的值,表明黄土伊利石的结晶程度比古土壤高,经历的风化作用弱,这与野外土壤观察[12]、磁化率[31]和古风化强度(Fed/Fet)[10]等指标记录相吻合。本文选择的黄土样品来自冰期极盛期,其伊利石化学指数I(002)/I(001)平均值为0.484,大于以物理风化为主的0.15,野外观察特征以及磁化率[10]指标都显示出所选黄土样品成壤作用较弱,这说明形成黄土的粉尘在沉积前已经经历了一定程度的化学风化作用,与以前常量元素地球化学[16]、微量元素地球化学特征[38]和U-Th同位素[39]等研究结论是一致的。
4个剖面的古土壤(S5-1、S3、S1、S0)样品KI值均高于下覆黄土(L6、L4、L2、L1)样品。从总体上看,古土壤KI值大小顺序与磁化率大小变化相对应(图 3),而且古土壤样品的KI值与磁化率之间具有很好的线性关系(图 6)。在空间上,古土壤KI值自西北向东南逐渐增加的趋势也与磁化率指标具有很好的一致性。伊利石化学风化指数I(002)/I(001)值是指示沉积物风化作用的有效指标[36~37]。本文研究结果显示,古土壤的I(002)/I(001)值整体上高于黄土。黄土和古土壤样品的KI值与伊利石化学风化指数I(002)/I(001)亦存在显著的正相关关系,即伊利石化学风化指数越高,伊利石结晶度越大(图 5),古土壤较高的KI值对应较高的伊利石化学风化指数。上述研究结果充分表明,古土壤较高的KI值是由于风化成壤作用所致,可作为风化成壤强度的指标。以前,对于伊利石结晶度及其古环境意义的研究主要集中在末次间冰期以来的黄土和古土壤序列[19]。本文黄土高原L6以来黄土-古土壤伊利石结晶度的时空变化特征亦证明了这一认识。

|
图 6 西峰、长武、永寿和渭南剖面风尘堆积伊利石结晶度与磁化率相关关系 Fig. 6 Linear correlation between the illite crystallinity and magnetic susceptibility from Xifeng, Changwu, Yongshou and Weinan eolian deposits |
在黄土高原地区,黄土沉积的风化成壤作用主要取决于夏季的温度和降水,而温度和降水则与东亚夏季风环流强度紧密相关[1, 31]。本文研究表明,黄土和古土壤样品的伊利石结晶度KI值自西北向东南均有增加趋势,该变化特征与黄土高原现代气候要素空间格局特征相一致[31]。因此,伊利石结晶度指标KI值与磁化率、Fed/Fet值一样[12]可以作为东亚夏季风的指标。古土壤较高的KI值和西北-东南向梯度增加,表明在黄土高原地区间冰期时东亚夏季风环流影响显著,气候南北变化梯度大。而黄土较低KI值和自西北向东南较弱的增加趋势反映出冰期时黄土高原夏季风环流影响微弱,气候南北变化梯度小。上述间冰期和冰期黄土高原气候南北变化梯度大小的差异可能是由黄土高原本身地理位置造成。间冰期时,黄土高原处于夏季风影响范围北缘;冰期时,夏季风影响范围无法贯穿黄土高原地区或者仅到达黄土高原南缘[31, 40]。
4 结论本文对黄土高原地区的西峰、长武、永寿和渭南剖面L6以来黄土-古土壤序列中代表性层位的粘粒样品(<2 μm)伊利石结晶度指数时空变化特征进行了分析,结合磁化率和伊利石化学风化指数I(002)/I(001)值,对伊利石结晶度的古环境意义进行了探讨。获得如下初步认识:
(1) 黄土样品的伊利石结晶度KI值在时间和空间变化上差异较小,并且与上覆古土壤相比呈现出较低的值。黄土伊利石化学指数I(002)/I(001)值介于富Fe-Mg和富Al伊利石之间的类型,指示经历了一定程度的化学风化作用,但这种作用主要是在黄土沉积前形成的。
(2) 在古土壤中,每个剖面样品KI值均高于下覆黄土样品,空间上呈现自西北向东南逐渐增加的趋势,而且所有样品KI值与磁化率和伊利石化学风化指数I(002)/I(001)值均存在显著的正相关关系。上述研究结果充分表明古土壤较高的KI值是由于风化成壤作用所致。结合黄土高原现代气候特征,伊利石结晶度指标KI值可以作为东亚夏季风的指标。
(3) 在黄土高原地区,黄土沉积的伊利石结晶度KI值时空变化显示出冰期时黄土KI值自北向南增加趋势小,而间冰期自北向南增加趋势显著,这说明间冰期时黄土高原夏季风南北气候变化梯度大于冰期。
致谢: 感谢审稿专家和编辑部杨美芳老师对本文提出了建设性的修改意见。
| [1] |
刘东生等. 黄土与环境. 北京: 科学出版社, 1985: 1-481. Liu Tungsheng et al. Loess and the Environment. Beijing: Science Press, 1985: 1-481. |
| [2] |
An Z S, John E K, Warren L P et al. Evolution of Asian monsoons and phased uplift of the Himalaya-Tibetan Plateau since Late Miocene times. Nature, 2001, 411(6833): 62-66. DOI:10.1038/35075035 |
| [3] |
Ding Z L, Derbyshire E, Yang S L et al. Stacked 2.6 Ma grain size record from the Chinese loess based on five sections and correlation with the deep-sea δ18O record. Paleoceanography, 2002, 17(3): 511-521. |
| [4] |
Guo Z T, Ruddiman W F, Hao Q Z et al. Onset of Asian desertification by 22 Myr ago inferred from loess deposits in China. Nature, 2002, 416(6877): 159-163. DOI:10.1038/416159a |
| [5] |
Guo Z T, Zhou X, Wu H B. Glacial-interglacial water cycle, global monsoon and atmospheric methane changes. Climate Dynamics, 2012, 39(5): 1073-1092. DOI:10.1007/s00382-011-1147-5 |
| [6] |
Lu H, Zhang F, Liu X et al. Periodicities of palaeoclimatic variations recorded by loess-paleosol sequences in China. Quaternary Science Reviews, 2004, 23(18): 1891-1900. |
| [7] |
Chen F, Feng Z, Zhang J. Loess particle size data indicative of stable winter monsoons during the last interglacial in the western part of the Chinese Loess Plateau. Catena, 2000, 39(4): 233-244. DOI:10.1016/S0341-8162(00)00083-7 |
| [8] |
Song Y G, Fang X M, King J W et al. Magnetic parameter variations in the Chaona loess/paleosol sequences in the central Chinese Loess Plateau, and their significance for the Middle Pleistocene climate transition. Quaternary Research, 2014, 81(3): 433-444. DOI:10.1016/j.yqres.2013.10.002 |
| [9] |
Hao Q Z, Wang L, Oldfield F et al. Delayed build-up of Arctic ice sheets during 400, 000-year minima in insolation variability. Nature, 2012, 490(7420): 393-396. DOI:10.1038/nature11493 |
| [10] |
郝青振, 郭正堂. 1.2 Ma以来黄土-古土壤序列风化成壤强度的定量化研究与东亚夏季风演化. 中国科学(D辑), 2001, 44(6): 520-528. Hao Qingzhen, Guo Zhengtang. Quantitative measurements on the paleo-weathering intensity of the loess-soil sequences and the implication on paleomonsoon. Science in China(Series D), 2001, 44(6): 566-576. |
| [11] |
Yang S, Ding F, Ding Z. Pleistocene chemical weathering history of Asian arid and semi-arid regions recorded in loess deposits of China and Tajikistan. Geochimica et Cosmochimica Acta, 2006, 70(7): 1695-1709. DOI:10.1016/j.gca.2005.12.012 |
| [12] |
Guo Z T, Biscaye P, Wei L Y et al. Summer monsoon variations over the last 1.2 Ma from the weathering of loess-soil sequences in China. Geophysical Research Letters, 2000, 27(12): 1751-1754. DOI:10.1029/1999GL008419 |
| [13] |
葛俊逸, 郭正堂, 郝青振. 特征时期黄土高原风化成壤强度的空间特征与气候梯度. 第四纪研究, 2006, 26(6): 962-968. Ge Junyi, Guo Zhengtang, Hao Qingzhen. Spatial variations of weathering intensity of the Loess Plateau and the climate gradients within characteristic timeslices. Quaternary Sciences, 2006, 26(6): 962-968. |
| [14] |
Chen J, An Z, Head J. Variation of Rb/Sr ratios in the loess-paleosol sequences of Central China during the last 130, 000 years and their implications for monsoon paleoclimatology. Quaternary Research, 1999, 51(3): 215-219. DOI:10.1006/qres.1999.2038 |
| [15] |
陈旸, 陈骏, 刘连文等. 最近13万年来黄土高原Rb/Sr记录与夏季风时空变迁. 中国科学(D辑), 2003, 33(6): 513-519. Chen Yang, Chen Jun, Liu Lianwen et al. Spatial and temporal changes of summer monsoon on the Loess Plateau of Central China during the last 130 ka inferred from Rb/Sr ratios. Science in China(Series D), 2003, 33(6): 513-519. |
| [16] |
顾兆炎, 丁仲礼, 熊尚发等. 灵台红粘土和黄土-古土壤序列的地球化学演化. 第四纪研究, 1999, 30(4): 357-365. Gu Zhaoyan, Ding Zhongli, Xiong Shangfa et al. A seven million geochemical record from Chinese red-clay and loess-paleosol sequence:Weathering and erosion in Northwestern China. Quaternary Sciences, 1999, 30(4): 357-365. |
| [17] |
Yang J D, Chen J, Tao X C et al. Sr isotope ratios of acid-leached loess residues from Luochuan, China:A tracer of continental weathering intensity over the past 2.5 Ma. Geochemical Journal, 2001, 35: 403-412. DOI:10.2343/geochemj.35.403 |
| [18] |
季峻峰, 陈骏, 王洪涛. 陕西洛川黄土-古土壤剖面中伊利石结晶度——黄土物质来源和古气候环境的指示. 地质论评, 1997, 43(2): 181-185. Ji Junfeng, Chen Jun, Wang Hongtao. Crystallinity of illite from the Luochuan loess-paleosol sequence, Shaanxi Province:Indicator origin and paleoclimate of loess. Geological Review, 1997, 43(2): 181-185. |
| [19] |
贾伟丽, 彭淑贞, 张伟等. 末次间冰期以来黄土中伊利石结晶度的变化与古环境. 第四纪研究, 2014, 34(3): 553-559. Jia Weili, Peng Shuzhen, Zhang Wei et al. Variations of illite crystallinity in the Chinese loess deposits since the last interglacial periods and paleoclimatic significance. Quaternary Sciences, 2014, 34(3): 553-559. |
| [20] |
何超, 朱丽东, 彭淑贞等. 西峰风尘堆积的伊利石结晶度及古环境指示. 第四纪研究, 2017, 37(2): 393-401. He Chao, Zhu Lidong, Peng Shuzhen et al. Paleoenvironmental significance of illite crystallinity in Xifeng eolian dust deposits. Quaternary Sciences, 2017, 37(2): 393-401. |
| [21] |
Zeng M X, Song Y G, An Z S et al. Clay mineral records of the Erlangjian drill core sediments from the Lake Qinghai Basin, China. Science China:Earth Sciences, 2014, 57(8): 1846-1859. DOI:10.1007/s11430-013-4817-9 |
| [22] |
Zhang C X, Guo Z T, Deng C L et al. Clay mineralogy indicates a mildly warm and humid living environment for the Miocene hominoid from the Zhaotong Basin, Yunnan, China. Scientific Reports, 2016, 6: 20012. DOI:10.1038/srep20012 |
| [23] |
Zhang C X, Guo Z T. Clay mineral changes across the Eocene-Oligocene transition in the sedimentary sequence at Xining occurred prior to global cooling. Palaeogeography, Palaeoclimatology, Palaeoecology, 2014, 411(1): 18-29. |
| [24] |
胡彬, 张春霞, 郭正堂. 石膏岩中粘土矿物提取的一种新方法及在古气候重建中的应用. 第四纪研究, 2016, 36(4): 926-934. Hu Bin, Zhang Chunxia, Guo Zhengtang. A new method of clay mineral extraction from gypsum layer and its application in paleoclimate reconstruction. Quaternary Sciences, 2016, 36(4): 926-934. |
| [25] |
王春虹, 李明慧, 方小敏等. 柴达木盆地西部SG-1钻孔中伊蒙混层结构特征及环境意义. 第四纪研究, 2016, 36(4): 917-925. Wang Chunhong, Li Minghui, Fang Xiaomin et al. Structural characteristic of mixed layer illite/smectite clay minerals of the SG-1 core in the western Qaidam Basin and its environmental significance. Quaternary Sciences, 2016, 36(4): 917-925. |
| [26] |
彭淑贞, 郭正堂. 风成三趾马红土与第四纪黄土的粘土矿物组成异同及其环境意义. 第四纪研究, 2007, 27(2): 277-285. Peng Shuzhen, Guo Zhengtang. Clay mineral composition of the tertiary red clay and the Quaternary loess-paleosols as well as its environment implication. Quaternary Sciences, 2007, 27(2): 277-285. |
| [27] |
Peng S Z, Hao Q Z, Oldfield F et al. Release of iron from chlorite weathering and links to magnetic enhancement in Chinese loess deposits. Catena, 2014, 117(2): 43-49. |
| [28] |
郑洪汉. 黄土高原黄土-古土壤的矿物组成及其环境意义. 地球化学, 1994, 23(C00): 113-123. Zheng Honghan. Mineral composition of loess-paleosol in the Loess Plateau of China and its environment implications. Geochimica, 1994, 23(C00): 113-123. |
| [29] |
Guo Z T. Succession des paleosols et des loess du center-ouest de la Chine: Approche micro-morphologique[D]. Paris-Grenoble: ANRT, 1990: 1-266. https://www.mysciencework.com/publication/show/succession-de-paleosols-et-des-loess-du-centre-ouest-de-la-chine-approche-micromorphologique-5b73909b
|
| [30] |
陈莉, 张立飞, 王河锦等. 陕北洛川黄土中两种不同类型的伊利石. 科学通报, 2004, 49(23): 2449-2454. Chen Li, Zhang Lifei, Wang Hejin et al. Two different illites in Luochuan loess, Northern Shaanxi Province. Chinese Science Bulletin, 2004, 49(23): 2449-2454. DOI:10.3321/j.issn:0023-074X.2004.23.015 |
| [31] |
Hao Q Z, Guo Z T. Spatial variations of magnetic susceptibility of Chinese loess for the last 600 kyr:Implications for monsoon evolution. Journal of Geophysical Research, 2005, 110: B12101. DOI:10.1029/2005JB003765 |
| [32] |
Moore D M, Reynolds R C. X-ray Diffraction and the Identification and Analysis of Clay Minerals. Oxford: Oxford University Press, 1989: 1-322.
|
| [33] |
Kübler B. Les argiles, indicateurs de metamorphisme. Revue Institute Francais Pe'trole, 1964, 19(10): 1093-1112. |
| [34] |
Petschick R. MacDiff 4. 2. 5(online)[CP]. Available: http://www.ccp14.ac.uk/ccp/web-mirrors/krumm/macsoftware/macdiff/MacDiff.html. Petschick, 2000. Download 01-12-2009.
|
| [35] |
Esquevin J. Influence de la composition chimique des illites surcristallinite. Bulletin de Centre Recherches, Rau-SNPA, 1969, 3(1): 147-153. |
| [36] |
Liu Z F, Colin C, Li X J et al. Clay mineral distribution in surface sediments of the northeastern South China Sea and surrounding fluvial drainage basins:Source and transport. Marine Geology, 2010, 277(1): 48-60. |
| [37] |
Chamley H. Clay Sedimentology. Berlin: Springer, 1989: 21-49, 487-588.
|
| [38] |
梁美艳, 郭正堂, 顾兆炎. 中新世风尘堆积的地球化学特征及其与上新世和第四纪风尘堆积的比较. 第四纪研究, 2006, 26(4): 657-664. Liang Meiyan, Guo Zhengtang, Gu Zhaoyan. Geochemical characteristics of the Miocene eolian deposits and comparison with Pliocene and Quaternary eolian deposits. Quaternary Sciences, 2006, 26(4): 657-664. |
| [39] |
Gu Z Y, Lal D, Liu T S et al. Weathering histories of Chinese loess deposits based on U-Th series nuclides and cosmogenic 10Be. Geochimica et Cosmochimica Acta, 1997, 61: 5221-5231. DOI:10.1016/S0016-7037(97)00313-X |
| [40] |
Jiang W Y, Yang X X, Cheng Y F. Spatial patterns of vegetation and climate on the Chinese Loess Plateau since the Last Glacial Maximum. Quaternary International, 2014, 334-335: 52-60. DOI:10.1016/j.quaint.2013.10.039 |
2 Key Laboratory of Cenozoic Geology and Environment, Institute of Geology and Geophysics, Chinese Academy of Sciences, Beijing 100029;
3 College of Geography and Environmental Sciences, Zhejiang Normal University, Jinhua 321004, Zhejiang;
4 College of Earth Sciences, University of Chinese Academy of Sciences, Beijing 100049)
Abstract
Illite crystallinity(Kübler index, KI)of loess deposits is a useful proxy for the East Asian summer monsoon study in the Chinese Loess Plateau. However, a few studies have only mainly concentrated on temporal-spatial analysis of the record since the last interglacial periods. In this paper, the temporal-spatial changes of the KI were investigated on the < 2 μm of samples(S0, L1, S1, L2, S3, L4, S5-1, and L6)from 4 loess-paleosol profiles in the Chinese Loess Plateau spanning the last 600 ka. The 4 studied sections, Xifeng(XF:35°53'N, 107°58'E), Changwu(CW:35°12'N, 107°48'E), Yongshou(YS:34°41'N, 108°9'E) and Weinan(WN:34°18'N, 109°30'E) lie along a NW-SE transect across the Chinese Loess Plateau. The mean annual temperature(MAT)and mean annual precipitation(MAP)of these sections are 8.3℃ and 555 mm, 9.1℃ and 584 mm, 10.8℃ and 619 mm, and 13.6℃ and 691 mm, respectively. Clay minerals were measured by X-ray diffraction(XRD)on oriented mounts of clay-sized particles(< 2 μm). All samples analyzed for clay minerals were disaggregated in deionized water and treated with 10% H2O2 and 1 mol/L HAC to remove organic materials and carbonate. The particles(< 2 μm)were then subject to pipetting based on Stokes' law. Oriented specimens were prepared on glass slides by the pipette method at room temperature. Illite crystallinity(KI)was obtained from the full width half maximum(FWHM)of the 1.0 nm peak(Δ°2θ). Lower KI values represent higher crystallinity, characteristic of weak hydrolysis in continental sources and dry and cold climate conditions. Illite chemistry index I(002)/I (001) was determined by the ratio of the illite (002) and illite (001) peak areas. Higher I(002)/I (001) values represent stronger chemical weathering under wet and warm climate conditions. Results show that the KI values in each section are higher in the palesols than in the underlying loess units. Spatially, the KI values of each of the stratigraphic palesol units, S0, S1, S3 and S5-1, increased significantly from northwest to the southeast, while the increasing trend was weak in the loess units. There is a positive correlation between the KI values and magnetic susceptibility, illite chemical index values I(002)/I(001) in all samples from the four sections. It indicates that the higher KI values in the palesols are primarily caused by in situ pedogenesis. Furthermore, the spatial variations of KI values along the four sections are highly consistent with the present-day climate pattern of the Chinese Loess Plateau. Therefore, the illite crystallinity(KI)can be used as a more quantitative, sensitive proxy of the East Asian summer monsoon. The higher KI values and the steeper S-N gradient in the palesols indicate a significantly strengthened summer monsoon and the stronger S-N gradients on the Chinese Loess Plateau during interglacial times. The lower KI values and weaker S-N gradients in loess unites indicate a negligible effect of the summer monsoon and weak S-N climate gradients during glacial times. 2018, Vol.38

