 2017, Vol.37

② 中国科学院西北生态环境资源研究院, 冰冻圈科学国家重点实验室, 兰州 730000;
③ 北京师范大学, 地表过程与资源生态国家重点实验室, 北京 100875)
气候变化情景下,冰盖表面物质平衡可以直接影响海平面变化,是研究南北极冰盖物质输入和输出的重要参数[1]。据研究,由于西南极的冰架快速融化和崩塌,南极冰盖对海平面的贡献已由1992~2001年间的0.08(-0.10至0.27) mm/a上升至2002~2011年间的0.40(0.20至0.61) mm/a[2]。与此同时,有研究指出南极冰盖物质损失的增强,部分被东南极降雪的增加所抵消[3~5]。通过冰芯记录和气候模拟发现南极的降雪量随着气温的上升而增加;通过卫星雷达和激光测高研究发现近几十年来东南极的降雪有所增加[6],特别是Droning Maud Land地区,2009年后发生了多次高降雪事件[7, 8]。当然,也有研究指出虽然过去几十年中南极海岸地区降雪增强,但整个南极的平均降雪并没有发生长期变化[9~12]。
冰芯是提供南北极降雪历史记录的重要手段之一,也是校正冰雷达等时层[13~15]、驱动冰盖流动模式和定年模式[16]、以及评估区域气候模式[17]的重要基础资料。然而,相比于南极广袤的面积,目前的冰芯记录仍然十分稀少,特别是南极冰盖高原。由于局地气候背景的不同,南极某些地区的冰芯记录显示过去一百年中降雪持续增加[18],另外一些地区则处于减少趋势[19]。从全南极尺度来看,虽然南极冰盖雪积累率有所增加,但趋势并不显著[20]。
一般来讲,随着纬度升高和距海岸距离的加大,南极冰盖降雪逐步降低,所获取的冰芯记录分辨率同时下降,因此很难同时获取时间分辨率高、时间序列长的冰芯。在近岸地区,因为冰盖厚度较薄,年降雪量高,因此很少有超过200年的冰芯记录。为了更好地研究南极冰盖物质平衡和气候变化,冰盖物质平衡和海平面变化研究计划(Ice Sheet Mass Balance and Sea Level,简称ISMASS)多次呼吁加强东南极冰盖近岸地区冰芯记录的获取(http://www.scar.org/ssg/physical-sciences/ismass)。
受到冰盖/冰川运动的影响,冰芯定年的误差会随着深度的增加而增加,因为冰流的水平运动会造成年层向四周扩展,因此而变薄。一般来说,在东南极内陆冰盖地区,由于应力变形引起的水平延展率在0.01 % /a;若冰芯的长度不超过100m,相对于冰盖的厚度就可以忽略,相对误差也不会超过5 % [13]。但是在运动较快的冰川、近岸冰盖或冰架地区,即使浅冰芯也会受到很大影响,需要进行校正。
过去几十年中,大多数冰芯研究都集中在气温变化和环境变化上(同位素、可溶性离子和痕量金属记录)[21],降雪记录恢复则少有出现。即使冰芯降雪记录,很多研究也未考虑冰流作用[20],可能造成了不同程度的误差,对于评估南极冰盖表面物质平衡产生了无法估量的影响。
2002年,中国南极考察队在东南极冰盖近岸地区LGB69钻取了一支102m的冰芯。本文选用该冰芯,通过两种冰流模型消除了冰盖运动的影响,恢复其过去300年历史降雪记录。本研究所得结果对过去全球变化研究计划2000年工作组(PAGES 2k)具有重要帮助。
2 数据与方法 2.1 冰芯采集2002年1月,中国南极科学考察第18次考察队,在东南极冰盖Lambert冰川流域LGB69(70°50′06.6″S,77°04′28.9″E;1850m a.s.l.,图 1),采用中国科学院冰冻圈科学国家重点实验室自主研发的BXZ-100电动机械钻钻取了一支102m的冰芯。该点距南极大陆海岸约为160km,据气象站观测年均积累率约为70cm/a,风速约为8.5m/s,主风向为东北偏东风57度,表面分布有高度介于0~20cm的雪丘[22, 23]。冰芯钻取期间,用游标卡尺测量冰芯直径,记录每段长度,并用电子秤称重,放入塑料桶内依顺序编号,最后装入保温箱保存。冰芯钻取和搬运严格按规范操作,避免污染和融化。

|
图 1 LGB69冰芯位置示意 Fig. 1 Location of LGB69, East Antarctica |
定年是对冰芯资料进行研究的第一步,也是其他研究工作的基础。以海洋飞沫来源为主的离子如Cl-、Na+和K+受到海洋表面环境的影响,在冰芯中呈现出明显的季节循环,可以在高积累地区用于定年;氢氧稳定同位素比率与降水发生时的气温有关,也是定年的重要指标;火山爆发释放大量的SO2,约一个月后被氧化成硫酸,并在空气中留存很长时间,所以能随着大气环流传输到南极地区,一定时间后(取决于喷发地点,一般不超过3年)沉降到南极雪冰中,是长时间序列冰芯定年的重要手段;放射性物质参考层、理论模型、古温度记录等也可以用于冰芯定年[24]。
为了能获得准确的冰芯年代记录,考察队回国后将冰芯送至美国缅因大学进行分样处理,并利用离子色谱仪(Dionex IC)分析了主要可溶性离子(Na+、K+、Mg2+、Ca2+、Cl-、NO3_、SO42-和MSA)。根据火山事件法,Li等[25]确定了冰芯中的主要年层深度;之后我们根据主要海盐离子的季节性变化,利用年层法确定了该冰芯的详细年代,该冰芯顶部年层为2001年,底部年层为1708年(图 2a)。季节性参数所确定的定年结果与冰芯中保存的历史重大火山记录年代[25]一致,通过与全球火山喷发计划进行对比[25],可知定年误差约为± 2a。

|
图 2
(a)LGB69冰芯非海源硫酸根浓度(nssSO42-)记录的1708~2001年火山事件喷发记录[25];(b)LGB69冰芯Na+和Cl-记录定年示意;(c)LGB69冰芯甲基磺酸(MSA)和Mg2+记录定年示意
(a)蓝色实线为nssSO42-浓度记录,黑色虚线为nssSO42-浓度的本底值加上两倍的标准差; (b)黑色实线和红色实线分别代表Na+和Cl-的浓度;(c)蓝色实线和绿色实线分别代表Mg2+和MSA的浓度 Fig. 2 (a)The whole profile of nssSO42-, including all the detected volcanic signals and the prominent events used as time markers during 1708~2001A.D; (b)The dating records by Na+ and Cl- concentration of LGB69; (c)The dating records by MSA and Mg2+ concentration of LGB69. (a)The blue line represents nssSO42- concentration and the dashed straight line shows the threshold value for the volcanic signals(background mean+2s); (b)Black line and red line represent Na+ and Cl-respectively; (c)Blue line and green line represent Mg2+ and MSA respectively |
如前言所述,沉积后过程不仅仅会影响垂直方向上的雪层密度,还会造成雪层的侧向变形。如果不考虑冰流所导致的雪层侧向变形,会低估冰芯年层厚度,进而影响对降雪/积累率的重建,这种误差会随着深度的增加而增大,也与冰流速度、底部滑动速度等因素有关。目前有3种方法/模型可用于校正该误差:1) 幂律模型(power-law model)[26];2) 分段线性模型(a piece-wise linear model,后称D-J模型)[27];3) 完全线性模型(fully linear model,后称Nye模型)[28]。其中幂律模型需要测量钻孔的水平位移,我们未在LGB69冰芯钻取的时候测量该参数,因此,本研究使用D-J模型和Nye模型进行计算。
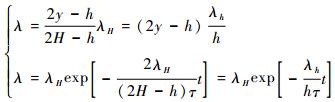
2.3.1 Nye模型Nye模型假设在冰盖的任一垂直面上垂直应变率全都相同,同时忽略冰盖底部的融化作用,并假定冰层运动为水平平行的。因此,冰层的初始厚度(λH)与减薄后的厚度的比值和冰层所处的高度之间存在直接联系。关系式如下:

|
(1) |
公式(1) 中y和H分别是冰层现在和初始的距离基岩高度。由此,我们可以得到在该模型中单位时间内的变化为:
|
(2) |
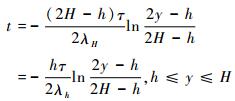
τ为1年。整合上式得到关于时间的函数如下:
|
(3) |
由此,结合公式(1),我们可以得到不同年代的冰层距离基岩的高度:

|
(4) |
因此,冰盖表面下H-y处的冰层年龄为:
|
(5) |
该模型假设水平速度廓线v与据基岩高度(y)、水平位移距离(x)之间存在一定的关系,表示为:

|
(6) |
结合Glen法则(Glen's law)[29],可以得到:
|
(7) |
公式(7) 中,σ为剪切应力;k′和n分别为取决于温度的常数;y为冰层离底部的高度。只有当任意高度(y)纵向的应变率相比于剪切应力都较少时,公式(7) 才需要进行修正。然而,利用Weertman公式[30]对公式(7) 进行转换发现,我们可以用一个简单的近似来对公式(7) 进行求解。近似结果如下:
|
(8) |
Dansgaaard和Johnsen[27]研究发现,冰盖内部水平运动速度会随着深度的增加而增加,直到约400m,水平速度基本不再增加。因此,在计算中,h一般设定为400m,在400m以上认定f(y)为定值。
另一方面,根据冰的不可压缩性可以得到:
|
(9) |
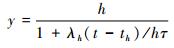
由此垂直速率的部分可以计算为:
|
(10) |
并且,结合公式(8) 可以得到:
|
(11) |
当y=h时,
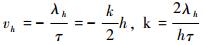
|
(12) |
当y=H时,
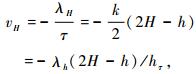
|
(13) |
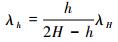
|
(14) |
将式(12)、(13) 和(14) 代入公式(11) 可以得到:
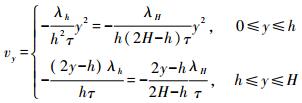
|
(15) |
将上式的结果与Nye模型的结果进行比较可以发现,当h≤y≤H时,可以用Nye模型的方程来表示,在该范围内Nye模型的直线与y轴的交点为h/2。分别用H-h/2和y-h/2来代替H和y,代入到式(1) 可以得到:
|
(16) |
|
(17) |
而在范围为0≤y≤h时,有式(15) 可以得到:
|
(18) |
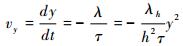
当间距不断减少,h和th无限趋近与y和t,即h→y和th→t。其中th为当y=h时,可由式(17) 计算得。由此:
|
(19) |
或者,

|
(20) |
同时结合式(18) 和式(19) 可得:
|
(21) |
由上文介绍可知,Nye模型为经典模型,其假设冰层的初始厚度λH与减少后的厚度的比值与冰层所处的高度之间呈线性关系,即不同高度层上冰层扩散速率均为恒定值。D-J模型则假设水平扩散速率与高度并不是简单的线性关系,认为水平速度廓线与距基岩高度、水平位移距离x之间存在一定的函数关系。相比Nye模型,D-J模型更接近实际情况,并通过观测及Glen法则[29]发现水平扩散速率与高度之间的呈曲线关系。
3 结果与讨论 3.1 年降雪量/雪积累率恢复如上所述,在钻取LGB69冰芯时,我们记录了冰芯直径、每段长度以及重量,进而我们可以获取该冰芯的密度随深度的变化。通过图 3可以看出,LGB69冰芯的表层雪密度约为400kg/m3,受到沉积后作用特别是密实化作用的影响,在12.9m深度达到第一临界密度(550kg/ m3),密实化过程由机械压密阶段转变为塑性变形和再结晶阶段;然后密度增大减缓,在80m深度达到第二临界密度(830~840kg/ m3),冰内气泡封闭,雪转换为冰,密度变化趋势进一步减小。

|
图 3 LGB69冰芯雪冰密度随深度变化 黑点为实测密度,灰色实线为使用LGGE粒雪化模式模拟的密度曲线;LGGE粒雪化模式为冰芯深度-密度-年代之间的经验关系,在本研究中年均气温设定为-28.2℃,年降雪量设定为28.6cm水当量[31] Fig. 3 The variation of snow density at LGB69. Black dot indicates the measured snow density, and grey line represents simulated snow profile by LGGE densification model. To force the LGGE model developed by Arnaud et al.(2000)[31] based on empirical relationship of depth-density-dating, we set the annual mean air temperature and annual mean snowfall as -28.2℃ and 28.6cm water equivalent |
利用拟合公式对密度进行插值,结合冰芯定年深度,我们可以计算得到LGB69的逐年降雪序列。之后,使用Nye模型和D-J模型,我们计算得到了LGB69站点1708~2001年间年降雪量的校正序列(表 1和图 4a),该区域平均年降雪量为261.7±69.7kg/ m2a。根据经验,我们将过去293年划分为不同的时期(图 4b,表 1),分别具有不同的降雪量(以D-J模型校正为例):1708~1863年,年降雪量为264.8±63.4kg/ m2a;1863~1884年,年降雪量为236.4±50.3kg/ m2a;1884~1917年,年降雪量为319.6±84.6kg/ m2a;1917~1937年,年降雪量为293.5±66.4kg/ m2a;1937~1971年,年降雪量为207.5±48.1kg/ m2a;1971~2001年,年降雪量为240.2±58.8kg/ m2a。从图 4b和表 1可以看出,1708~1863年间,LGB69年降雪量非常稳定,之后则变化快速,特别是1884~1917年间,该处降雪突然升高,显著高于平均水平。主要原因可能有两个:一是全球气温快速变化使得中低纬度向南极输送水汽的能力发生快速变化[32];二是LGB69地处冰盖边缘,其降水与普里兹湾附近的海冰面积变化有关[33],海冰面积减小有利于更多水汽输送至南极冰盖,反之亦然。同时,南极海冰变化还受到南极环状模(SAM)强度变化的影响,与全球气温升降并不是严格正相关关系[34]。
| 表 1 LGB69地区不同时期的年降雪量变化(计算时不包含每段时期的第一年) Table 1 The annual mean snowfall during specific periods at LGB69 (The first year of every period is not included for calculation) |

|
图 4 (a)由冰芯反演得到的LGB69站点年降雪量变化(1708~2001A.D.);(b)根据经验划分的不同时期年降雪量变化 (a)黑、红、蓝色细线分别代表未校正、Nye模型校正和D-J模型校正年降雪量,对应粗线为11年滑动平均;(b)蓝色粗线为经D-J模型校正的LGB69年降雪量11年滑动平均,红色虚线为特定时期年降雪量量 Fig. 4 (a)The variation(1708~2001A.D.) of annual mean snowfall reconstructed by LGB69 ice core(black line), and calibrated by Nye model(red line)or D-J model(blue line); the corresponding thick lines represents 11 years running mean. (b)The variation of 11 year mean snowfall of D-J model; the red dashed straight line indicates mean snowfall during specific periods |
在南极冰盖海岸地区,年降雪量主要受到中高纬大气环流和局地气候环境的影响,由气旋风暴活动引起的降水事件影响尤为显著[35]。杨佼等[36]通过分析1979~2001年间该区域降雪极高年与极低年的大气环流场,发现位于南印度洋高纬地区的南印度洋低压带(SIOL)的强度和活动是控制Lambert流域降水的主要气候系统。由此可以推论,1863年之后,南印度洋高纬地区的气旋活动变化剧烈,在SIOL增强的年份,气压加深并向南扩张,影响范围扩大,海洋性气团的向极输送增强,LGB69地区降水增多;反之亦然。近年来,有研究指出海冰面积变化可能影响冰盖降水,主要机制是海冰面积减少有利于水汽蒸发和输送[33];同时,也有研究认为,向极输送大气活动的增强(同时海冰面积减小)起到了最重要的作用而不是海冰面积减小[32]。有关研究可能解释为何LGB69地区降雪量多变,但仍未在Lambert流域和Prydz湾开展。
3.2 误差分析为了进一步检验不同方法反演降雪量历史记录的误差,我们计算得到了Nye模型和D-J模型的校正序列与未校正序列的差及相对误差。如图 5所示,自冰盖表面至下部,由于冰盖运动造成的年层减薄越来越明显,最大误差可达20.0kg/ m2 a(Nye模型)和22.5kg/ m2 a(D-J模型),最大相对误差可达5.6 % (Nye模型)和6.3 % (D-J模型),模型修正差异明显。需要指出的是,由于算法的不同,两个模型之间的差异可达0.7 %。

|
图 5 (a)通过Nye模型和D-J模型对LGB69冰芯反演记录进行校正计算的校正差(暨校正值与原值之差);(b)通过Nye模型和D-J模型对LGB69冰芯反演记录进行校正计算的相对误差(暨校正差与原值之比) Fig. 5 The estimated discrepancy (a) and relative error (b) calculated by Nye correction and D-J correction at LGB69 |
结合火山沉积记录和可溶性离子季节循环,本文重建了LGB69钻取的102m冰芯的年降雪量/雪积累率历史记录,发现该冰芯最深处年龄为1708年。之后,通过Nye模型和D-J模型分别对该序列进行了校正,消除了由于侧向应力所造成了误差。与常规重建记录相比,该序列精度非常高,对于南极冰盖长期物质平衡估算具有重要参考意义。
与东南极冰盖其他冰芯记录相比,Lambert冰川流域降雪历史变化具有明显不同。Thomas等[37]重建了公元1000~2000年间南极降雪历史记录,发现南极地区降雪在1900~2000年间整体处于增加的趋势,特别是唐宁毛德地和南极半岛地区,其降雪量快速增加。在流域尺度上,同处Lambert冰川流域的LGB65冰芯记录显示1900年以来局地年降雪量缓慢增加[23],与LGB69地区的快速下降具有明显区别。与LGB69相似的只有维多利亚地的几支冰芯[37],究其原因,可能与LGB69及维多利亚地更多地受到附近海冰快速变化有关,详细机制还需要进一步分析。
东南极冰盖面积广袤,不同地区降雪量历史记录的恢复,对于评估南极与海平面的相互作用具有重要影响。本研究发现,在LGB69附近区域,冰盖运动造成的降雪量低估在102m深度可达5.6 % (Nye模型)和6.3 % (D-J模型),随着深度的增加,该误差还会继续增大。因此,在使用南北极冰芯特别是快速冰流区的冰芯反演历史降雪记录时,应考虑该误差造成的影响。
致谢: 感谢同行评审专家和编辑部老师提出的宝贵修改意见!感谢评审专家和编辑部老师提出的宝贵修改意见!本研究得到国家自然科学基金杰出青年基金项目“极地冰冻圈”(批准号:41425003)、国家海洋局南北极环境综合考察与评估专项项目(批准号:CHINARE2016-2020) 和中国气象科学研究院基本科研业务费项目(批准号:2017Z002) 共同资助。
| 1 |
Rignot E, Velicogna I, Broeke M R V D, et al. Acceleration of the contribution of the Greenland and Antarctic ice sheets to sea level rise. Geophysical Research Letters, 2011, 38(5): 132-140. |
| 2 |
Stocker T F, Qin D, Plattner G K, et al. eds. Climate Change 2013:The Physical Science Basis. Contribution of Working Group Ⅰ to the Fifth Assessment Report of the Intergovernmental Panel on Climate Change. Cambridge and New York: Cambridge University Press, 2013, 1535.
|
| 3 |
Polvani L M, Waugh D W, Correa G J P, et al. Stratospheric ozone depletion:The main driver of twentieth-century atmospheric circulation changes in the Southern Hemisphere. Journal of Climate, 2011, 24(3): 795-812. DOI:10.1175/2010JCLI3772.1 |
| 4 |
Krinner G, Magand O, Simmonds I, et al. Simulated Antarctic precipitation and surface mass balance at the end of the twentieth and twenty-first centuries. Climate Dynamics, 2007, 28(2-3): 215-230. |
| 5 |
Frieler K, Clark P U, He F, et al. Consistent evidence of increasing Antarctic accumulation with warming. Nature Climate Change, 2015, 5(4): 1-5. |
| 6 |
Shepherd A, Ivins E R. A Reconciled Estimate of Ice Sheet Mass Balance. In:AGU Fall Meeting. AGU Fall Meeting Abstracts, 2012
|
| 7 |
Boening C, Lebsock M, Landerer F, et al. Snowfall-driven mass change on the East Antarctic ice sheet. Geophysical Research Letters, 2012, 39(21): L21501. |
| 8 |
Lenaerts J T M, Meijgaard E V, Broeke M R V D, et al. Recent snowfall anomalies in Dronning Maud Land, East Antarctica, in a historical and future climate perspective. Geophysical Research Letters, 2013, 40(11): 2684-2688. DOI:10.1002/grl.50559 |
| 9 |
Monaghan A J, Bromwich D H, Fogt R L, et al. Insignificant change in Antarctic snowfall since the international geophysical year. Science, 2006, 313(5788): 827. DOI:10.1126/science.1128243 |
| 10 |
Broeke M V D, Berg W J V D, Meijgaard E V. Snowfall in coastal West Antarctica much greater than previously assumed. Geophysical Research Letters, 2006, 33(2): 356-360. |
| 11 |
Bromwich D H, Nicolas J P, Monaghan A J. An assessment of precipitation changes over Antarctica and the Southern Ocean since 1989 in contemporary global reanalyses. Journal of Climate, 2011, 24(16): 4189-4209. DOI:10.1175/2011JCLI4074.1 |
| 12 |
Lenaerts J T M, Broeke M R V D, Berg W J V D, et al. A new, high-resolution surface mass balance map of Antarctica(1979-2010) based on regional atmospheric climate modeling. Geophysical Research Letters, 2012, 39(4): 54-62. |
| 13 |
丁明虎, 效存德, 明镜, 等. 南极冰盖表面物质平衡实测技术综述. 极地研究, 2009, 21(4): 308-321. Ding Minghu, Xiao Cunde, Ming Jing, et al. The in-situ measurement techniques of surface mass balance in Antarctic ice sheet. Chinese Journal of Polar Research, 2009, 21(4): 308-321. |
| 14 |
Froum S, Orlowski W. Spatial and temporal variability of snow accumulation rate on the East, Antarctic ice divide between Dome Fuji and EPICA DML. The Cryosphere, 2011, 5(4): 1057-1081. DOI:10.5194/tc-5-1057-2011 |
| 15 |
Kingslake J, Hindmarsh R C A, Aðalgeirsdóttir G, et al. Full-depth englacial vertical ice sheet velocities measured using phase-sensitive radar. Journal of Geophysical Research:Earth Surface, 2015, 119(12): 2604-2618. |
| 16 |
Zhang T, Price S, Ju L, et al. A comparison of two Stokes ice sheet models applied to the Marine Ice Sheet Model Intercomparison Project for plan view models(MISMIP3d). The Cryosphere, 2017, 11(1): 1-21. DOI:10.5194/tc-11-1-2017 |
| 17 |
Wang Y, Ding M, Van Wessem J M, et al. A comparison of Antarctic Ice sheet surface mass balance from atmospheric climate models and in situ observations. Journal of Climate, 2016, 29(14): 5317-5337. DOI:10.1175/JCLI-D-15-0642.1 |
| 18 |
Karlöf L, Isaksson E, Winther J G, et al. Accumulation variability over a small area in east Dronning Maud Land, Antarctica, as determined from shallow firn cores and snow pits:Some implications for ice-core records. Journal of Glaciology, 2005, 51(174): 343-352. DOI:10.3189/172756505781829232 |
| 19 |
Kaczmarska M, Isaksson E, Karlöf L, et al. Accumulation variability derived from an ice core from coastal Dronning Maud Land, Antarctica. Annals of Glaciology, 2004, 39(7): 339-345. |
| 20 |
Frezzotti M, Scarchilli C, Becagli S, et al. A synthesis of the Antarctic surface mass balance during the last 800 yr. The Cryosphere, 2013, 7(1): 303-319. DOI:10.5194/tc-7-303-2013 |
| 21 |
赵华标, 徐柏青, 王宁练. 青藏高原冰芯氧同位素记录的温度代表性研究. 第四纪研究, 2014, 34(6): 1215-1226. Zhao Huabiao, Xu Baiqing, Wang Ninglian. Study on the water stable isotopes in Tibetan Plateau ice cores as a proxy of temperature. Quaternary Sciences, 2014, 34(6): 1215-1226. |
| 22 |
Ding M, Xiao C, Li Y, et al. Spatial variability of surface mass balance along a traverse route from Zhongshan station to Dome A, Antarctica. Journal of Glaciology, 2011, 57(204): 658-666. DOI:10.3189/002214311797409820 |
| 23 |
Ding Minghu, Zhang Tong, Xiao Cunde, et al. Snowdrift effect on snow deposition:Insights from a comparison of a snow pit profile and meteorological observations in east Antarctica. Science China:Earth Sciences, 2017, 60(4): 672-685. DOI:10.1007/s11430-016-0008-4 |
| 24 |
张明军, 效存德, 任贾文, 等. 南极冰芯定年综述. 自然杂志, 2004, 26(2): 63-68. Zhang Mingjun, Xiao Cunde, Ren Jiawen, et al. Progress in the studies of dating the ice cores from Antarctic ice sheets. Chinese Journal of Nature, 2004, 26(2): 63-68. |
| 25 |
Li R X, Xiao C D, Sneed S B, et al. A continuous 293-year record of volcanic events in an ice core from Lambert Glacier basin, East Antarctica. Antarctic Science, 2012, 24(3): 293-298. DOI:10.1017/S0954102011000897 |
| 26 |
Lliboutry L. A critical review of analytical approximate solutions for steady state velocities and temperature in cold ice sheets. Zeitschift fur Gletscherkunde und Glazialgeologie Bd, 1979, 15: 135-148. |
| 27 |
Dansgaard W, Johnsen S J. A flow model and a time scale for the ice core from Camp Century, Greenland. Journal of Glaciology, 1969, 8(53): 215-223. DOI:10.1017/S0022143000031208 |
| 28 |
Nye J F. Correction factor for accumulation measured by the thickness of the annual layers in an ice sheet. Journal of Glaciology, 1963, 4(36): 785-788. DOI:10.1017/S0022143000028367 |
| 29 |
Haefeli R. Contribution to the movement and the form of ice sheets in the arctic and Antarctic. Journal of Glaciology, 1961, 3(3): 1133-1151. |
| 30 |
Weertman J. Comparison between measured and theoretical temperature profiles of the Camp Century, Greenland, Borehole. Journal of Geophsical Research, 1968, 73(8): 2691-700. DOI:10.1029/JB073i008p02691 |
| 31 |
Arnaud Laurent, Barnola Jean M, Duval Paul. Physical modeling of the densification of snow/firn and ice in the upper part of polar ice sheets. In:Physics of Ice Core Records. Sapporo:Hokkaido University Press, 2000. 285~305
|
| 32 |
Fyke J, Lenaerts J, Wang H. Countervailing regional snowfall patterns dampen Antarctic surface mass variability. The Cryosphere Discuss, 2017, in review. https://doi.org/10.5194/tc-2017-102
|
| 33 |
Kopec B G, Feng X, Michel F A, et al. Influence of sea ice on Arctic precipitation. Proceedings of the National Academy of Sciences of the United States of America, 2015, 113(1): 46. |
| 34 |
杨佼. 利用高分辨率冰芯代用指标重建过去300年南半球环状模(SAM)序列. 北京: 中国科学院大学硕士论文, 2015. 86 Yang Jiao. Reconstruction of the Southern Annular Mode Index for the Past 300 Years by High Resolution Ice Core Proxies. Beijing:The Master's Thesis of University of Chinese Academy of Sciences, 2015. 86 |
| 35 |
Bromwich D H. Snowfall in high southern latitudes. Reviews of Geophysics, 1988, 26(1): 149-168. DOI:10.1029/RG026i001p00149 |
| 36 |
杨佼, 效存德, 丁明虎, 等. 东南极冰盖Princess Elizabeth地区LGB69冰芯化学记录反映的南印度洋过去300a大气环流变化. 冰川冻土, 2015, 37(2): 286-296. Yang Jiao, Xiao Cunde, Ding Minghu, et al. Atmospheric circulation variability over the southern Indian Ocean in the past 300 years inferred from aglaciochemical record in Princess Elizabeth Land, East Antarctica. Journal of Glaciology and Geocryology, 2015, 37(2): 286-296. |
| 37 |
Thomas E R, Wessem J M V, Roberts J et al. Review of regional Antarctic snow accumulation over the past 1000 years. Climate of the Past Discussion, 2017, in review. https://doi.org/10.5194/cp-2017-18
|
 , Xiao Wangxing①, Xiao Cunde②,③, Yang Jiao②, Zhang Dongqi①,②, Li Runxiang①, Zhang Tong①,②
② State Key Laboratory of Cryosphere Sciences, Northwest Institute of Eco-Environment and Resources, Chinese Academy of Sciences, Lanzhou 730000;
③ State Key Laboratory of Earth Surface Processes and Resource Ecology, Beijing Normal University, Beijing 100875)
Abstract
Based on a 102m ice core drilled at LGB69(70°50'06.6"S, 77°04'28.9"E; 1850m a.s.l.) of East Antarctica, by 18th Chinese National Antarctic Research Expedition, we reconstructed the snowfall/accumulation history during 1708~2001 by volcanic events and chemical layers method. The bottom of the ice core was dated into 1708±2A.D. Then, the Nye model and D-J model were applied to calibrate the annual mean snowfall to eliminate the ice stretch effect by ice flow. The results shows that the annual mean snowfall was 261. 7±69. 7kg/m2·a during 1708~2001, and can be divided into two main periods:one is before 1863 when the annual mean snowfall is 264.8±63.4kg/m2·a and the variation of snowfall is quite stable; then after 1863, the annual mean snowfall changes fast due to the rapid climate change of earth surface and sea ice change of adjacent ocean(Prydz Bay). This trend is different with most of areas of Antarctica, except Victoria Land. Besides that, we found that the ice sheet flow may lead to significant error on snowfall history reconstruction by deep ice core, LGB69 for example, the relative error could reach up to 6. 3% at 102m depth by D-J model esitimation.