② 中国极地研究中心, 上海 200136)
冰碛物是全球的一个主要粉尘源,联系着全球气候、大气气溶胶、海洋元素和生产力的变化。冰碛物、沙漠、黄土均是粉尘系统的重要端元。过去对粉尘,特别是沙漠、黄土的研究主要集中在中纬度地区,表明戈壁和沙漠干旱区是中国黄土的来源[1~5]。然而,包括冰川作用、山体剥蚀、山前冲洪积作用在内的高山过程[4, 6~9]也可以形成细粒的粉尘物质,进而堆积形成黄土。中纬度地区冰川发育较少,区域性强,较难评估冰川作用对细颗粒粉尘物质的作用。
高纬地区,例如北极地区,发育了大量的冰川,且现代冰川活动也很强烈,冰川作用范围在年际、十年、百年和千年时间尺度上变化特别大[10, 11]。北极地区受人类干扰极小,是研究冰川作用对粉尘物理化学性质影响的理想场所,但目前冰川作用和冰碛物的基本物理化学性质研究较少[6]。为此,本文对北极新奥尔松地区全新世冰碛物开展粒径、磁化率和化学成分研究,揭示了冰川作用、搬运作用和化学风化对冰碛物物理化学性质的影响。
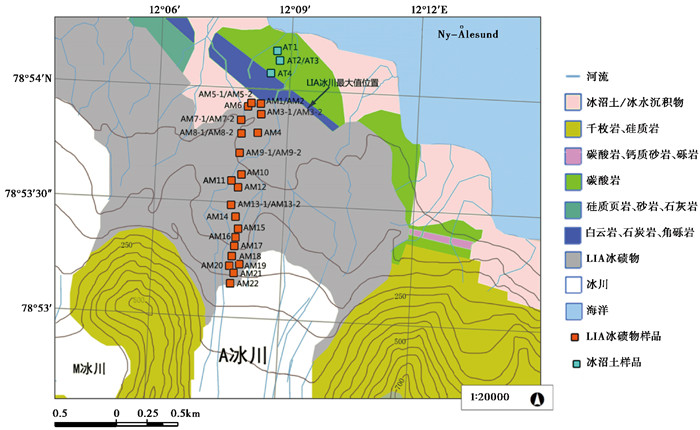
1 研究区域地理地质概况北极新奥尔松(Ny-Ålesund, Arctic)位于北极圈内的挪威斯瓦尔巴德群岛西部(图 1),北纬78°55′,东经11°56′。2004年我国在此建立了首个北极科学考察站—黄河站,为研究北极气候及冰川作用提供了可能和便利。这里纬度虽高,但受北大西洋暖流影响,气候相对北极其他地方温和,海洋性气候明显[12]。2月份最冷时平均气温-14℃,7月份最暖时平均气温5℃,年均降水200~300mm,年平均风速3.9m/s,全年东南风为主[13~15]。该地区发育数条典型的山谷冰川,其中Austre Lovénbreen冰川(简称A冰川)面积为5.69km2,冰川末端海拔约100m。过去的研究表明末次冰期时期斯瓦尔巴德群岛完全被冰盖覆盖,在距今20ka时冰盖面积达到极盛,随后开始缩小,并在距今约10ka左右海岸开始出现苔原地貌[10, 11]。进入全新世以后,冰川前缘大体处于后退状态,直到至今约4~5ka,气候变冷(北大西洋晚全新世冷期),冰川再次扩大,并在小冰期(Little Ice Age,简称LIA)结束前达到近几千年的最大值[11]。LIA结束后冰川不断后退并形成LIA冰碛带(图 1)[16, 17],形成自南向北:冰川→LIA冰碛物→冰沼土的地貌特征。研究区主要岩石类型为千枚岩、硅质岩等变质岩,伴有少量的砂岩、白云岩和碳酸岩[17](图 1)。
|
图 1 A冰川沉积区位置与采样点 Fig. 1 The sedimentary area of Austre Lovénbreen glacier and the sampling points |
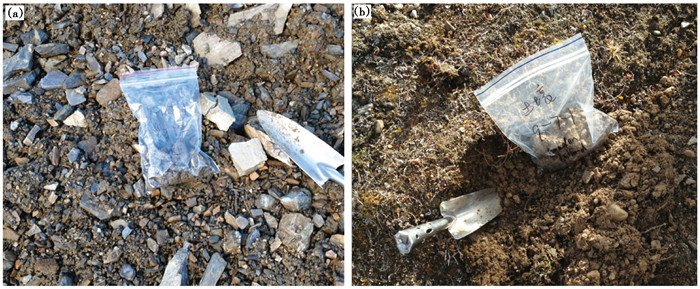
根据沉积位置[17](图 1),可将A冰川冰碛物分为沉积年龄小的LIA冰碛物和老的冰沼土(图 2)。已有研究表明该地区LIA结束时间较为一致,主要有公元1880年左右、1918年和约1900~1920年[16, 18],所以LIA冰碛物最老的沉积年龄约100年(标号AM,共28个),该部分样品大小混杂,砾石丰富,较少植被覆盖;A冰川和M冰川(图 1)前海岸阶地上的苔原植被类型已演化到极地苔原的成熟阶段[19],最老的阶地的沉积年龄约9ka[20],通过14C测定Austre Brøggerbreen、Vestre Brøggerbreen冰川(两条与A冰川位于同一半岛且平行临近的冰川)LIA冰碛区前缘一处苔原表面沉积年龄为8762年[21],因此冰沼土样品为早于北大西洋晚全新世冷期长达约数千年的样品(标号AT,共4个),该部分样品砾石相对较少,薄层苔藓覆盖,常见有植物碎屑,土壤厚度约20~30cm。A冰川冰碛物样品采样深度均为5cm,以聚乙烯塑料袋盛装,运回国内实验室进行分析测试。
|
图 2 LIA冰碛物(a)和冰沼土(b)野外照片 Fig. 2 Field photographs of LIA moraine (a) and tundra soil (b) |
为排除样品中大颗粒砾石对物化性质的干扰,所采集样品均匀取样后过8目筛,获取≤2mm组分,再进行粒径、磁化率和元素分析。
粒径分析:取样品0.2g加入锥形瓶,分别加入10 %的盐酸、双氧水充分反应去除碳酸盐和有机质,用二次水充分清洗后静置过夜。重复清洗3次后,加入5ml的0.5mol/L的六磷酸偏钠分散剂后超声处理,充分分散后上机测试。粒径分析在南京大学表生地球化学教育部重点实验室完成,所用仪器为Mastersizer 2000激光粒径仪。
磁化率分析:均匀选取每个样品约10g,置于75℃的烘箱中24小时,然后分别在低频(0.47kHz)和高频(4.7kHz)下测试磁化率,频率磁化率由(低频磁化率-高频磁化率)/低频磁化率得到。测试在南京大学表生地球化学教育部重点实验室完成,所用仪器为Bartington MS-2磁化率仪。
主量元素分析:均匀取样后,采用X射线荧光光谱法(XRF)分析。测试在南京大学现代分析中心测试完成,所用仪器为ARL9800-XP型X射线荧光光谱仪,分析误差<1 %。
矿物解析分析:对新鲜LIA冰碛物AM21进行矿物解析分析(MLA),分析小于125μm的矿物种类、元素和粒径分布。
3 结果 3.1 粒径组成基于沉积学上应用最广泛的温德华粒级分类[22]及福克和沃克值粒级[23]参数统计,得到了包括平均粒径(Mz)、标准偏差(δi)、偏度(Sk)和峰度(Kg)的粒径分布参数(表 1)。总体上,A冰川冰碛物的粒径组成以>63μm的砂级为主,平均值为53.96 %;2~63μm的粉砂级次之,平均值为42.36 %;<2μm的粘粒级含量最低,平均值为3.68 %。所有冰碛物平均粒径平均值为71.10μm。LIA冰碛物平均粒径平均值较冰沼土小,分别为69.98μm和78.96μm,变化范围分别为27.59~194.38μm和58.52~95.41μm。标准偏差(δi)表示沉积物的分选性[23],LIA冰碛物和冰沼土的标准偏差平均值分别为2.36和2.12,样品的分选均属差-很差,与大多数冰碛物标准偏差相似[24]。偏度(Sk)用于度量粒径分布的不对称性[23],一般认为河流相正偏,海滩相负偏,冰川相不固定[25]:LIA冰碛物Sk为-0.05~0.42之间,平均值为0.13;冰沼土Sk为0.15~0.26之间,平均值为0.22;大部分冰碛物为低正偏,粗组分稍多于细组分,且冰沼土较LIA冰碛物明显。峰度(Kg)是计算频率曲线尾部展开度和中部展开度比例关系的参数,指示沉积物粒径频率曲线宽窄尖锐的变化程度[23]:LIA冰碛物Kg为0.76~1.54之间,平均值为0.97;冰沼土Kg为0.81~1.24之间,平均值为0.98;两者在粒径频率曲线的峰的宽窄程度上总体相似,呈正态分布曲线,但也有个别样品窄峰尖锐,如AT1、AM3-1、AM3-2和AM6。
| 表 1 A冰川冰碛物粒径组成 Table 1 The grain size of the moraines of Austre Lovénbreen glacier |
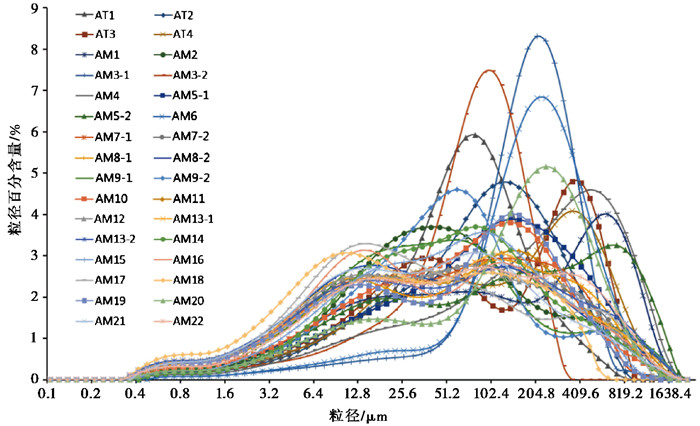
图 3给出A冰川冰碛物≤2mm组分粒径频率分布。呈双峰或多峰特征的LIA冰碛物和冰沼土分别有25个和2个(AT3和AT4),典型双峰峰值:LIA冰碛物为10~30μm和100~200μm;冰沼土为30~60μm和300~450μm。呈单峰特征的LIA冰碛物和冰沼土分别有3个(AM3-1、AM3-2和AM5-1) 和2个(AT1和AT2),峰值为60~400μm不等。
|
图 3 A冰川冰碛物≤2mm组分粒径频率分布图 Fig. 3 ≤2mm grain size frequency distribution of the moraines of Austre Lovénbreen glacier |
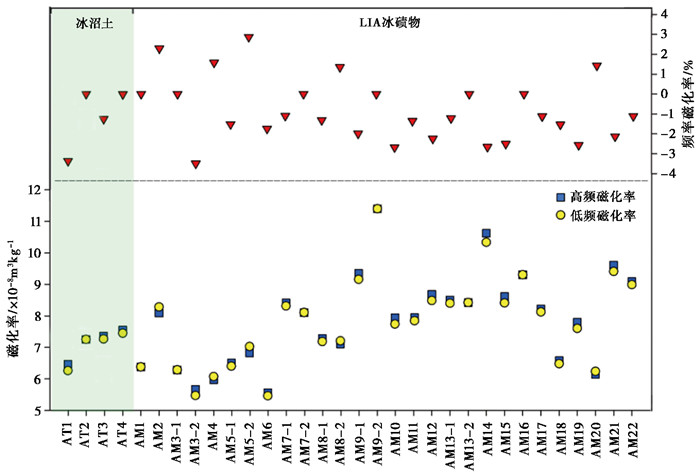
表 2和图 4给出A冰川32个冰碛物样品磁化率的测试结果。磁化率(如无特殊说明,是指低频磁化率)介于5.5×10⁻⁸~11.4×10⁻⁸ m3/kg,平均值为7.7×10-8 m3/kg,最低值和最高值分别出现在AM6和AM9-2样品。LIA冰碛物磁化率略高于冰沼土,它们的平均值分别为7.8×10-8 m3/kg和7.1×10-8 m3/kg。基于A冰川LIA冰碛物磁化率大小(图 4)和前人对上覆植被类型不同阶段和位置的划分研究[26],可将LIA冰碛物按距现今冰川末端远近分为两段:近岸LIA冰碛物AM1~AM8(后LIA早期)和冰川末端LIA冰碛物AM9~AM22(后LIA晚期)。近岸LIA冰碛物磁化率较低,平均值为6.9×10⁻⁸ m3/kg;冰川末端LIA冰碛物磁化率较高,平均值为8.5×10-8 m3/kg。所有冰碛物磁化率在高低频并无显著差异,频率磁化率变化也不大,平均值为-0.87 %。
| 表 2 A冰川冰碛物磁化率特征 Table 2 Magnetic susceptibility of the moraines of Austre Lovénbreen glacier |
|
图 4 A冰川冰碛物磁化率和频率磁化率 Fig. 4 Magnetic susceptibility and frequency magnetic susceptibility of the moraines of Austre Lovénbreen glacier |
表 3为A冰川冰碛物主量元素(以氧化物表示)含量平均值的变化以及与洛川黄土[27]、上部大陆地壳(Upper Continental Crust, 简称UCC)[28]元素组成和CIA值(由McLennan[29]方法校正)的对比:SiO2(60.20 % ~81.16 %)>Al2O3(7.57 % ~18.73 %)>Fe2O3(2.93 % ~8.35 %)>CaO(0.66 % ~5.37 %)>K2O(1.73 % ~4.72 %)>MgO(0.89 % ~3.68)>Na2O(1.53 % ~2.17 %)>TiO2(0.50 % ~1.12 %)>P2O5(0.09 % ~0.25 %)>MnO(0.04 % ~0.11 %)。与LIA冰碛物相比,冰沼土相对富Si,而贫Al、Fe、K、Ca、Mg等。表 4给出了A冰川冰碛物主量元素间的相关关系:Si与大部分元素呈负相关,Al与Fe、K、Mg显著正相关。
| 表 3 A冰川冰碛物主量元素组成特征 Table 3 The major elements of the moraines of Austre Lovénbreen glacier |
| 表 4 A冰川冰碛物主量元素相关矩阵 Table 4 Correlation matrix of major elements of the moraines of Austre Lovénbreen glacier |
新鲜冰碛物AM21中,矿物含量及其对主量元素的贡献度和粒径分布如表 5所示:含量大于1 %的矿物由高至低依次为石英、奥长石、黑云母、钠长石、正长石、方解石、白云石、白云母和绿泥石;Si元素主要由石英、奥长石贡献,主要粒径分布在粗粉砂-砂级;Al和Fe元素主要由黑云母、白云母和绿泥石贡献,主要粒径分布在细粉砂-中粗粉砂级。
| 表 5 新鲜冰碛物AM21矿物解析分析结果 Table 5 Result of mineral liberation analysis of fresh moraine AM21 of Austre Lovénbreen |
不同来源的沉积物具有不同的粒径频率分布曲线[30~32],冰川机械压磨分选作用会使冰碛物粒径频率曲线由砾峰过渡为平缓的波形曲线再到砂、粉砂级峰值出现[33]。Boulton[34]认为冰川压碎的颗粒一般>0.5mm,磨碎的颗粒一般<0.5mm。由图 3得知,A冰川压碎和磨碎的颗粒大致以1mm为界,表明其压磨作用相对较弱,与冰川体量较小和流速较慢有关。冰沼土粒径双峰峰值均较LIA冰碛物大,且粒径单峰的冰碛物均出现在近岸LIA冰碛物和冰沼土中。近岸LIA冰碛物和冰沼土相对冰川末端LIA冰碛物具有较粗的平均粒径和较高的正偏度(表 1和图 3),表明冰碛物沉积之后受搬运作用影响损失了细组分。
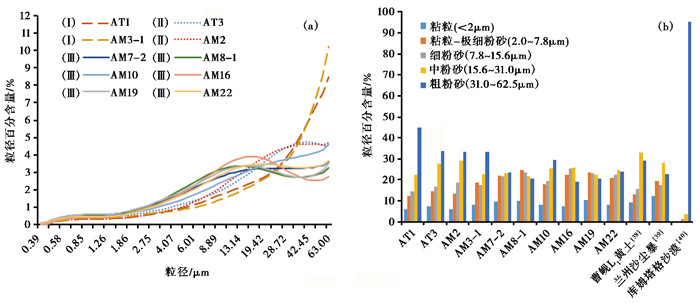
冰碛物≤2mm组分特别容易受流水和风力搬运影响,其中>63μm组分风力搬运距离较近,大部分只在冰缘附近迁移;≤63μm组分风力搬运距离较远[35, 36]。粉尘<20μm组分可进行长时间的悬浮和远距离传输,<10μm组分甚至可全球传输[37]。图 5a中,除AM3-1≤63μm组分占≤2mm组分百分含量仅为11.47 %、搬运作用明显较强外,其他样品相应占比为40 % ~50 %,具有良好代表性。依受搬运作用由强至弱可分为三类:Ⅰ为以AM3-1和AT1为代表的近岸LIA冰碛物和冰沼土(≤2mm组分粒径频率分布为单峰),粗组分远多于细组分;Ⅱ为以AM2和AT3为代表的近岸LIA冰碛物和冰沼土(≤2mm组分粒径频率分布为双峰),其峰值在45μm左右,细组分相对丢失;Ⅲ为以AM22为代表的新鲜LIA冰碛物,其峰值在15μm左右,>10μm组分粒径频率曲线基本水平。Ⅰ类和Ⅱ类均为近岸LIA冰碛物和冰沼土,表明冰碛物受搬运作用强度与其沉积年龄有关。图 5b中,由AM22至AT1,≤63μm组分细粉砂和粘粒-极细粉砂百分含量逐渐减少、粗粉砂百分含量相对增多,表明冰碛物沉积之后接受了明显的搬运作用,特别是<30μm组分。
|
图 5 A冰川典型冰碛物≤63μm组分粒径频率分布(a)、粒径组成分布及其与常见风成沉积物[38~40]对比(b) Fig. 5 ≤63μm grain size frequency distribution of typical moraines of Austre Lovénbreen glacier(a) and the comparison of their grain size composition with common eolian sediments[38~40](b) |
冰川作用产生的粉尘是风成沉积物的一个主要来源已被广泛认可[6, 35]。特别是高寒的冰川外缘地带,由冰川研磨产生的大量细颗粒物质经风力搬运后形成的现代黄土已得到较多报道[5, 6, 41]。图 5b和表 6给出A冰川冰碛物与常见风成沉积物粒径对比,包括中国黄土高原临近沙漠的曹岘L1黄土[38]、现代兰州沙尘暴[39]和库姆塔格沙漠[40]。A冰川冰碛物与其主要区别是:1) 平均粒径和偏度在沙漠与黄土之间;2) 标准偏差最大,分选性最差;3) 峰度与沙漠相近,比黄土小,粒径分布更宽泛。冰川搬运过程中,碎屑颗粒之间以及碎屑颗粒与冰之间摩擦机会较少,碎屑颗粒不因大小、形状、比重等以及冰体流速的影响而出现分异,新鲜冰碛物在粘粒至粗粉砂(2~63μm)中具较平均分布,以粗粉砂以上(>31μm)占绝大多数[42~44]的典型沙漠沉积和以粘粒-极细粉砂至中粉砂(2~31μm)为主[1, 45, 46]的典型黄土沉积均可由流水冲洪积和风力长时间对冰碛物进行搬运和分选形成。
| 表 6 A冰川冰碛物与常见风成沉积物粒径对比 Table 6 Comparison of grain size parameters between the moraines of Austre Lovénbreen glacier and common eolian sediments |
一般而言,沉积物的磁化率与频率磁化率能有效指示其成壤强度[47~52]。本文研究区不同基岩磁化率差异不大[53](表 7),A冰川冰碛物和当地基岩磁化率在量级上接近,为探究不同时期冰碛物磁化率变化提供了良好条件。表 2和图 4可见,由AM22至AT1,A冰川冰碛物磁化率无递变性,且LIA冰碛物和冰沼土无论是磁化率还是频率磁化率大体相当,说明冰缘环境下冰碛物成壤作用很弱,磁化率主要受母岩影响。这与大范围的青藏高原山地古冰碛物磁化率研究结果一致[54]。
| 表 7 A冰川冰碛物与常见岩石[53]磁化率值 Table 7 Average magnetic susceptibility of common rocks[53] and the moraines of Austre Lovénbreen glacier |
鉴于冰沼土样品过少,本文仅讨论A冰川LIA冰碛物磁化率与粒径组成关系。图 6所示,近岸、冰川末端LIA冰碛物磁化率均与总铁含量(TFe,用Fe2O3含量代替,见表 3)呈正相关,R2分别为0.69和0.60,表明铁磁性矿物含量决定了磁化率变化。LIA冰碛物磁化率与砂级百分含量呈负相关,与粉砂级百分含量呈正相关,与粘粒级百分含量不相关,R2分别为0.42、0.46和0.04。近岸LIA冰碛物磁化率与粉砂级、粘粒级百分含量呈正相关,R2分别为0.62和0.55,与平均粒径、砂级百分含量呈负相关,R2分别为0.47和0.62,同时其TFe与平均粒径呈负相关,R2为0.52,表明沉积年龄较大的冰碛物磁化率对粒径敏感,并随着粒径增大而减小,这与现代表层土和黄土沉积的研究结果相一致。冰川末端LIA冰碛物磁化率与平均粒径和各粒径组分相关性弱或几乎不相关,R2均≤0.24,表明沉积年龄较小的冰碛物磁化率对粒径不敏感,铁磁性矿物在各粒径组分中分布较均匀。可推断搬运过程中铁磁性矿物因比重较大在细组分中相对富集,而细组分相对减少则是近岸LIA冰碛物磁化率低于冰川末端LIA冰碛物(参见3.2节)的原因。

|
图 6 A冰川LIA冰碛物磁化率与TFe、平均粒径、各粒径组分含量散点图 Fig. 6 Diagram showing the relation between magnetic susceptibility of LIA moraines of Austre Lovénbreen glacier and total iron content, average grain size and grain size distribution |
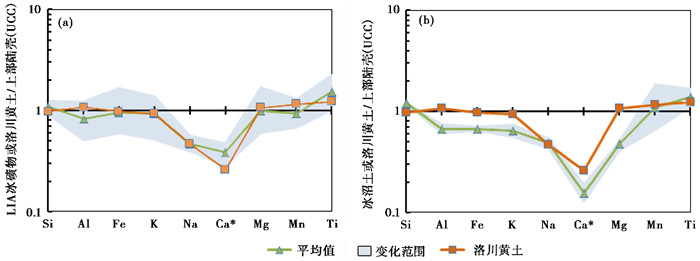
A冰川LIA冰碛物、冰沼土主量元素组成与洛川黄土[27]、UCC[28]对比表明(表 3和图 7),LIA冰碛物与洛川黄土主量元素组成几乎一致,与UCC也十分相似,Si、Al、Fe、K、Mg、Mn等元素平均含量几乎与UCC相同,说明冰碛物与黄土物质[27]存在联系,且基本能代表上部陆壳平均化学组成[55];冰沼土比洛川黄土富Si,其主量元素组成与洛川黄土和UCC之间的整体性差异是受到Si稀释作用影响。土壤风化通常伴随着Ca、Na、Mg等淋失与Al、Fe残积[56, 57],但冰沼土与LIA冰碛物相比,相对富Si,而贫Al、Fe、K、Ca、Mg;这是由于冰碛物中贡献Al、Fe的主要矿物黑云母、白云母和绿泥石主要分布在13~45μm粉砂粒级(表 5),搬运作用导致冰沼土粉砂级含量较LIA冰碛物少,冰沼土因富Al、Fe、K、Ca、Mg等细组分迁出而相对富Si。值得注意的是,A冰川所有冰碛物和洛川黄土的Na、Ca含量与UCC相比均存在明显亏损,表明这些沉积物可能受到大陆化学风化的影响[27]。
|
图 7 A冰川LIA冰碛物(a)、冰沼土(b)与洛川黄土[27]中主量元素的UCC标准化分配图 Fig. 7 UCC-normalized patterns of major elements in Luochuan loess and the moraines of Austre Lovénbreen glacier |
化学风化强度常用于评估沉积物受气候影响和改造的程度,广泛应用于古气候重建中[58~61]。沉积物遭受的化学风化强度可以通过主量元素之间的变化关系评估,常用的化学蚀变指标CIA(Chemical Index of Alteration)[62],表达式为:CIA={nAl2O3/(nAl2O3+nNa2O+nK2O+nCaO*)}×100,方程中各成分为摩尔分数,其中CaO*是指硅酸盐中的Ca,通过McLennan[29]的方法校正所有的CaO*。
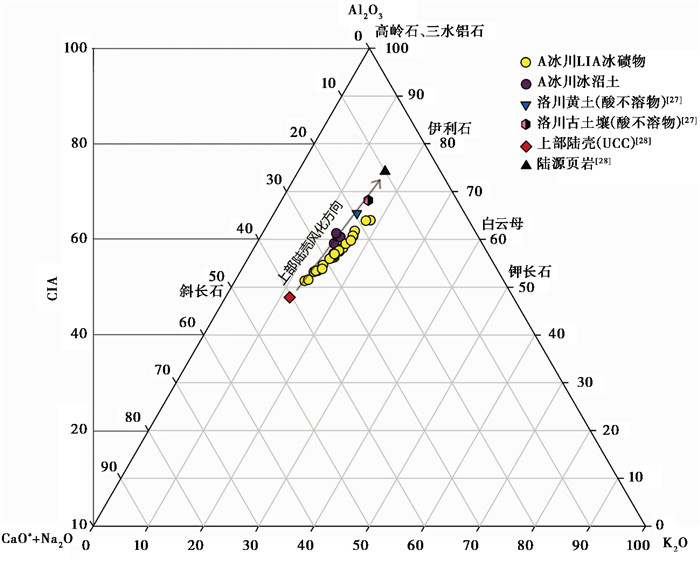
图 8利用CIA值[62]和大陆化学风化趋势预测模型A-CN-K三角图[63]对比了A冰川冰碛物、典型黄土、UCC和陆源页岩(典型UCC风化产物)的化学风化强度。一般认为,CIA越大表示经受的化学风化越强,CIA在45~55之间表示基本不存在化学风化作用[29]。A冰川冰碛物CIA平均值为58.57,反映冰缘环境较弱的化学风化条件。LIA冰碛物和冰沼土CIA值变化范围分别为51.28~64.21和59.15~61.24,平均值分别为57.05和60.37。冰沼土CIA值较LIA冰碛物大且相对集中,是经历了搬运和一定的化学风化作用的结果。A冰川冰碛物集中分布在UCC至黄土平均化学组成风化趋势线上,表明其尚处于大陆风化早期阶段,也证明了黄土起源于由一系列的高山作用产生的沉积物的可能性。
|
图 8 A冰川冰碛物和其他沉积物A-CN-K三角图 Fig. 8 A-CN-K diagram with the moraines of Austre Lovénbreen glacier and other sediments |
鉴于冰沼土样品过少,本文仅讨论A冰川LIA冰碛物CIA值与粒径组成关系。图 9表明A冰川LIA冰碛物CIA值与砂级百分含量呈负相关,与粉砂级百分含量呈正相关,与粘粒级百分含量不相关,R2分别为0.38、0.44和0.01。砂级和粉砂级百分含量对CIA值的贡献在冰川末端LIA冰碛物中并无明显差异,但在近岸LIA冰碛物中粉砂级的贡献则大得多,说明两个粒级在矿物类型和含量上存在差异,粉砂级更加富Al。近岸LIA冰碛物较冰川末端LIA冰碛物经历化学风化时间稍长,但因其细组分较少,CIA平均值依然较小(分别为55.42和58.28)。

|
图 9 A冰川LIA冰碛物CIA值与各粒径组分含量散点图 Fig. 9 Diagram showing the relation between CIA of LIA moraines of Austre Lovénbreen glacier and their grain size distribution |
因此,在冰缘弱化学风化环境下,因沉积年龄不同,A冰川LIA冰碛物和冰沼土CIA值确能反映一定的化学风化差异;但对沉积年龄小的LIA冰碛物而言,搬运作用引起的粒度组成差异和相应的不同矿物类型和含量的改变或是CIA值变化的主要原因。使用CIA值重建化学风化强度时,应充分考虑沉积之后搬运作用的影响。
5 结论为了解现代高纬度冰缘环境下冰川作用、搬运作用和化学风化对冰碛物的物理化学性质的影响,以北极新奥尔松A冰川深度小于5cm的冰碛物(包括LIA冰碛物和冰沼土)≤2mm组分为对象,测定了LIA冰碛物和冰沼土的粒径、磁化率和元素组成。结果如下:
(1) A冰川冰碛物平均粒径平均值为71.10μm,粒径组成以砂级为主,粉砂级次之,粘粒级最少。A冰川冰碛物≤2mm组分粒径频率分布大部分呈双峰或多峰特征,典型双峰峰值:LIA冰碛物为10~30μm和100~200μm;冰沼土为30~60μm和300~450μm。A冰川压碎和磨碎的颗粒大致以1mm为界,表明其压磨作用相对较弱。近岸LIA冰碛物和冰沼土相对冰川末端LIA冰碛物具有较粗的平均粒径和较高的正偏度,表明冰碛物沉积之后受搬运作用影响损失了细组分。由AM22至AT1,≤63μm组分细粉砂和粘粒-极细粉砂百分含量逐渐减少、粗粉砂百分含量相对增多。A冰川冰碛物依受搬运作用强弱可分为三类,其中新鲜冰碛物在粘粒至粗粉砂中具较平均分布,典型沙漠沉积和黄土沉积均可由流水冲洪积和风力长时间对冰碛物进行搬运和分选形成。
(2) A冰川冰碛物磁化率介于5.5×10⁻⁸~11.4×10⁻⁸m3/kg,平均值为7.7×10-8m3/kg;在高低频并无显著差异,频率磁化率变化也不大,平均值为-0.87 %。LIA冰碛物和冰沼土无论磁化率还是频率磁化率大体相当,说明冰缘环境下冰碛物成壤作用很弱,磁化率主要受母岩影响。LIA冰碛物磁化率与总铁含量呈正相关,表明铁磁性矿物含量决定了磁化率变化;与砂级百分含量呈负相关,与粉砂级百分含量呈正相关,与粘粒级百分含量不相关。近岸LIA冰碛物磁化率对粒径敏感,而冰川末端LIA冰碛物磁化率则对粒径并不敏感。推断搬运过程中铁磁性矿物因比重较大在细组分中相对富集,而细组分相对减少导致近岸LIA冰碛物磁化率低于冰川末端LIA冰碛物。
(3) 与LIA冰碛物相比,A冰川冰沼土相对富Si,而贫Al、Fe、K、Ca、Mg等。A冰川冰碛物Si与大部分元素呈负相关,Al与Fe、K、Mg显著正相关。LIA冰碛物主量元素组成与洛川黄土、UCC几乎相同,说明冰碛物与黄土物质存在联系,且基本能代表上部陆壳平均化学组成。A冰川冰碛物CIA平均值为58.57,反映冰缘环境较弱的化学风化条件。在A-CN-K三角图中,A冰川冰碛物集中分布在UCC至黄土平均化学组成风化趋势线上,表明其尚处于大陆风化早期阶段,也证明了黄土起源于由一系列的高山作用产生的沉积物的可能性。因沉积年龄不同,A冰川LIA冰碛物和冰沼土CIA值确能反映一定的化学风化差异;但对沉积年龄小的LIA冰碛物而言,搬运作用引起的粒度组成差异和相应的不同矿物类型和含量的改变或是CIA值变化的主要原因。
致谢 感谢北极黄河站考察队员协助野外工作以及审稿专家和编辑部老师提出的宝贵修改意见。
| 1 |
刘东生. 中国的黄土堆积. 北京: 科学出版社, 1965, 1-244. Liu Tungsheng. The Loess Deposits in China. Beijing: Science Press, 1965, 1-244. |
| 2 |
杨景春. 中国地貌特征与演化. 北京: 海洋出版社, 1993, 51-274. Yang Jingchun. Chinese Landform and Its Evolution. Beijing: China Ocean Press, 1993, 51-274. |
| 3 |
Sun Jimin, Zhang Mingying, Liu Tungsheng. Spatial and temporal characteristics of dust storms in China and its surrounding regions, 1960-1999:Relations to source area and climate. Journal of Geophysical Research, 2001, 106(D10): 10325-10334. DOI:10.1029/2000JD900665 |
| 4 |
Sun Jimin. Provenance of loess material and formation of loess deposits on the Chinese Loess Plateau. Earth and Planetary Science Letters, 2002, 203(3-4): 845-859. DOI:10.1016/S0012-821X(02)00921-4 |
| 5 |
孙继敏. 中国黄土的物质来源及其粉尘的产生机制与搬运过程. 第四纪研究, 2004, 24(2): 175-183. Sun Jimin. Provenance, forming mechanism and transport of loess in China. Quaternary Sciences, 2004, 24(2): 175-183. |
| 6 |
Muhs D R, Budahn J R, Mcgeehin J P et al. Loess origin, transport, and deposition over the past 10, 000 years, Wrangell-St. Elias National Park. Alaska. Aeolian Research, 2013, 11: 85-99. DOI:10.1016/j.aeolia.2013.06.001 |
| 7 |
Pye K. The nature, origin and accumulation of loess. Quaternary Science Reviews, 1995, 14(7-8): 653-667. DOI:10.1016/0277-3791(95)00047-X |
| 8 |
Smalley I J. New Zealand loess and major categories of loess classification. Search, 1978, 9(7): 281-282. |
| 9 |
Smalley I J. John Hardcastle on glacier motion and glacial loess. Journal of Glaciology, 1983, 29(103): 480-484. DOI:10.1017/S0022143000030379 |
| 10 |
Landvik J Y, Bondevik S, Elverhøi A et al. The Last Glacial Maximum of Svalbard and the Barents Sea area:Ice sheet extent and configuration. Quaternary Science Reviews, 1998, 17(1): 43-75. |
| 11 |
Svendsen J I, Elverhoi A, Mangerud J. The retreat of the Barents Sea Ice Sheet on the western Svalbard margin. Boreas, 1996, 25(4): 244-256. |
| 12 |
Jiang Hui, Ren Jian, Knudsen K L et al. Summer sea-surface temperatures and climate events on the North Icelandic shelf through the last 3000 years. Chinese Science Bulletin, 2007, 52(6): 789-796. DOI:10.1007/s11434-007-0108-1 |
| 13 |
Førland E J, Benestad R, Hanssen-Bauer I et al. Temperature and precipitation development at Svalbard 1900-2100. Advances in Meteorology, 2011, 17(2011): 13-30. |
| 14 |
Hisdal V. Svalbard:Nature and History. Oslo:Polarhåndbok, 1998, 20-22. |
| 15 |
Yuan L, Sun L, Wei G et al. 9, 400 yr B.P.:The mortality of mollusk shell(Mya truncata) at high Arctic is associated with a sudden cooling event. Environmental Earth Sciences, 2011, 63(6): 1385-1393. DOI:10.1007/s12665-010-0808-8 |
| 16 |
Lefauconnier B. Fluctuations récentes des glaciers dans le Kongsfjord, 79°N Spitsberg.(Recent fluctuations of glacier fronts in Kongsfjorden, 79°N Spitsbergen.). Inter-Nord, 1990, 19: 449-453. |
| 17 |
Norwegain Polar Institute. Norsk Polarinstitutt WebGIS.http://svalbardkartet.npolar.no/en/
|
| 18 |
Moreau M, Mercier D, Laffly D et al. Impacts of recent paraglacial dynamics on plant colonization:A case study on Midtre Lovénbreen foreland, Spitsbergen(79°N). Geomorphology, 2008, 95(1-2): 48-60. DOI:10.1016/j.geomorph.2006.07.031 |
| 19 |
Elvebakk A. Tundra diversity and ecological characteristics of Svalbard. In:Wielgolaski F E ed. Ecosystems of the World. Vol. 3. Polar and Alpine Tundra. Amsterdam:Elsevier, 1997, 347-359. |
| 20 |
Corbel J. Datation au carbone 14 des terrasses marines de la Baie du Roi. In:Centre National de la Recherche Scientifique(France), Spitsberg 1964 et Premières Observations 1965. Lyon:Audin Éditions, 1966, 309-314. |
| 21 |
Singh V, Farooqui A, Mehrotra N C et al. Late Pleistocene and Early Holocene climate of Ny-Ålesund, Svalbard(Norway):A study based on biological proxies. Journal of the Geological Society of India, 2011, 78(2): 109-116. DOI:10.1007/s12594-011-0079-3 |
| 22 |
Wentworth C K. A scale of grade and class terms for clastic sediments. Journal of Geology, 1922, 30(5): 377-392. DOI:10.1086/622910 |
| 23 |
Folk R L, Ward W C. Brazos River bar:A study in the significance of grain size parameters. Journal of Sedimentary Petrology, 1957, 27(1): 3-26. DOI:10.1306/74D70646-2B21-11D7-8648000102C1865D |
| 24 |
Dahanayake K, Dasanayake D M S N. Glacial sediments from Weuda, Sri Lanka. Sedimentary Geology, 1981, 30(1-2): 1-14. DOI:10.1016/0037-0738(81)90011-7 |
| 25 |
李全莲, 张成龙, 武小波等. 中国西部冰川冰尘的粒度及矿物组成. 山地学报, 2015, 33(2): 166-172. Li Quanlian, Zhang Chenglong, Wu Xiaobo et al. Grain size distribution and mineral components of cryoconites of glaciers in Western China. Mountain Research, 2015, 33(2): 166-172. |
| 26 |
Moreau M, Laffly D, Brossard T. Recent spatial development of Svalbard strandflat vegetation over a period of 31 years. Polar Research, 2009, 28(3): 364-375. DOI:10.1111/j.1751-8369.2009.00119.x |
| 27 |
陈骏, 安芷生, 刘连文等. 最近2.5Ma以来黄土高原粉尘化学组成的变化与亚洲内陆的化学风化. 中国科学(D辑:地球科学), 2001, 31(2): 136-145. Chen Jun, An Zhisheng, Liu Lianwen et al. Variations in chemical compositions of eolian dust in Chinese Loess Plateau over the past 2.5Ma and chemical weathering in the Asian inland. Science in China, 2001, 31(2): 136-145. |
| 28 |
Taylor S R, Mclennan S M. The Continental Crust:Its Composition and Evolution. London:Blackwell, 1985, 1-312. |
| 29 |
McLennan S M. Weathering and global denudation. Journal of Geology, 1993, 101(2): 295-303. DOI:10.1086/648222 |
| 30 |
涂路遥, 周鑫, 刘毅等. 近海泥质沉积物敏感粒径作为冬季风强度指标的再研究:与器测数据的对比. 第四纪研究, 2015, 35(6): 1393-1400. Tu Luyao, Zhou xin, Liu yi et al. Re-analysis of sensitive grain size of coastal muddy sediments as proxy of winter monsoon strength:Comparison with instrumental data. Quaternary Sciences, 2015, 35(6): 1393-1400. |
| 31 |
刘世昊, 丰爱平, 李培英等. 现代黄河三角洲地区晚更新世以来高分辨率沉积粒度特征及动力沉积环境演化. 第四纪研究, 2015, 35(2): 291-306. Liu Shihao, Feng Aiping, Li Peiying et al. High-resolution grain size distribution and evolution of the sediment-dynamic environment in the modern Yellow River delta since the latest Pleistocene. Quaternary Sciences, 2015, 35(2): 291-306. DOI:10.11928/j.issn.1001-7410.2015.02.05 |
| 32 |
李超, 杨石岭, 李阳阳等. 河南卢氏盆地张家村组粒度特征与沉积环境研究. 第四纪研究, 2016, 36(6): 1428-1435. Li Chao, Yang Shiling, Li Yangyang et al. Grain size characteristics and sedimentary environment of the Zhangjiacun Formation in the Lushi basin, Henan Province. Quaternary Sciences, 2016, 36(6): 1428-1435. |
| 33 |
康建成. 贡嘎山贡巴冰川岩屑的粒度特征及意义. 冰川冻土, 1987, 9(1): 172-176. Kang Jiancheng. Grain-size characteristics of glacial debris, and explanation of the processes of glacial transports and sediments at the Gongba Glaciers in Mt. Gongga.. Journal of Glaciology and Geocryology, 1987, 9(1): 172-176. |
| 34 |
Boulton G S. Boulder shapes and grain-size distributions of debris as indicators of transport paths through a glacier and till genesis. Sedimentology, 1978, 25(6): 773-799. DOI:10.1111/sed.1978.25.issue-6 |
| 35 |
Selby M J, Rains R B, Palmer R. Eolian deposits of the ice-free Victoria Valley, Southern Victoria Land, Antarctica. New Zealand Journal of Geology and Geophysics, 1974, 17(3): 543-562. DOI:10.1080/00288306.1973.10421580 |
| 36 |
Zhang W, Wang T, Qu J et al. Developmental characteristics of aeolian dunes and environmental changes in the adjoining region of Puruogangri ice sheet, North Tibetan Plateau. Environmental Geology, 2005, 48(1): 15-24. DOI:10.1007/s00254-005-1242-1 |
| 37 |
Tsoar H, Pye K. Dust transport and the question of desert loess formation. Sedimentology, 1987, 34(1): 139-153. DOI:10.1111/sed.1987.34.issue-1 |
| 38 |
Liang L, Sun Y, Beets C J et al. Impacts of grain size sorting and chemical weathering on the geochemistry of Jingyuan loess in the northwestern Chinese Loess Plateau. Journal of Asian Earth Sciences, 2013, 69: 177-184. DOI:10.1016/j.jseaes.2012.12.015 |
| 39 |
戴雪荣, 师育新, 薛滨. 兰州现代特大尘暴沉积物粒度特征及其意义. 兰州大学学报, 1995(4): 168-174. Dai Xuerong, Shi Yuxin, Xue Bin. Granulometric characteristics and significance of the deposits from a recent extraordinary heavy duststorm in Lanzhou, Gansu, Northwest China. Journal of Lanzhou University, 1995(4): 168-174. |
| 40 |
何清, 杨兴华, 霍文等. 库姆塔格沙漠粒度分布特征及环境意义. 中国沙漠, 2009, 29(1): 18-22. He Qing, Yang Xinghua, Huo Wen et al. Characteristics of sand granularity from Kumtag Desert and its environmental significance. Journal of Desert Research, 2009, 29(1): 18-22. |
| 41 |
Eden D. Dust accumulation in the New Zealand region since the Last Glacial Maximum. Quaternary Science Reviews, 2003, 22(18-19): 2037-2052. DOI:10.1016/S0277-3791(03)00168-9 |
| 42 |
熊尚发, 丁仲礼, 刘东生. 赣北红土与北京邻区黄土及沙漠砂的粒度特征对比. 科学通报, 1999, 44(11): 1216-1219. Xiong Shangfa, Ding Zhongli, Liu Tungsheng. The comparison of particle characteristics among laterite in Northern Jiangxi Province, loess near Beijing and sand of desert. Chinese Science Bulletin, 1999, 44(11): 1216-1219. DOI:10.3321/j.issn:0023-074X.1999.11.022 |
| 43 |
殷志强, 秦小光, 吴金水等. 中国北方部分地区黄土、沙漠沙、湖泊、河流细粒沉积物粒度多组分分布特征研究. 沉积学报, 2009, 27(2): 343-351. Yin Zhiqiang, Qin Xiaoguang, Wu Jinshui et al. The multimodal grain-size distribution characteristics of loess, desert, lake and river sediments in some areas of Northern China. Acta Sedimentologica Sinca, 2009, 27(2): 343-351. |
| 44 |
霍文, 何清, 杨兴华等. 中国北方主要沙漠沙尘粒度特征比较研究. 水土保持研究, 2011, 18(6): 6-11. Huo Wen, He Qing, Yang Xinghua et al. The research on grain size characteristic of desert in north of China. Research of Soil and Water Conservation, 2011, 18(6): 6-11. |
| 45 |
刘东生, 张宗祜. 中国的黄土. 地质学报, 1962, 42(1): 1-14. Liu Tungsheng, Zhang Zonghu. The Loess in China. Acta Geologica Sinica, 1962, 42(1): 1-14. |
| 46 |
刘东生等. 黄土与环境. 北京: 科学出版社, 1985, 191-207. Liu Tungsheng et al. Loess and Environment. Beijing: Science Press, 1985, 191-207. |
| 47 |
Maher B A, Alekseev A, Alekseeva T. Magnetic mineralogy of soils across the Russian Steppe:Climatic dependence of pedogenic magnetite formation. Palaeogeography, Palaeoclimatology, Palaeoecology, 2003, 201(3): 321-341. |
| 48 |
Maher B A, Thompson R. Palaeorainfall reconstructions from pedogenic magnetic susceptibility variations in the Chinese loess and palaeosols. Quaternary Research, 1995, 44(3): 383-391. DOI:10.1006/qres.1995.1083 |
| 49 |
Maher B A, Thompson R. Mineral magnetic record of the Chinese loess and palaeosols. Geology, 1991, 19(1): 3-6. DOI:10.1130/0091-7613(1991)019<0003:MMROTC>2.3.CO;2 |
| 50 |
Maher B A. Magnetic properties of modern soils and Quaternary loessic paleosols:Paleoclimatic implications. Palaeogeography, Palaeoclimatology, Palaeoecology, 1998, 137(1): 25-54. |
| 51 |
侯顺民, 刘秀铭, 吕镔等. 土耳其Nallihan黄土-古土壤岩石磁学特征及其环境意义. 第四纪研究, 2015, 35(4): 1006-1019. Hou Shunmin, Liu Xiuming, Lü Bin et al. Rock magnetic properties of loess in Nallihan, Turkey and its enviromental significances. Quaternary Sciences, 2015, 35(4): 1006-1019. |
| 52 |
吕镔, 刘秀铭, 王涛等. 花岗岩上发育的亚热带红土岩石磁学特征. 第四纪研究, 2014, 34(3): 504-515. Lü Bin, Liu Xiuming, Wang Tao et al. Rock magnetic properties of subtropical red soils developed on granite. Quaternary Sciences, 2014, 34(3): 504-515. |
| 53 |
Dearing J. Environmental Magnetic Susceptibility Using the Bartington MS2 System. Kenilworth:Chi Publishing, 1994, 40-54. |
| 54 |
张威, 李媛媛, 冯骥等. 青藏高原东缘山地古冰川沉积物磁化率特点及其影响因素分析. 地理科学进展, 2012, 31(11): 1415-1425. Zhang Wei, Li Yuanyuan, Feng Ji et al. Magnetic susceptibility of glacial deposits and the impacting factors in the eastern bordering mountains of the Tibetan Plateau. Progress in Geography, 2012, 31(11): 1415-1425. DOI:10.11820/dlkxjz.2012.11.001 |
| 55 |
Crichton J G, Condie K C. Trace elements as source indicators in cratonic sediments:A case study from the Early Proterozoic Libby Creek Group, southeastern Wyoming. The Journal of Geology, 1993, 101(3): 319-332. DOI:10.1086/648226 |
| 56 |
熊顺贵. 基础土壤学. 北京: 中国农业大学出版社, 2001, 253-269. Xiong Shungui. Foundation of Pedology. Beijing: China Agricultural University Press, 2001, 253-269. |
| 57 |
Egli M, Fitze P, Mirabella A. Weathering and evolution of soils formed on granitic, glacial deposits:Results from chronosequences of Swiss alpine environments. Catena, 2001, 45(1): 19-47. DOI:10.1016/S0341-8162(01)00138-2 |
| 58 |
Fedo C M, Nesbitt H W, Young G M. Unraveling the effects of potassium metasomatism in sedimentary rocks and paleosols, with implications for paleoweathering conditions and provenance. Geology, 1995, 23(10): 921-924. DOI:10.1130/0091-7613(1995)023<0921:UTEOPM>2.3.CO;2 |
| 59 |
Harnois L. The CIW index:A new chemical index of weathering. Sedimentary Geology, 1988, 55(3): 319-322. |
| 60 |
Simons F J, Swennen R. Quantitative characterization of coal by means of microfocal X-ray computed microtomography(CMT)and color image analysis(CIA). International Journal of Coal Geology, 1997, 34(1): 69-88. |
| 61 |
Yang S Y, Li C X, Yang D Y et al. Chemical weathering of the loess deposits in the lower Changjiang Valley, China, and paleoclimatic implications. Quaternary International, 2004, 117(1): 27-34. DOI:10.1016/S1040-6182(03)00113-7 |
| 62 |
Nesbitt H W, Young G M. Early Proterozoic climates and plate motions inferred from major element chemistry of lutites. Nature, 1982, 299(5885): 715-717. DOI:10.1038/299715a0 |
| 63 |
Nesbitt H W, Young G M. Prediction of some weathering trends of plutonic and volcanic rocks based on thermodynamic and kinetic considerations. Geochimica et Cosmochimica Acta, 1984, 48(7): 1523-1534. DOI:10.1016/0016-7037(84)90408-3 |
② Polar Research Institute of China, Shanghai 200136)
Abstract
Moraines are main sources of global dusts, which link to global climate, atmospheric aerosol, the oceanic elemental cycles and productivity of the ocean. There has been a focus on the studies of contemporary dust sources(especially the desert and loess)at middle latitudes, but these have been little study of modern high-latitude dust sources, which come primarily from glacial sources. For understanding influence of glaciation, transportation and chemical weathering to physical and chemical property of moraines in modern periglacial environment, here, we investigate the grain size, magnetic susceptibility and chemical elements of moraines(grain size ≤ 2mm)from Austre Lovénbreen glacier, Ny-Ålesund, Arctic. 32 moraines have been sampled on the ground surface at the depth of no more than 5cm in front of Austre Lovénbreen glacier, which covers 5.69km2 with its terminus at an elevation of 100m. These samples can be divided into two parts, 28 LIA(Little Ice Age)moraines(sedimentation age ≤ 100 years)and 4 tundra soil samples(sedimentation age≈8762 years). The results display that:(1) Among the grain sizes of glacial moraines, sand(>63μm) occupies first place, silt(2~63μm)comes second and clay( < 2μm) is the least. For most moraines, grain size distribution of them generally show bimodal or multimodal spectrum, and the spectrum peaks of LIA moraines and tundra soils appear at 10~30μm, 100~200μm and 30~60μm, 300~450μm respectively. Nearshore LIA moraines and tundra soils have more coarse average grain sizes and higher positive skewness than LIA moraines near the terminus of Austre Lovénbreen glacier, indicating that fine component(≤ 63μm) of them was lost distinctly because of transportation. (2) The magnetic susceptibility of moraines ranges from 5.5×10⁻⁸ m3/kg to 11.4×10⁻⁸ m3/kg with the average of 7.7×10⁻⁸ m3/kg. It can be found that the magnetic susceptibility of moraines is positively correlated with total iron content, depends on parent material and has an effect by transportation and size sorting. The pedogenesis is weak in periglacial environment. (3) Compared with LIA moraines, tundra soils accumulate Si and deplete Al, Fe, K, Ca and Mg elements. The average chemical compositions of LIA moraines are very similar pattern with Luochuan loess and Clark values of UCC(Upper Continental Crust). The average of CIA(Chemical Index of Alteration)values is 58.57, which indicates the low weathering intensity in periglacial environment. The moraines' values plotted on a trend between UCC and Luochuan loess in triangle chart of CIA, thus, provides an implication that the loess dust could come from moraines which are the glaciogenic dust sources. Based on the observations, we suggest that the CIA values can generally tell the difference of weathering intensity between of LIA moraines and tundra soils in periglacial environment. For LIA moraines that were deposited with relatively short time, the CIA values could mainly be changed by the grain size sorting and corresponding changes of different mineral types and contents in sediment transportation. 2017, Vol.37

