② 江苏省地理环境演化国家重点实验室 培育建设点, 南京 210023;
③ 江苏省地理信息资源开发与利用协同创新中心, 南京 210023;
④ 西安交通大学全球环境变化研究院, 西安 710049)
DO事件(Dansgaard-Oeschger events)最早发现于格陵兰冰芯记录[1~3],是指发生在末次冰期格陵兰地区的一系列增温事件,其主要特征为:事件开始时增温异常迅速,通常在几十年内完成,随后温度呈现缓慢下降趋势,最后又以快速降温结束,呈现“锯齿状”变化模式。南极冰芯δ18O记录同样显示末次冰期存在一系列千年尺度增温事件[4~7],但与格陵兰增温事件反相位,其振幅更小,温度变化更为缓和,呈现近似对称的变化模式。类似事件也在北半球中、低纬地区不同地质记录中体现[8~13],但其形式复杂多样,需要定年可靠、高分辨率的记录进一步确定不同区域DO事件的不同响应模式,为研究该类事件的动力学机制提供基础。
南京葫芦洞石笋研究结果表明末次冰期亚洲夏季风千年尺度振荡与北高纬气候紧密耦合[14]。然而,越来越多的石笋证据反映了亚洲夏季风DO事件与格陵兰地区温度变化形式存在显著差异[15~21]。例如,中国西南小白龙洞石笋δ18O显示DO12事件的开始异常缓慢[15, 21],与格陵兰在事件开始时快速增温形成鲜明对比。类似的差异也出现在DO1事件(即Bølling-Allerød暖期),在该事件期间,亚洲夏季风在事件开始后表现出持续增强的特点[18, 19],而格陵兰气温却呈现出缓慢下降趋势。但这些差异仅发现于持续时间相对较长的DO事件上,对于短时间尺度DO事件的区域差异,目前尚未见报道,主要原因是能够确定这种差异的高分辨率地质记录的匮乏[22]。
具有年纹层特征的地质记录(如冰芯[23]和湖泊沉积[24])为分析气候突变事件的区域差异提供了契机。已有研究表明:湖北神农架青天洞年纹层石笋与南京葫芦洞年纹层石笋在记录千年尺度事件上具有很好的一致性[25]。本文利用青天洞的一支年纹层石笋(编号:QT15),基于年层时标和高分辨率(约5a)δ18O序列,重建了同位素3阶段(MIS 3)晚期亚洲夏季风演化历史。在分析亚洲季风区与北高纬地区DO3事件特征基础上,讨论了亚洲夏季风千年尺度事件的可能驱动机制。
2 样品和方法青天洞(31°20′N,110°22′E;海拔1630m)位于湖北神农架山区,该洞长约50m,上覆60~100m二叠系灰岩。由于洞口狭窄,洞穴封闭性较好,通风不畅,目前洞内仍然可见滴水,相对湿度接近100 %。青天洞位于典型的亚洲季风区,夏季高温多雨,冬季寒冷干燥。年平均气温约为7.4℃,最高气温出现在7月,最低气温出现在1月。年平均降水量为1500~2000mm,其中80 %的降水集中在6~9月。附近气象站(武汉:30°37′N,114°08′E)数据显示,大气降水δ18O值在夏季约为-9.5 ‰,冬季约为-4.5 ‰。即当夏季风强盛时,大气降水δ18O值明显偏负。关于该洞穴环境的详细描述参见Liu等[16]。
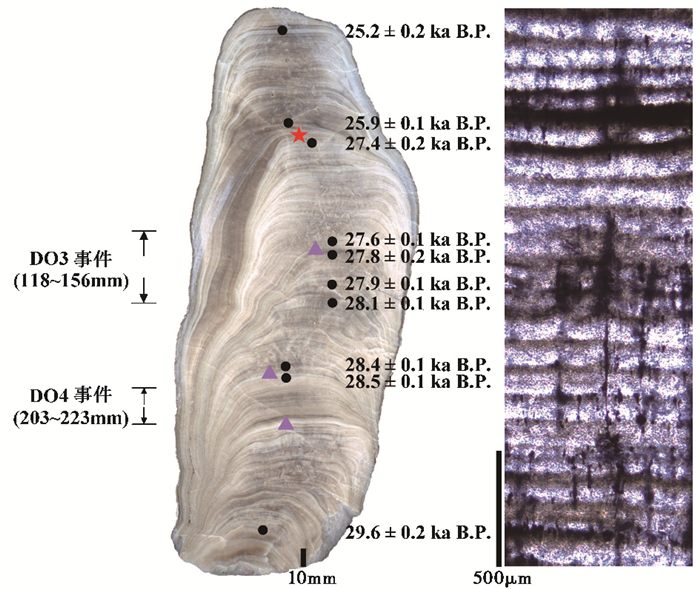
采集于离洞口40m的一支石笋(编号:QT15)长约285mm,顶部和底部直径约为70mm,中间部分直径约为110mm (图 1)。沿生长轴切开并抛光,抛光面距顶68mm处出现明显的岩性和生长中心变化。将石笋制成薄片,在显微镜下可见垂直于生长轴的水平纹层(图 1)。纹层由透明条带与暗色条带构成沉积旋回,与已发表的青天洞其他石笋年纹层相似[16, 17, 25~28],推测该石笋纹层具有年际旋回特征,其类型属于南方石笋纹层[29]。纹层在68mm以上部分并不清晰,因此本文主要研究68~285mm部分。
|
图 1 QT15石笋抛光面和显微纹层特征 黑色圆点表示测年点位置,红色五角星表示沉积间断位置,紫色三角形表示可能存在的沉积间断,这3个位置的稳定同位素及纹层变化特征在图 3中的A、B和C显示 Fig. 1 Photos for the sample QT15 from Qingtian Cave, Central China, and its layer couplets under the microscope. The black dots indicate the postions of dated sub-samples. The red star stands for the position of hiatus. The light purple triangles represent the postions of the potential growth discontinuities, which are A, B and C implied by Fig. 3 |
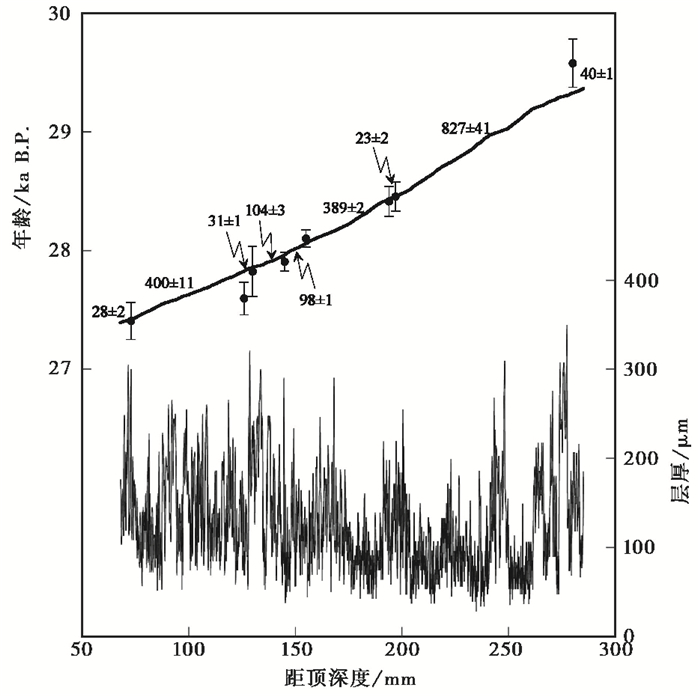
用直径0.9mm的牙钻在石笋抛光面上共采集10个样品用于U/Th定年,化学分离和纯化方法参照Edwards等[30],分析仪器为MC-ICP-MS Neptune,分析方法参照Shen等[31]和Shao等[32],由西安交通大学全球环境变化研究院和南京师范大学石笋同位素实验室测试完成。年龄分析误差为±2σ,结果见表 1。同时,用直径0.5mm的牙钻共采集435个样品用于氧、碳同位素分析,采样间隔为0.5mm,约5a分辨率。采用碳酸盐自动进样装置与Finnigan MAT -253联机测试,每9个样品加测1个标准样品(NBS-19)进行监控,VPDB标准,δ18O和δ13C分析误差(2σ)分别优于0.06 ‰和0.05 ‰,由南京师范大学石笋同位素实验室测试完成。纹层统计在Olympus岩相显微镜透射光条件下(4倍物镜)进行,通过图像传感器(CCD)与计算机进行联机统计。统计结果显示68~285mm纹层总数为1940±64条,纹层厚度在30~350μm之间(图 2),年层统计误差由透明条带与暗色条带边界不清导致(图 3a)。
| 表 1 青天洞石笋QT15铀系测年结果* Table 1 U-series dating results of stalagmite QT15 from Qingtian Cave |
|
图 2 青天洞QT15年龄模式和纹层厚度 年龄-深度曲线附近的数字表示测年点之间的纹层计数和误差 Fig. 2 Age model and layer thickness for sample QT15 from Qingtian Cave. The sum of layers and uncertainty in band-counting between adjacent dates are also showed along with the age-depth curve |
|
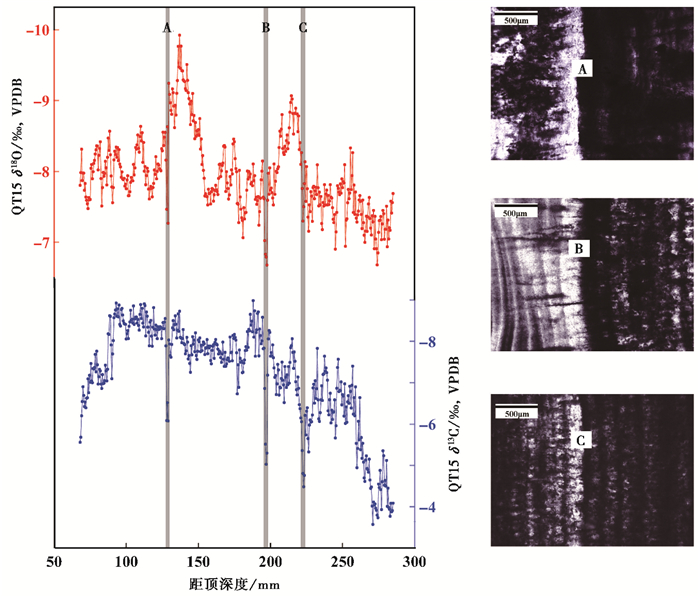
图 3 青天洞QT15石笋δ18O和δ13C随深度变化序列及δ18O、δ13C和纹层突变暗示的沉积间断 灰色阴影棒(A、B和C)表示可能存在沉积间断的位置(图 1中紫色三角形标注),分别处在126mm、196mm和223mm,δ18O、δ13C和纹层在这3处发生显著突变 Fig. 3 Stable isotopic records (δ18O and δ13C) for sample QT15 and the potential growth discontinuities suggested by sharp changes in δ18O, δ13C and layers from Qingtian Cave. The gray shading bars (A, B and C) indicate growth discontinuities at depths of 126mm, 196mm and 223mm respectively (positions of the light purple triangles in Fig. 1). The pictures on the right show the layers observed under microscope at three postions mentioned above |
U/Th定年结果(表 1)显示QT15在68mm处沉积间断的持续时间约为1500a。在此沉积间断以下部分,纹层统计获取的生长速率曲线与U/Th实测年龄确立的生长速率曲线基本一致(图 2),从而证明这些纹层为年纹层。因此,运用最小二乘法可将年层计数和U/Th实测年龄建立的生长速率曲线进行最大相关性匹配[33],从而获得石笋QT15的年层时标。包括U/Th测年误差和年层统计误差在内,该年层时标最大年龄误差为±240a。
图 3显示,在128mm、196mm和223mm处δ13C和δ18O值均显著偏正,振幅分别达到了2 ‰和1 ‰,同时伴随着显著的年层厚度变化,在石笋抛光面上也可观察到相应的岩性和生长轴的细微改变(图 1)。这些异常表明QT15在这3处深度附近也可能存在沉积间断。但是考虑到纹层统计与U/Th实测年龄结果十分吻合,因此推测这3处沉积间断的持续时间较为短暂。
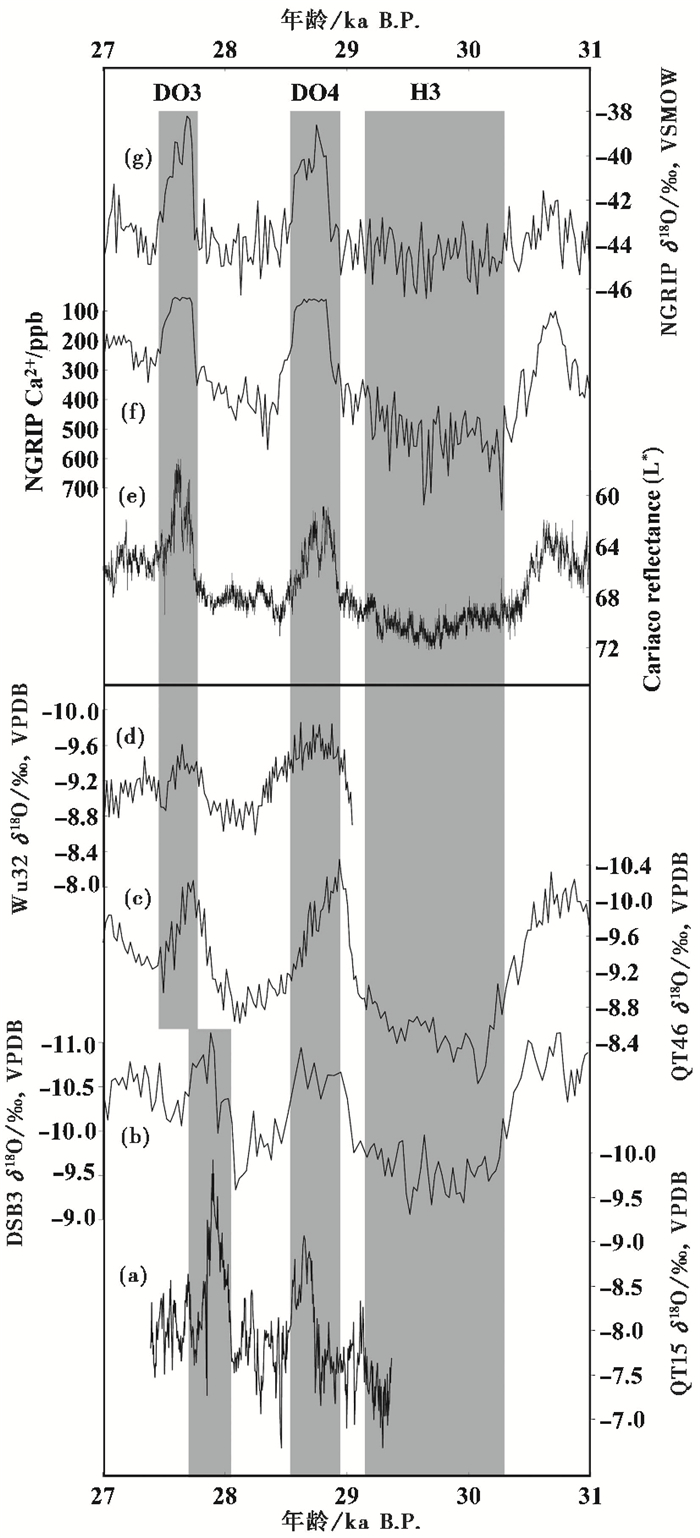
3.2 石笋δ18O序列基于QT15年层时标,建立了29.4~27.4ka B.P.石笋δ18O变化序列,平均分辨率约为5a (图 4a)。δ18O值在29.4~27.4ka B.P.期间总体呈偏负趋势,变化范围在-6.7 ‰~-9.9 ‰之间;在约28.7ka B.P.和27.9ka B.P.,δ18O值显著偏负,振幅分别达到了1 ‰和2 ‰。将QT15石笋δ18O序列与亚洲季风区其他石笋记录对比[34],无论是长期趋势还是百年尺度变化均表现出良好的一致性(图 4a~4d),表明QT15石笋δ18O反映了大尺度亚洲季风环流特征。
|
图 4 青天洞QT15石笋δ18O序列与其他记录的联系 (a) 青天洞QT15石笋δ18O记录;(b) 大石包洞DSB3石笋δ18O记录[34];(c) 三宝洞SB46石笋δ18O记录[34];(d) 雾露洞Wu32石笋δ18O记录[34];(e) Cariaco海盆岩芯反射率记录[43];(f) 格陵兰冰芯NGRIP Ca2+浓度记录[42];(g) 格陵兰冰芯NGRIP δ18O记录[38, 39]3条灰色阴影棒分别表示DO3事件、DO4事件和H3事件 Fig. 4 Regional correlation between the Qingtian Cave δ18O record (a, this study) and other δ18O records form Dashibao Cave (b), Sanbao Cave (c) and Wulu Cave (d)[34], the reflectance record from Cariaco basin[43](e), Ca2+record[42](f) and δ18O record from Greenland ice core[38, 39](g). The gray bars indicate DO3, DO4 and H3 events |
对中国石笋δ18O的季风强度解译有不同的观点,如Dayem等[35],但根据已发表的石笋记录(如Cheng等[36])和模拟研究结果[37]以及该洞穴已有研究资料[16, 17],QT15石笋δ18O百年-千年尺度振荡主要反映亚洲夏季风强度变化,δ18O值偏负,表示亚洲夏季风增强;反之亦然。
4 讨论 4.1 与其他指标记录的联系石笋QT15开始生长于H3事件结束时期(图 4),可能反映了当时亚洲夏季风逐步增强。QT15记录的两个百年尺度夏季风增强事件也得到了贵州雾露洞、大石包洞和湖北三宝洞记录的支持[34](图 4b~4d),分别对应于格陵兰冰芯记录中的DO3和DO4两个快速增温事件[38, 39](图 4g)。在QT15石笋δ18O记录中,DO3事件的振幅比DO4事件强约1.0 ‰ (图 4a),而其他石笋记录却没有显示类似特征(图 4b~4d)。这一差异可能反映了不同洞穴岩溶环境对气候信号的干扰,也可能是QT15记录中存在短暂的沉积间断,从而没有完整刻画DO4事件(图 3)。
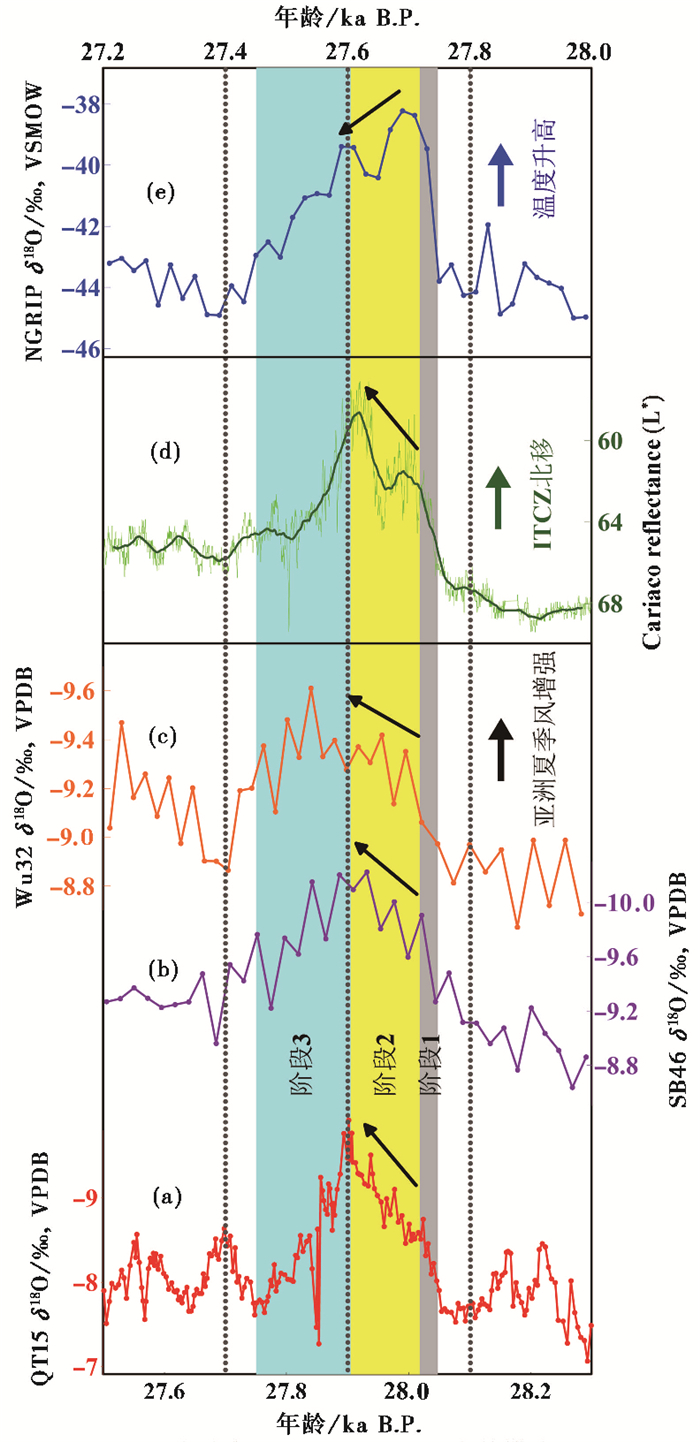
格陵兰冰芯记录的Ca2+浓度主要指示源区环境(主要是中国干旱半干旱区[40, 41])或传输路径变化,Ca2+浓度在DO3和DO4事件期间显著降低[42](图 4f),与此时亚洲夏季风显著增强一致。而Cariaco海盆岩芯反射率记录反映了赤道辐合带(ITCZ)平均纬度位置的变化[12, 43](图 4e和图 5d),在DO3和DO4事件期间,该海盆岩芯反射率显著降低,表明此时ITCZ向北移动[44],与此相关的亚洲夏季风也增强。
|
图 5 北半球高、低纬地区DO3事件模式对比 (a) 青天洞QT15石笋δ18O记录;(b) 三宝洞SB46石笋δ18O记录[34];(c) 雾露洞Wu32石笋δ18O记录[34];(d) Cariaco海盆岩芯反射率记录(深绿色曲线为201点平滑)[43];(e) 格陵兰冰芯NGRIP δ18O记录[38, 39]在以上这些记录的年龄误差范围内,QT15时标向年轻方向移动了300a,SB46和Wu32向年轻方向移动了110a;DO3事件被分为3个阶段,分别用灰色、黄色和浅蓝色阴影棒表示 Fig. 5 Detailed comparison of DO3 event between Qingtian Cave δ18O record (a, red, this study), Sanbao Cave δ18O record[34](b, purple), Wulu Cave δ18O record[34](c, orange), Cariaco reflectance record[43](d, green, bold forest green curve indicates 201-point running mean) and NGRIP δ18O record[38, 39](e, blue). Within combined age errors of the records, QT15 timescale is shifted younger by 300 years, and Sanbao and Wulu timescales are shifted younger by 110 years respectively. Three phases identified during DO3 event are denoted by shading bars |
格陵兰冰芯δ18O记录的DO事件具有显著的“锯齿状”特征[1~3],这一特征即使在较短的DO事件(如DO3事件,见图 5e)也十分显著。由于石笋QT15在DO4事件开始阶段可能存在沉积间断(图 3),因此本文只讨论DO3事件的特征。根据QT15年层计数结果及δ18O变化特征,DO3事件可以划分为3个阶段(图 5):第一阶段(28.04~28.01ka B.P.),δ18O值在约30年内迅速偏负约1 ‰,表明亚洲夏季风显著增强。由于末次冰期亚洲夏季风千年尺度突变事件可能与格陵兰温度同步变化[14, 37, 45, 46],这一阶段很可能对应格陵兰冰芯记录中DO3事件开始时的突然增温。因此,在QT15和格陵兰冰芯NGRIP两记录联合误差范围内,可将QT15时标向年轻方向移动300a。第二阶段持续约100a (28.01~27.91ka B.P.),δ18O值在这一阶段缓慢持续偏正,表明亚洲夏季风持续增强。然而,这一变化趋势与格陵兰温度变化趋势相反,因为此时格陵兰温度已呈下降趋势。第三阶段(27.91~27.74ka B.P.),QT15石笋δ18O值缓慢偏正,对应格陵兰温度持续降低直至冰阶水平,指示DO3事件结束。
由于大石包洞石笋DSB3δ18O记录分辨率较低(约30a,见图 4b),因此难以识别其记录的DO3事件模式。然而,三宝洞石笋SB46和雾露洞石笋Wu32记录的DO3事件在定年误差范围内均显示了与QT15相似的事件模式(图 5b和5c)。此外,与DO3事件类似的模式也被Cariaco海盆岩芯反射率所记录[43](图 5d),表明亚洲夏季风强度与ITCZ平均纬度位置紧密联系。这些记录的相似性表明北半球低纬地区记录的DO3事件可能具有相同的变化模式。因此,尽管末次冰期亚洲夏季风突变事件的时频特征可能受北高纬控制[14, 47],但以往研究已经表明持续时间较长的DO12和DO8事件在格陵兰冰芯δ18O记录与亚洲季风区石笋记录中存在显著的模式差异[15, 20, 21],而本文提供的证据进一步显示北高纬地区与亚洲季风区在短尺度DO事件上也存在不同的模式特征。这些模式差异可能反映了末次冰期低纬水文与北高纬温度对DO事件的不同响应。
另一方面,北大西洋中、低纬地区记录的DO事件模式与格陵兰地区温度变化模式也存在类似差异。例如,在DO事件期间,阿尔沃兰海和伊比利亚西边缘海岩芯记录的海表温度表现为显著的上升趋势或“平顶”特征[48~51],与格陵兰地区快速升温后的下降趋势显著不同,这也得到了亚热带北大西洋东部海表温度和盐度记录的支持[52, 53]。Vautravers等[52]认为这一模式特征是北大西洋30~40°N地区存在的普遍现象,可能反映了该区域风场的变化。此外,格陵兰冰芯过剩δD记录反映了水汽源区(即低纬海洋)的水文变化过程,其记录的DO事件同样呈现出“平顶”特征[54],而Ca2+浓度变化也有类似特征[55],可能反映了北半球中、低纬度地区相对稳定的水文循环和大气环流[54]。
需要特别指出的是,在末次冰消期,亚洲夏季风类似DO3事件的变化模式同样出现在DO1事件(即Bølling-Allerød暖期)期间[14, 18, 19, 56];而德国南部Ammersee湖泊岩芯[57]、Cariaco海盆[58, 59]、Santa Barbara海盆[60]和法国南部以及土耳其北部的石笋记录[61]均显示DO1事件存在类似模式。DO1事件期间,北半球太阳辐射增强以及冰川融水导致的海水δ18O偏负可能导致了该事件在高、低纬地区的模式差异[14, 19, 61];此外,亚洲季风区以及西太平洋暖池附近的石笋记录均显示DO1事件向YD事件(Younger Dryas event)转化过程异常缓慢,同样显示出与格陵兰地区气温变化显著不同的模式特征[16, 17, 19, 62],暗示了虽然淡水注入导致了北大西洋温盐环流减弱,进而触发了YD事件,但是温盐环流减弱在低纬地区造成的影响可能与格陵兰地区存在显著差异[62]。
最近,南半球气候状况对末次冰期亚洲夏季风千年尺度突变事件的影响越来越受到关注[15~18, 21, 63~65]。例如,与格陵兰地区气温变化相比,亚洲季风区石笋记录的DO12和YD事件开始过程均非常缓慢,可能与来自南半球的越赤道气流增强有关[15~17]。以往研究表明末次冰期南北半球千年尺度气候变化表现为“跷跷板”模式[4~7],DO3事件期间这一模式可能依然存在,这也得到了亚洲季风区石笋记录的进一步支持[34, 46]。DO8事件开始时的多阶段演化特征即有可能与南北半球温度呈反相位有关,进而与大气“跷跷板”机制联系[20]。在DO3事件期间,北半球温度相对较高而南半球温度相对较低,两半球之间的温度梯度随之增大,从而导致了ITCZ向北移动(图 5d)以及越赤道气流增强[66~68],更多的水汽传输到亚洲季风区。因此,亚洲夏季风在DO3事件开始后持续增强的特征可能与此时赤道辐合带(ITCZ)北移和越赤道气流增强有关。
5 结论利用湖北神农架青天洞一支年纹层石笋(QT15),基于年层时标和高分辨率(约5a)δ18O序列,重建了29.4~27.4ka B.P.亚洲夏季风演变历史。石笋δ18O值在约28.7ka B.P.和27.9ka B.P.显著偏负,表明亚洲夏季风显著增强,分别对应于格陵兰冰芯记录的DO3和DO4事件。QT15记录的DO3事件呈现出3阶段演化特征:第一阶段(28.04~28.01ka B.P.),亚洲夏季风在约30a内突然增强,对应于格陵兰地区该事件开始时的突然增温,揭示了北半球高、低纬突变气候事件的内在机制联系;第二阶段(28.01~27.91ka B.P.),亚洲夏季风呈现持续增强趋势,与格陵兰地区逐渐降温趋势相反,表明亚洲夏季风与格陵兰温度存在显著的区域差异;第三阶段(27.91~27.74ka B.P.),亚洲夏季风强度和格陵兰地区温度均显著降低,指示DO3事件结束。以往研究表明持续时间较长的DO事件在高、低纬地区存在显著的模式差异,而来自QT15的高分辨δ18O证据则进一步表明类似的模式差异也存在于持续时间较短的DO事件。DO3确立后的季风持续缓慢增强,与大西洋Cariaco海盆岩芯反射率记录基本一致,但明显不同于对应的格陵兰的缓慢降温趋势。末次冰期南北半球千年尺度气候变化表现为“跷跷板”模式,在DO3事件期间,北半球温度相对较高而南半球温度相对较低,两半球之间的温度梯度随之增大,因此亚洲夏季风在该事件开始后持续增强的特征可能与此时赤道辐合带(ITCZ)北移和越赤道气流增强有关。
致谢: 感谢南京师范大学地理科学学院杨少华、邓少林硕士在采集稳定同位素样品给予的帮助;感谢匿名审稿专家和编辑部老师给予的建设性修改意见。
| 1 |
Johnsen S J, Clausen H B, Dansgaard W, et al. Irregular glacial interstadials recorded in a new Greenland ice core. Nature,1992, 359 (6393) : 311~313.
doi:10.1038/359311a0 ( 0) 0)
|
| 2 |
Dansgaard W, Johnsen S J, Clausen H B, et al. Evidence for general instability of past climate from a 250-kyr ice-core record. Nature,1993, 364 (6434) : 218~220.
doi:10.1038/364218a0 ( 0) 0)
|
| 3 |
Grootes P M, Stuiver M, White J W C, et al. Comparison of oxygen isotope records from the GISP 2 and GRIP Greenland ice cores. Nature,1993, 366 (6455) : 552~554.
doi:10.1038/366552a0 ( 0) 0)
|
| 4 |
Blunier T, Chappellaz J, Schwander J, et al. Asynchrony of Antarctic and Greenland climate change during the Last Glacial period. Nature,1998, 394 (6695) : 739~743.
doi:10.1038/29447 ( 0) 0)
|
| 5 |
Blunier T, Brook E J. Timing of millennial-scale climate change in Antarctica and Greenland during the Last Glacial period. Science,2001, 291 (5501) : 109~112.
doi:10.1126/science.291.5501.109 ( 0) 0)
|
| 6 |
EPICA Community Members. One-to-one coupling of glacial climate variability in Greenland and Antarctica. Nature,2006, 444 (7116) : 195~198.
doi:10.1038/nature05301 ( 0) 0)
|
| 7 |
Wais Divide Project Members. Precise interpolar phasing of abrupt climate change during the last ice age. Nature,2015, 520 (7549) : 661~665.
doi:10.1038/nature14401 ( 0) 0)
|
| 8 |
Thouveny N, de Beaulieu J L, Bonifay E, et al. Climate variations in Europe over the past 140 kyr deduced from rock magnetism. Nature,1994, 371 (6497) : 503~506.
doi:10.1038/371503a0 ( 0) 0)
|
| 9 |
Behl R J, Kennett J P. Brief interstadial events in the Santa Barbara basin, NE Pacific, during the past 60 kyr. Nature,1996, 379 (6562) : 243~246.
doi:10.1038/379243a0 ( 0) 0)
|
| 10 |
Schulz H, Von Rad U. Correlation between Arabian Sea and Greenland climate oscillations of the past 110, 000 years. Nature,1998, 393 (6680) : 54~57.
( 0) 0)
|
| 11 |
Allen J R M, Brandt U, Brauer A, et al. Rapid environmental changes in southern Europe during the Last Glacial period. Nature,1999, 400 (6746) : 740~743.
doi:10.1038/23432 ( 0) 0)
|
| 12 |
Peterson L C, Haug G H, Hughen K A, et al. Rapid changes in the hydrologic cycle of the Tropical Atlantic during the Last Glacial. Science,2000, 290 (5948) : 1947~1951.
( 0) 0)
|
| 13 |
Genty D, Blamart D, Ouahdi R, et al. Precise dating of Dansgaard-Oeschger climate oscillations in Western Europe from stalagmite data. Nature,2003, 421 (6925) : 833~837.
doi:10.1038/nature01391 ( 0) 0)
|
| 14 |
Wang Y J, Cheng H, Edwards R L, et al. A high-resolution absolute-dated Late Pleistocene monsoon record from Hulu Cave, China. Science,2001, 294 (5550) : 2345~2348.
doi:10.1126/science.1064618 ( 0) 0)
|
| 15 |
Cai Y, An Z, Cheng H, et al. High-resolution absolute-dated Indian monsoon record between 53 and 36ka from Xiaobailong Cave, Southwestern China. Geology,2006, 34 (8) : 621~624.
doi:10.1130/G22567.1 ( 0) 0)
|
| 16 |
Liu D B, Wang Y J, Cheng H, et al. A detailed comparison of Asian monsoon intensity and Greenland temperature during the Allerød and Younger Dryas events. Earth and Planetary Science Letters,2008, 272 (3~4) : 691~697.
( 0) 0)
|
| 17 |
Liu D, Wang Y, Cheng H, et al. Centennial-scale Asian monsoon variability during the mid-Younger Dryas from Qingtian Cave, Central China. Quaternary Research,2013, 80 (2) : 199~206.
doi:10.1016/j.yqres.2013.06.009 ( 0) 0)
|
| 18 |
Shen C C, Kano A, Hori M, et al. East Asian monsoon evolution and reconciliation of climate records from Japan and Greenland during the Last Deglaciation. Quaternary Science Reviews,2010, 29 (23~24) : 3327~3335.
( 0) 0)
|
| 19 |
Ma Z B, Cheng H, Tan M, et al. Timing and structure of the Younger Dryas event in Northern China. Quaternary Science Reviews,2012, 41 (0) : 83~93.
( 0) 0)
|
| 20 |
Duan F, Liu D, Cheng H, et al. A high-resolution monsoon record of millennial-scale oscillations during late MIS 3 from Wulu Cave, South-west China. Journal of Quaternary Sciences,2014, 29 (1) : 83~90.
doi:10.1002/jqs.2681 ( 0) 0)
|
| 21 |
Han L Y, Li T Y, Cheng H, et al. Potential influence of temperature changes in the Southern Hemisphere on the evolution of the Asian summer monsoon during the Last Glacial period. Quaternary International,2016, 392 : 239~250.
doi:10.1016/j.quaint.2015.05.068 ( 0) 0)
|
| 22 |
Voelker A H L. Global distribution of centennial-scale records for Marine Isotope Stage (MIS)3:A database. Quaternary Science Reviews,2002, 21 (10) : 1185~1212.
doi:10.1016/S0277-3791(01)00139-1 ( 0) 0)
|
| 23 |
Alley R B, Meese D A, Shuman C A, et al. Abrupt increase in Greenland snow accumulation at the end of the Younger Dryas event. Nature,1993, 362 (6420) : 527~529.
doi:10.1038/362527a0 ( 0) 0)
|
| 24 |
Brauer A, Haug G H, Dulski P, et al. An abrupt wind shift in Western Europe at the onset of the Younger Dryas cold period. Nature Geoscience,2008, 1 (8) : 520~523.
doi:10.1038/ngeo263 ( 0) 0)
|
| 25 |
Zhang W, Wu J, Wang Y, et al. A detailed East Asian Monsoon history surrounding the 'Mystery Interval' derived from three Chinese speleothem records. Quaternary Research,2014, 82 (1) : 154~163.
doi:10.1016/j.yqres.2014.01.010 ( 0) 0)
|
| 26 |
Liu D, Wang Y, Cheng H, et al. Cyclic changes of Asian monsoon intensity during the early Mid-Holocene from annually-laminated stalagmites, Central China. Quaternary Science Reviews,2015, 121 : 1~10.
doi:10.1016/j.quascirev.2015.05.003 ( 0) 0)
|
| 27 |
邓朝, 汪永进, 刘殿兵, 等. "8.2ka"事件的湖北神农架高分辨率年纹层石笋记录. 第四纪研究, 2013, 33 (5) : 945~953.
Deng Chao, Wang Yongjin, Liu Dianbing, et al. The Asian monsoon variability around 8.2ka B.P. recorded by an annually-laminated stalagmite from Mt. Shennongjia, Central China. Quaternary Sciences,2013, 33 (5) : 945~953. (  0) 0)
|
| 28 |
张振球, 刘殿兵, 汪永进, 等. 中全新世东亚季风年至10年际气候变率:湖北青天洞5.56~4.84ka B.P.石笋年层厚度与地球化学证据. 第四纪研究, 2014, 34 (6) : 1247~1255.
Zhang Zhenqiu, Liu Dianbing, Wang Yongjin, et al. Annual-to decadal-scale variability of Asian monsoon climates during Mid-Holocene:Evidence from proxies of annual bands and geochemical behaviors of a speleothem from 5.56ka B.P. to 4.84ka B.P. in Qingtian Cave, Central China. Quaternary Sciences,2014, 34 (6) : 1247~1255. (  0) 0)
|
| 29 |
谭明, 潘根兴, 王先锋, 等. 石笋与环境--石笋纹层形成的环境机理初探. 中国岩溶, 1999, 18 (3) : 3~11.
Tan Ming, Pan Genxing, Wang Xianfeng, et al. Stalagmite and environment--Preliminary study on the formation of laminated stalagmites. Carsologica Sinica,1999, 18 (3) : 3~11. (  0) 0)
|
| 30 |
Edwards R L, Chen J H, Wasserburg G J, et al. 238U-234U-230Th-232Th systematics and the precise measurement of time over the past 500, 000 years. Earth and Planetary Science Letters,1987, 81 (2~3) : 175~192.
( 0) 0)
|
| 31 |
Shen C C, Edwards Lawrence R, Cheng H, et al. Uranium and thorium isotopic and concentration measurements by magnetic sector inductively coupled plasma mass spectrometry. Chemical Geology,2002, 185 (3~4) : 165~178.
( 0) 0)
|
| 32 |
Shao Q, Bahain J J, Wang W, et al. Coupled ESR and U-series dating of Early Pleistocene Gigantopithecus faunas at Mohui and Sanhe caves, Guangxi, Southern China. Quaternary Geochronology,2015, 30 : 524~528.
doi:10.1016/j.quageo.2015.04.008 ( 0) 0)
|
| 33 |
Domínguez-Villar D, Baker A, Fairchild I J, et al. A method to anchor floating chronologies in annually laminated speleothems with U-Th dates. Quaternary Geochronology,2012, 14 : 57~66.
doi:10.1016/j.quageo.2012.04.019 ( 0) 0)
|
| 34 |
Zhao K, Wang Y, Edwards R L, et al. High-resolution stalagmite δ18O records of Asian monsoon changes in central and Southern China spanning the MIS 3/2 transition. Earth and Planetary Science Letters,2010, 298 (1~2) : 191~198.
( 0) 0)
|
| 35 |
Dayem K E, Molnar P, Battisti D S, et al. Lessons learned from oxygen isotopes in modern precipitation applied to interpretation of speleothem records of paleoclimate from Eastern Asia. Earth and Planetary Science Letters,2010, 295 (1~2) : 219~230.
( 0) 0)
|
| 36 |
Cheng H, Sinha A, Wang X, et al. The global paleomonsoon as seen through speleothem records from Asia and the Americas. Climate Dynamics,2012, 39 (5) : 1045~1062.
doi:10.1007/s00382-012-1363-7 ( 0) 0)
|
| 37 |
Liu Z, Wen X, Brady E C, et al. Chinese cave records and the East Asia Summer Monsoon. Quaternary Science Reviews,2014, 83 : 115~128.
doi:10.1016/j.quascirev.2013.10.021 ( 0) 0)
|
| 38 |
Andersen K K, Svensson A, Johnsen S J, et al. The Greenland ice core chronology 2005, 15~42ka. Part 1:Constructing the time scale. Quaternary Science Reviews,2006, 25 (23~24) : 3246~3257.
( 0) 0)
|
| 39 |
Svensson A, Andersen K K, Bigler M, et al. The Greenland ice core chronology 2005, 15~42ka. Part 2:Comparison to other records. Quaternary Science Reviews,2006, 25 (23~24) : 3258~3267.
( 0) 0)
|
| 40 |
Biscaye P E, Grousset F E, Revel M, et al. Asian provenance of glacial dust (stage 2) in the Greenland Ice Sheet Project 2 Ice Core, Summit, Greenland. Journal of Geophysical Research:Oceans,1997, 102 (C12) : 26765~26781.
doi:10.1029/97JC01249 ( 0) 0)
|
| 41 |
Bory A J M, Biscaye P E, Grousset F E, et al. East-Asian dust sources and long-range transport:Mineralogical and isotopic (Sr and Nd) constraints. Geochimica et Cosmochimica Acta,2003, 67 (18) : A43~A43.
( 0) 0)
|
| 42 |
Rasmussen S O, Seierstad I K, Andersen K K, et al. Synchronization of the NGRIP, GRIP, and GISP 2 ice cores across MIS 2 and palaeoclimatic implications. Quaternary Science Reviews,2008, 27 (1~2) : 18~28.
( 0) 0)
|
| 43 |
Deplazes G, Luckge A, Peterson L C, et al. Links between tropical rainfall and North Atlantic climate during the Last Glacial period. Nature Geoscience,2013, 6 (3) : 213~217.
doi:10.1038/ngeo1712 ( 0) 0)
|
| 44 |
Fleitmann D, Burns S J, Mangini A, et al. Holocene ITCZ and Indian monsoon dynamics recorded in stalagmites from Oman and Yemen (Socotra). Quaternary Science Reviews,2007, 26 (1~2) : 170~188.
( 0) 0)
|
| 45 |
Duan W, Cheng H, Tan M, et al. Onset and duration of transitions into Greenland Interstadials 15.2 and 14 in Northern China constrained by an annually laminated stalagmite. Scientific Reports,2016, 6 : 20844.
doi:10.1038/srep20844 ( 0) 0)
|
| 46 |
Chen S, Wang Y, Cheng H, et al. Strong coupling of Asian Monsoon and Antarctic climates on sub-orbital timescales. Scientific Reports,2016, 6 : 32995.
doi:10.1038/srep32995 ( 0) 0)
|
| 47 |
Yuan D, Cheng H, Edwards R L, et al. Timing, duration, and transitions of the last interglacial Asian monsoon. Science,2004, 304 (5670) : 575~578.
doi:10.1126/science.1091220 ( 0) 0)
|
| 48 |
Cacho I, Grimalt J O, Pelejero C, et al. Dansgaard-Oeschger and Heinrich event imprints in Alboran Sea paleotemperatures. Paleoceanography,1999, 14 (6) : 698~705.
doi:10.1029/1999PA900044 ( 0) 0)
|
| 49 |
Pérez-Folgado M, Sierro F J, Flores J A, et al. Western Mediterranean planktonic foraminifera events and millennial climatic variability during the last 70 kyr. Marine Micropaleontology,2003, 48 (1~2) : 49~70.
( 0) 0)
|
| 50 |
de Abreu L, Shackleton N J, Sch nfeld J, et al. Millennial-scale oceanic climate variability off the Western Iberian margin during the last two glacial periods. Marine Geology,2003, 196 (1~2) : 1~20.
( 0) 0)
|
| 51 |
Sánchez Goñi M F, Landais A, Cacho I, et al. Contrasting intrainterstadial climatic evolution between high and middle North Atlantic latitudes:A close-up of Greenland Interstadials 8 and 12. Geochemistry, Geophysics, Geosystems,2009, 10 (4) : Q04U04.
( 0) 0)
|
| 52 |
Vautravers M J, Shackleton N J, Lopez-Martinez C, et al. Gulf stream variability during marine isotope stage 3. Paleoceanography,2004, 19 (2) : PA2011.
( 0) 0)
|
| 53 |
Schmidt M W, Vautravers M J, Spero H J, et al. , Rapid subtropical North Atlantic salinity oscillations across Dansgaard-Oeschger cycles. Nature,2006, 443 (7111) : 561~564.
doi:10.1038/nature05121 ( 0) 0)
|
| 54 |
Jouzel J, Stiévenard M, Johnsen S J, et al. The GRIP deuterium-excess record. Quaternary Science Reviews,2007, 26 (1~2) : 1~17.
( 0) 0)
|
| 55 |
Mayewski P A, Meeker L D, Twickler M S, et al. Major features and forcing of high-latitude northern hemisphere atmospheric circulation using a 110, 000-year-long glaciochemical series. Journal of Geophysical Research:Oceans,1997, 102 (C12) : 26345~26366.
doi:10.1029/96JC03365 ( 0) 0)
|
| 56 |
Yang Yan, Yuan Daoxian, Cheng Hai, et al. Precise dating of abrupt shifts in the Asian monsoon during the last deglaciation based on stalagmite data from Yamen Cave, Guizhou Province, China. Science China:Earth Sciences,2010, 53 (5) : 633~641.
doi:10.1007/s11430-010-0025-z ( 0) 0)
|
| 57 |
von Grafenstein U, Erlenkeuser H, Brauer A, et al. A Mid-European decadal isotope-climate record from 15, 500 to 5000 years B.P. Science,1999, 284 (5420) : 1654~1657.
doi:10.1126/science.284.5420.1654 ( 0) 0)
|
| 58 |
Hughen K A, Southon J R, Lehman S J, et al. Synchronous radiocarbon and climate shifts during the Last Deglaciation. Science,2000, 290 (5498) : 1951~1954.
doi:10.1126/science.290.5498.1951 ( 0) 0)
|
| 59 |
Hughen K A, Eglinton T I, Xu L, et al. Abrupt tropical vegetation response to rapid climate changes. Science,2004, 304 (5679) : 1955~1959.
doi:10.1126/science.1092995 ( 0) 0)
|
| 60 |
Hendy I L, Kennett J P, Roark E B, et al. Apparent synchroneity of submillennial scale climate events between Greenland and Santa Barbara Basin, California from 30~10ka. Quaternary Science Reviews,2002, 21 (10) : 1167~1184.
doi:10.1016/S0277-3791(01)00138-X ( 0) 0)
|
| 61 |
Genty D, Blamart D, Ghaleb B, et al. Timing and dynamics of the Last Deglaciation from European and North African δ13C stalagmite profiles--Comparison with Chinese and South Hemisphere stalagmites. Quaternary Science Reviews,2006, 25 (17~18) : 2118~2142.
( 0) 0)
|
| 62 |
Partin J W, Quinn T M, Shen C C, et al. Gradual onset and recovery of the Younger Dryas abrupt climate event in the tropics. Nature Communications,2015, 6 : 8061.
doi:10.1038/ncomms9061 ( 0) 0)
|
| 63 |
Rohling E, Mayewski P, Challenor P. On the timing and mechanism of millennial-scale climate variability during the Last Glacial cycle. Climate Dynamics,2003, 20 (2) : 257~267.
( 0) 0)
|
| 64 |
Rohling E J, Liu Q S, Roberts A P, et al. Controls on the East Asian monsoon during the Last Glacial cycle, based on comparison between Hulu Cave and polar ice-core records. Quaternary Science Reviews,2009, 28 (27~28) : 3291~3302.
( 0) 0)
|
| 65 |
Zhang H, Griffiths M L, Huang J, et al. Antarctic link with East Asian summer monsoon variability during the Heinrich Stadial-Bølling interstadial transition. Earth and Planetary Science Letters,2016, 453 : 243~251.
doi:10.1016/j.epsl.2016.08.008 ( 0) 0)
|
| 66 |
An Z. The history and variability of the East Asian paleomonsoon climate. Quaternary Science Reviews,2000, 19 (1~5) : 171~187.
( 0) 0)
|
| 67 |
Cvijanovic I, Langen P L, Kaas E, et al. Southward Intertropical Convergence Zone shifts and implications for an Atmospheric Bipolar Seesaw. Journal of Climate,2013, 26 (12) : 4121~4137.
doi:10.1175/JCLI-D-12-00279.1 ( 0) 0)
|
| 68 |
McGee D, Donohoe A, Marshall J, et al. Changes in ITCZ location and cross-equatorial heat transport at the Last Glacial Maximum, Heinrich Stadial 1, and the Mid-Holocene. Earth and Planetary Science Letters,2014, 390 : 69~79.
doi:10.1016/j.epsl.2013.12.043 ( 0) 0)
|
② State Key Laboratory Cultivation Base of Geographical Environment Evolution (Jiangsu Province), Nanjing 210023;
③ Jiangsu Center for Collaborative Innovation in Geographical Information Resource Development and Application, Nanjing 210023;
④ Institute of Global Environmental Change, Xi'an Jiaotong University, Xi'an 710049)
Abstract
The Dansgaard-Oeschger cycle has been extensively investigated in various geological archives, including ice cores, marine sediments and cave stalagmites. However, pattern and structure of the Dansgaard-Oeschger events appear to be quite different in different archives, suggesting different forcing mechanisms behind these regional climate changes. Here we further investigate character of DO3 in Asian monsoon climates by an annually laminated stalagmite from Central China. Stalagmite QT15 was collected from Qingtian Cave (31°20'N, 110°22'E, 1630m a.s.l.), which is located at Mt. Shennongjia, Central China. Qingtian Cave is about 50m in length, and overlain by 60~100m Permian limestone. The relative humidity inside is close to 100%. This site is predominantly controlled by the Asian Monsoon (AM), characterized by a distinct seasonal cycle of warm-wet summer and cold-dry winter. At the site, average annual temperature is about 7.4℃, with a maximum in July and a minimum in January. Mean annual precipitation near the cave is between 1500mm and 2000mm, about 80% of which falls during the rainy season when the Asian Summer Monsoon (ASM) prevails. Stalagmite QT15 is 285mm long, with a diameter from 70mm to 110mm. A hiatus at the depth of 68mm is visually inspected on the polished surface. Sample QT15 shows nearly straight horizontal layers perpendicular to the growth axis. These layers are composed of transparent and dark inclusion-rich calcite couplets. However, the couplets are not clear in the upper portion (above 68mm). Therefore, we only focus on the lower portion (68mm to 285mm) in this study. Ten sub-samples were collected along the growth axis with 0.9-mm-diameter carbide dental burs for 230Th dating. The measurements were performed by multi-collected inductively coupled plasma mass spectrometry (ICP-MS) on a Fisher Thermo-Neptune spectrometer. All dates are in stratigraphic order with typical analytical errors (2σ). For stable isotopic measurements, 435 sub-samples were drilled with 0.5-mm-diameter carbide dental burs along the growth axis. The analysis was conducted on a Finnigan MAT-253 mass spectrometer fitted with a Kiel Carbonate Device. Spatial resolution is 0.5mm, which yields an average resolution of about 5 years. Stable isotope measurements were reported relative to Vienna PeeDee Belemnite (VPDB) and with standardization determined relative to NBS 19. Precision of δ18O and δ18C values is 0.06‰ and 0.05‰ respectively, at the 1-sigma level. Based on a lamina chronology and 435 calcite δ18O data for QT15, a detailed history of ASM from 29.4ka B.P. to 27.4ka B.P. is reconstructed. Two strong ASM events occurred surrounding 28.7ka B.P. and 27.9ka B.P., which are correlated to Dansggard-Oeschger event 3 and 4(DO3 and 4) in Greenland ice cores. During DO3, three phases of AM variability can be identified. During phase 1(28.04~28.01ka B.P.), the calcite δ18O values decrease by about 1‰ within 30a, indicating an abrupt strengthening in the ASM, which corresponds to the abrupt Greenland warming at the onset of DO3. However, during the subsequent 100a, i.e. phase 2(28.01~27.91ka B.P.), the ASM is still increasing gradually while the temperature in Greenland is slowly decreasing. During phase 3(27.91~27.74ka B.P.), the ASM begins to weaken when Greenland temperature experiences a continuous decline, indicating the end of DO3. A rapid and sharp shift is observed in both Greenland temperature and ASM intensity at the onset of DO3, indicating strong coupling of Northern Atlantic climates and ASM. However, the discrepancy between Greenland temperature and ASM after the inception of DO3 implies the regional difference between them. Previously, regional differences have been reported regarding the pattern of long-duration DO events. The observed decoupling between Greenland temperature and ASM during DO3 indicates that regional imprint can be expressed during relatively short DO events. The similarity between stalagmite δ18O and Cariaco basin reflectance record suggests that the gradual enhancement of the ASM after the onset of DO3 is likely linked to the northerly latitudinal position of the intertropical convergence zone (ITCZ) and increasing trans-equatorial air steams caused by the relatively high temperature contrast between the Southern and Northern Hemispheres. 2017, Vol.37

