② 瑞典林奈大学, 卡尔马, 瑞典;
③ 河北师范大学泥河湾考古研究院, 石家庄 050024)
近年来,以全球变暖为核心的全球气候变化及其可能引发的生态环境效应成为科学界和社会公众关注的热点,随着全球气候变化和气候敏感性模拟研究的深入,人们逐渐认识到土地覆被变化(LUCC)可能是驱动历史时期气候变化的重要因素之一[1~5]。土地覆被变化主要指植被变化,而孢粉以其体积小、散布广和易于保存等优势成为恢复古植被变化最直接、最可信的代用指标之一[6~10]。但目前对化石花粉的解释多主观地认为花粉百分比等同于植被百分比,而实际情况并非如此,花粉与植被之间并非简单的线性关系[11~14]。例如,以禾本科(Poaceae)植物为主的草原,由于禾本科花粉产量较低,花粉组合中禾本科花粉百分比并不高,而花粉产量较高的蒿属(Artemisia spp.)植物花粉的百分比却很高[15]。因此,研究不同植物类型的花粉产量是正确认识花粉-植被关系的重要基础。
中国已开展了一些相对花粉产量研究[15~20],但主要集中在干旱和半干旱草原或荒漠地区,且估算的对象主要为草本植物。而森林是生态系统的重要组成,对气候变化非常敏感,是研究花粉与植被和气候相互关系的重要载体[21],特别是中国北方地区,乔木植物花粉含量的变化直接反映了季风区温度和降水的变化[22]。中国学者已对森林区花粉组合与植被关系开展了较多研究[11, 12, 15],但相对花粉产量研究较少[18~20]。而森林区主要植物种类的相对花粉产量和相关花粉源范围是利用花粉资料定量重建古植被和土地利用状况的关键。因此,本文为研究北方温带针阔叶混交林的相对花粉产量和相关花粉源范围,在东北长白山和山西太岳山温带针阔叶混交林进行了植被调查,在其基础上利用ERV模型,对研究区主要乔灌木类型(松属、栎属、桦属、落叶松属、胡桃属、椴属、榆属、白蜡树属和胡颓子科)和常见草本类型(蒿属、藜科、禾本科、莎草科、百合科、毛茛科和蓼科)进行了相对花粉产量和相关花粉源范围的估算,以期为定量重建我国较长时间序列和较大空间范围内土地覆被变化提供基础数据,同时为正确认识古植被演替和土地利用状况以及预测未来气候和环境变化提供科学依据。
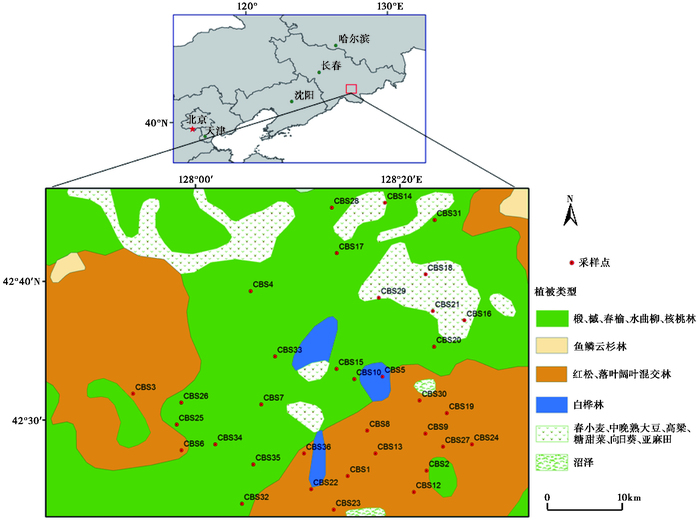
2 研究区概况 2.1 长白山自然概况长白山生态系统是中国最典型、保存最完好的温带山地森林生态系统。研究区位于长白山北坡,地理坐标42°19′39″~42°41′29″N,127°50′11″~128°23′53″E;海拔500~1115m。气候上属于温带大陆性山地气候,冬季漫长严寒,夏季短促凉爽,春季多风,秋季多雾。年均气温-7~-3℃,年降水量600~800mm左右,年均风速2.2~3.4m/s,最大风速8.4m/s[23, 24]。研究区为针阔叶混交林自然景观带[25, 26],植物资源丰富。针阔混交林带分布在海拔1100m以下,植被类型为以红松为主的常绿针叶和落叶阔叶混交林,乔木层除红松(Pinus koraiensis)外,还有长白落叶松(Larix olgensis)、沙松(Abies holophylla)、紫杉(Taxus chinensis)、鱼鳞云杉(Picea jezoensis)和红皮云杉(Picea koraiensis)等针叶树种,以及紫椴(Tilia amurensis)、春榆(Ulmus davidiana)、蒙古栎(Quercus mongolica)、胡桃楸(Juglans mandshurica)、水曲柳(Fraxinus mandschurica)、槭树科(Aceraceae)等阔叶树种;灌木和草本层也较发达,常见种类有毛榛子(Corylus mandshurica)、山梅花(Philadelphus incanus)、长白忍冬(Lonicera ruprechtiana)、蒿属(Artemisia spp.)、菊科(Asteraceae)、山茄子(Anisodus acutangulus)、蚊子草(Filipendula palmata)、透骨草(Phryma leptostachya)、苔草(Carex spp.)等。针叶林带分布在海拔1100~1700m,以云杉(Picea spp.)、冷杉(Abies spp.)和少量红松等针叶树为主(图 1)[23, 27~30]。
|
图 1 长白山采样点周围植被情况图 Fig. 1 Study area and vegetation distribution around the sampling points of Changbai Mountains |
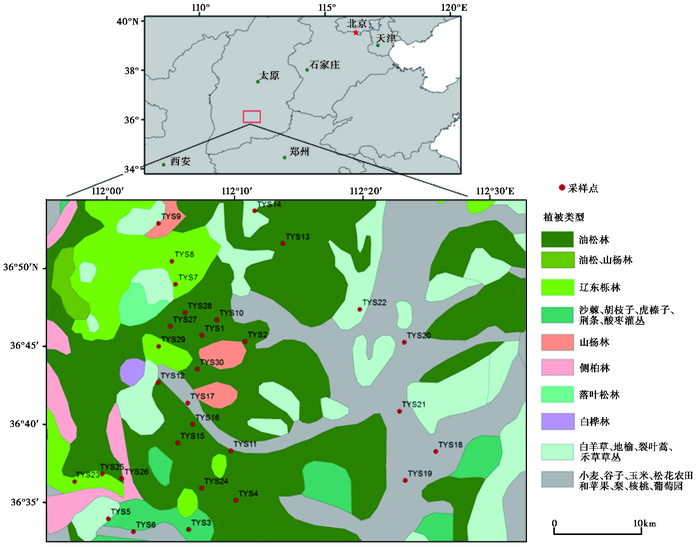
太岳山位于山西省中南部,地形为喀斯特地貌,山势陡峭险峻,地形复杂多变[31~33]。研究区位于太岳山中部,地理坐标36°33′01″~36°53′26″N,111°59′09″~112°25′17″E;海拔1100~2300m。气候上属于暖温带大陆性季风气候,夏季炎热多雨,冬季寒冷干燥,年均气温约8.6℃,年降水量约662mm,年均风速约3.5m/s,瞬时最大风速13.7m/s。太岳山水热条件优越,植被类型复杂多样,地带性植被为暖温带落叶阔叶林,但随着海拔高度的变化,植被呈明显的垂直分布。海拔1100~1800m为针阔叶混交林,主要树种有油松(Pinus tabulaeformis)和华北落叶松(Larix principis-rupprechtii)等针叶树种,以及辽东栎(Quercus liaotungensis)、山杨(Populus davidiana)、白桦(Betula platphylla)、胡桃楸(Juglans mandshurica)等阔叶树种;灌木和草本层较发达,常见的有沙棘(Hippophae rhamnoides)、胡枝子(Lespedeza bicolor)、黄刺玫(Rosa xanthina)、忍冬(Lonicera Japonica)、照山白(Rhododendron micranthum)、暴马丁香(Syringa reticulata),以及苔草(Carex spp.)、蒿属(Artemisia spp.)、菊科(Asteraceae)、唐松草(Thalictrum spp.)、龙芽草(Agrimonia pilosa)等。海拔1800~2200m为华北落叶松林;海拔2200m以上为山地灌丛草甸,常见黄刺玫(Rosa xanthina)、沙棘(Hippophae rhamnoides)、胡枝子(Lespedeza bicolor)以及绣线菊(Spiraea salicifolia)灌丛等。研究区内农作物主要有以小麦(Triticum aestivum)、棉花(Gossypium spp.)、谷子(Setaria italica)、玉米(Zea mays)等(图 2)[34~39]。
|
图 2 太岳山采样点周围植被情况图 Fig. 2 Study area and vegetation distribution around the sampling points of Taiyue Mountains |
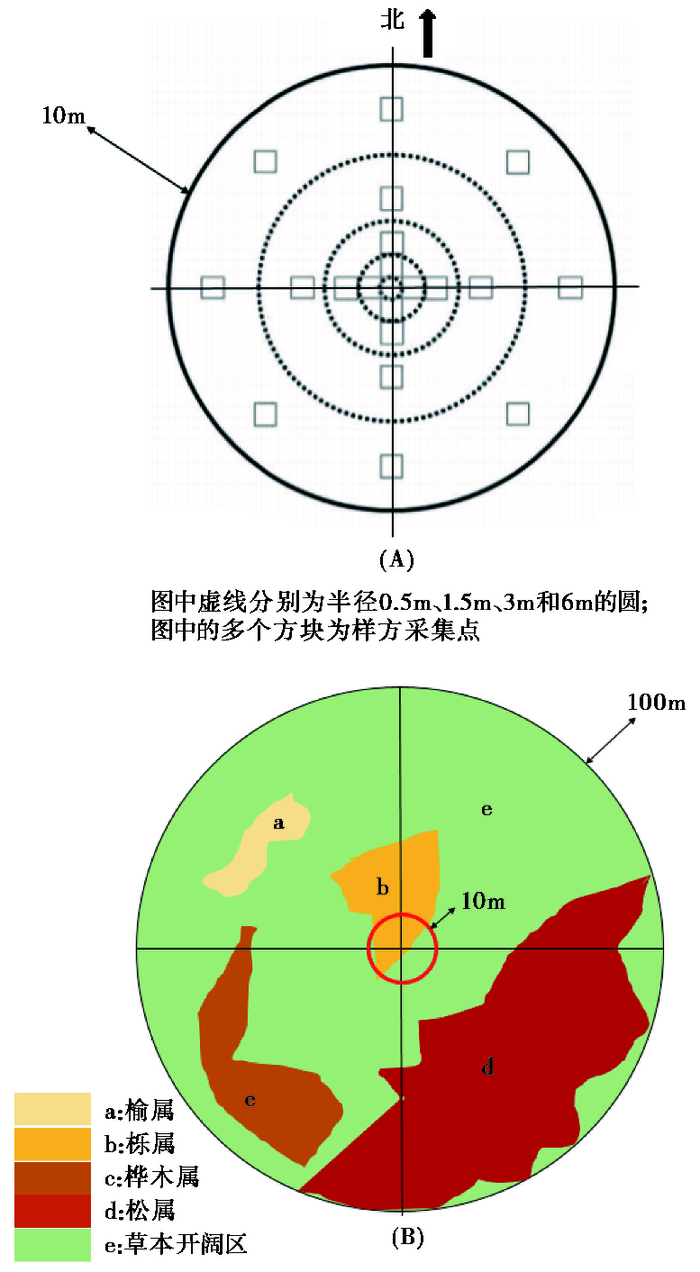
首先用ArcGIS软件在拟选定研究区域内随机生成50个样点,各样点间距不小于3km,以防出现共线性。然后根据区域内地形、地貌与植被覆盖情况,对50个随机样点进行人工筛选,去除那些分布在道路、农田、村庄、陡坡等人类活动影响较大和难以到达的样点。通过筛选,长白山研究区最终保留了36个随机样点,太岳山研究区保留了30个随机样点。2014年8月和2015年7月,分别前往长白山和太岳山地区进行样品采集和植被调查。通过手持GPS找到样点,采集表层苔藓[15, 16, 18, 19, 40, 41]。野外样品采集和植被调查采用特殊的植被调查方法,如图 3所示。需要指出,图 3中100m范围内的植被调查图,划分的群落为简单示例,野外调查应根据实际实际情况描绘群落图[41~43]。
|
图 3 中心样点10m范围采样图(A)和距中心样点100m范围植被调查图(B,其中a、b、c、d和e分别代表不同的植被组成区域,红色圆圈代表中心样点区域) Fig. 3 Central sample point in 10m range (A)and vegetation survey in 100m range(B, the area of a, b, c, d and e stand for different vegetation composition separately, the red circle area stands for the central sample point range) |
花粉提取采用常规的酸碱处理和重液浮选法[44]。每个样品鉴定统计花粉500粒以上。花粉鉴定的同时,测量100粒常见花粉类型的长、短轴尺寸,并根据花粉形状,采用Stoke和Falck方法[45~47]计算常见花粉类型的沉降速率。
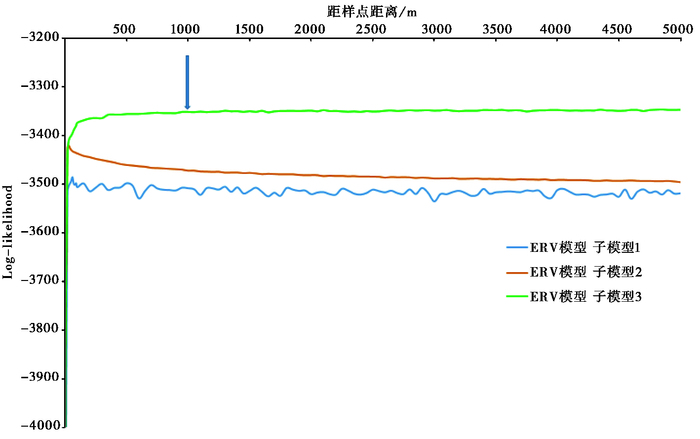
3.3 数据处理采用HUMPOL软件包的Vegetation Survey System(Version 2.0.1)软件计算距样点不同距离的植被盖度[48, 49],并整理成独立的CSV文件;花粉计数数据和花粉沉降速率数据也保存成CSV文件。相对花粉产量计算采用ERV Analysis(Version 1.3.1)软件[50~52]。ERV模型提供了4种适用于不同对象的距离加权方法[53~56],本文采用适用于表土的Prentice加权方法,该模型下有3个子模型,子模型1和子模型2适用于相对植被盖度数据进行计算,子模型3适用于绝对植被盖度数据进行计算,本文植被调查数据为绝对植被盖度数据[40, 57~59]。模型运算时输入包含每个样点花粉计数数据的CSV文件、花粉沉降速率的CSV文件和所有样点植被盖度数据的CSV文件,设置长白山和太岳山沉积盆地半径0.5m,平均风速长白山为3m/s,太岳山为3.5m/s,栎属为参考种,运行ERV模型,计算相关花粉源范围(relevant source area of pollen,简称RSAP)和相对花粉产量(relative pollen productivity, 简称RPP)。相关花粉源范围是指一个沉积盆地花粉组合与周围植被组成存在明显相关性的最大空间范围,在此范围内花粉组合与植被数据之间存在较好的对应关系,此范围以外花粉组合与植被之间不再具有明显的相关性[18]。运用ERV模型生成的log-likelihood. func.score.csv文件提供了对数似然函数得分值(L-LFS)距中心样点距离变化的曲线,曲线变化开始趋于平缓所对应的距离则为相关花粉源范围[40]。
4 研究结果 4.1 长白山地区研究结果 4.1.1 花粉组合特征乔木植物花粉中,各植物的花粉百分比平均值为桦属(29.74 %)、松属(29.67 %)、栎属(7.69 %)、落叶松属(4.62 %)、榆属(3.54 %)和胡桃属(3.08 %)含量相对较高,椴属(1.72 %)、白蜡树属(0.71 %)等含量相对较低,但较为常见;灌木植物花粉含量很低,主要包括麻黄科(0.07 %)和胡颓子科(0.01 %);草本花粉中蒿属(5.04 %)、百合科(2.82 %)、毛茛科(1.6 %)、蓼科(0.94 %)、藜科(0.78 %)、唇形科(0.61 %)和蔷薇科(0.53 %)含量相对较多,莎草科(0.48 %)、禾本科(0.34 %)和菊科(0.09 %)等含量较少(图 4a)。本文选取花粉组合和植被数据中含量较高的8种乔木和3种草本花粉类型(共11种)进行花粉产量估算,分别是:松属、落叶松属、桦属、栎属、胡桃属、椴属、榆属、白蜡树属以及蒿属、禾本科和莎草科。

|
图 4 长白山(a)和太岳山(b)花粉组合特征 Fig. 4 Pollen assemblages of Changbai Mountains(a) and Taiyue Mountains (b) |
通过测量上述11种花粉类型的长短轴和直径大小,运用Stoke和Falck的计算公式[45~47]计算各自的沉降速率(表 1)。
| 表 1 长白山主要花粉类型的大小和沉降速率 Table 1 Pollen fall speed for major 11 pollen types in Changbai Mountains |
图 5是长白山3个子模型结合生成的对数似然函数值的变化曲线图。子模型1的对数似然函数值存在明显的波动起伏变化;子模型2的得分值相比子模型1较高且随距离增大而不断减小;子模型3的对数似然函数值最大,变化趋势也较平缓,且在距采样点1000m左右不再发生明显变化,接近于渐近线。因此,我们把长白山地区的相关花粉源范围确定为1000m左右。
|
图 5 长白山子模型1、2和3的对数似然函数值变化曲线图 Fig. 5 Log-likelihood function score plot for sub-models 1, 2, and 3 from Changbai Mountains |
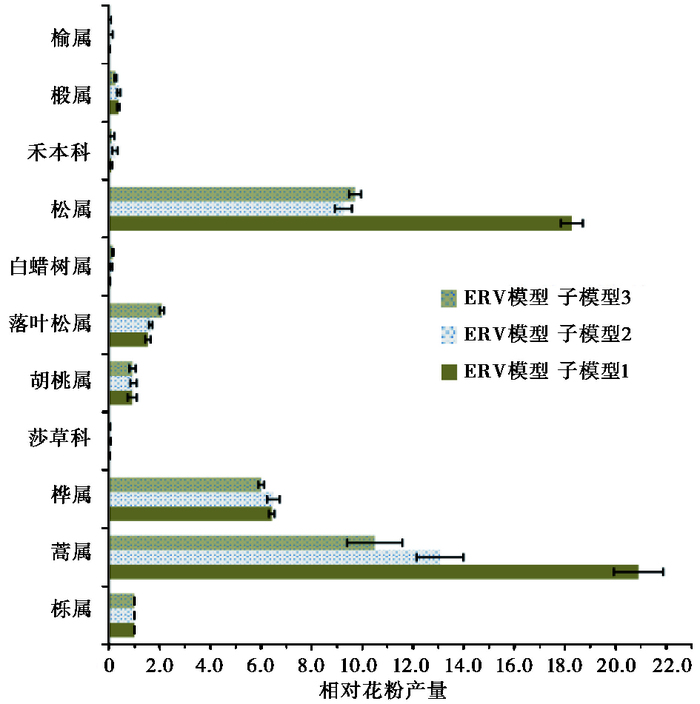
通过ERV模型计算,确定研究区的相关花粉源范围,得到11种花粉类型的相对花粉产量(图 6)。结果显示:以栎属为参考种(PPE为1),长白山11种花粉类型中松属(9.71±0.24)、蒿属(10.49±1.09)、桦属(6.01±0.12)和落叶松属(2.08±0.09)的相对花粉产量较高,胡桃属(0.93±0.13)、禾本科(0.10±0.11)、白蜡树属(0.15±0.03)和椴属(0.25±0.04)居中,莎草科(0.01±0.04)和榆属(0.0004±0.08)较低。
|
图 6 长白山11种花粉类型的相对花粉产量 Fig. 6 RPP(Relative Pollen Productivity)estimates of 11 pollen types from Changbai Mountains |
乔木植物中,以松属(57.76 %)、栎属(14.16 %)和桦属(7.34 %)为主,胡桃属(1.13 %)、鹅而枥属(0.71 %)、落叶松属(0.25 %)和榆属(0.14 %)等含量较低;灌木植物花粉中胡颓子科(2.2 %)含量最高;草本花粉中蒿属(10.28 %)、禾本科(1.47 %)和藜科(0.97 %)含量相对较高,蔷薇科(0.24 %)、毛茛科(0.23 %)、唇形科(0.2 %)和莎草科(0.1 %)等含量较少(图 4b)。选取花粉组合和植被数据中含量较高的10种花粉类型进行花粉产量估算,分别是:松属、落叶松属、桦属、栎属、胡桃属、胡颓子科以及蒿属、禾本科、毛茛科和莎草科。
4.2.2 花粉沉降速率根据Stoke和Falck的计算公式[45~47]计算的太岳山10种花粉类型的沉降速率见表 2。
| 表 2 太岳山主要花粉类型的大小和沉降速率 Table 2 Pollen fall speed for major 10 pollen types in Taiyue Mountains |
太岳山获得的对数似然函数值随距离的变化情况如图 7所示。3个子模型的对数似然函数值的变化趋势都相对平缓,可以看出子模型1的曲线结果存在轻微的连续波动,子模型2的曲线结果虽然与子模型3的曲线结果走势相同且没有明显的波动起伏,但是子模型2更适用于植被百分比数据而非子模型3所适用的植被绝对数据,本文为植被绝对数据,所以选用子模型3的结果。根据子模型3的曲线结果可以看出曲线在距采样点2000m左右基本不再变化。因此,我们把太岳山地区的相关花粉源范围确定为2000m左右。

|
图 7 太岳山子模型1、2、3的对数似然函数值变化曲线图 Fig. 7 Log-likelihood function score plot for sub-models 1, 2, and 3 from Taiyue Mountains |
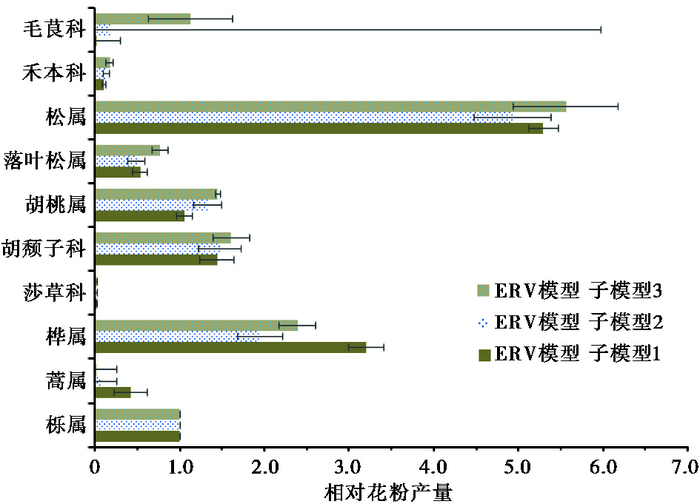
太岳山10种花粉类型的相对花粉产量如图 8所示:以栎属为参考种(PPE为1),松属(5.56±0.62)、桦属(2.39±0.22)、胡颓子科(1.61±0.22)和胡桃属(1.45±0.03)的相对花粉产量较高,毛茛科(1.13±0.50)、蒿属(0.003±0.24)、落叶松属(0.76±0.09)和禾本科(0.17±0.05)适中,莎草科(0.007±0.01)较低。
|
图 8 太岳山10种花粉类型的相对花粉产量 Fig. 8 RPP(Relative Pollen Productivity)estimates of 10 pollen types from Taiyue Mountains |
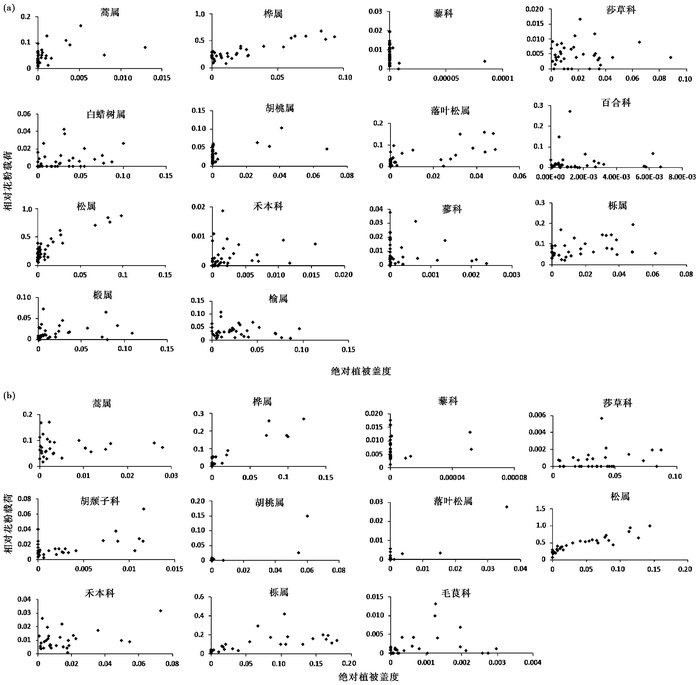
长白山研究区表土花粉组合以松属、桦属、栎属、落叶松属、榆属、椴属、胡桃属以及白蜡树属等类型为主;灌木主要有胡颓子科和麻黄科;草本以蒿属、藜科、禾本科、蓼科、蔷薇科、百合科、菊科以及唇形科等为主(图 9a)。太岳山研究区花粉组合乔木以松属、桦属、栎属、胡桃属等为主,灌木以胡颓子科为代表,草本以蒿属、藜科、禾本科等为主(图 9b)。这些花粉类型对应的植被种类在两个研究区植被中也占绝对优势(图 9)。从图 9可以看出,除藜科、百合科和蓼科3种花粉类型外,其他类型的相对花粉载荷与绝对植被盖度均有着较好的对应关系。可见,花粉组合在一定程度上能够较好地反映研究区的植被特征[60]。
|
图 9 花粉与植被的关系 (a)长白山花粉与植被的关系;(b)太岳山花粉与植被的关系 Fig. 9 Relationship between pollen and vegetation.(a)Changbai Mountains; (b)Tiayue Mountains |
但是,由于受花粉产量以及花粉保存能力等因素的影响[61],花粉组合与周围植被并不完全一致[62, 63]。比如,野外植被调查中发现,长白山槭树科植物分布较多,但花粉组合中槭树科花粉含量很低;另外,长白山和太岳山花粉组合中莎草科花粉含量均较少,但植被调查中出现的频率均较高,这可能与其花粉产量较低和花粉保存能力较差等因素有关。
5.2 相关花粉源范围(RSAP)的比较与影响因素已有研究表明,不同地区相关花粉源范围存在差异,特别是森林区与草原区差别显著。森林区相关花粉源范围一般在1000m以下,草原区则通常大于1000m[16, 44, 45, 49, 64~74]。原因可能是森林区以乔木为优势物种,花粉个体较大,沉降速率较大,加之森林区植被个体高,密闭度大,林内风速较小,导致花粉的传播距离较草原区偏小,因而相关花粉源范围也较小[19]。但不同森林区的相关花粉源范围也存在较大差异[19, 20, 48, 64~66]。为进一步研究弄清影响相关花粉源范围的因素,本文以长白山和太岳山两个研究区为例,探讨风速和沉降速率对RSAP的影响。
(1) 为了探讨风速对RSAP的影响,本文分别计算了两个研究区平均风速(长白山为3m/s;太岳山为3.5m/s)和最大风速(长白山为8.4m/s;太岳山为13.7m/s)下的相关花粉源范围(图 10)。结果显示,随着风速的增大,两个研究区的对数似然函数得分值均有些许增大,但总体形态和变化趋势基本一致,说明两个地区的相关花粉源范围基本不受风速变化的影响,与前人的研究结果一致[15, 18, 75]。

|
图 10 不同风速下的相关花粉源范围 (a)长白山平均风速和最大风速下的RSAP;(b)太岳山平均风速和最大风速下的RSAP Fig. 10 RSAP under different wind speeds. (a)RSAP of Changbai Mountains under average and maximum wind speeds; (b)RSAP of Taiyue Mountains under average and maximum wind speeds |
(2) 关于花粉沉降速率对RSAP的影响说法不一[53, 76, 77]。为了探讨研究区RSAP与花粉类型沉降速率的关系,我们在不改变其他花粉沉降速率的前提下,采用长白山和太岳山以及Li等[20]文中4种共有花粉类型松属、栎属、桦属和落叶松属不同沉降速率(表 3)
| 表 3 花粉沉降速率对比 Table 3 Pollen fall speed comparison |
重新计算本文长白山和太岳山两个研究区的相关花粉源范围(图 11)。从图 11可以看出,当4种花粉类型沉降速率改变后,长白山的对数似然函数值略有不同,但总体趋势基本不变,仍在距采样点1000m左右趋于平缓,太岳山对数似然函数值虽有轻微偏差,但同样曲线总体趋势基本不变,在距样点2000m左右趋于平缓。因此,相关花粉源范围与所选花粉类型沉降速率的大小关系不明显,RSAP受花粉沉降速率影响较小,影响相关花粉源范围的因素还需要进一步的研究。

|
图 11 不同沉降速率下的相关花粉源范围 曲线ERV-子模型3-①代表使用本文沉降速率进行计算,曲线ERV-子模型3-②代表使用Li等[20]已发表文章中的沉降速率进行计算 Fig. 11 RSAP under different fall speeds, "ERV sub-model 3-①" stands for running the ERV sub-model 3 with this paper's fall speeds and "ERV-sub-model 3-②" stands for running the ERV sub-model 3 with published fallspeeds in Li et al.[20] |
前人已经研究了许多乔木植物类型的相对花粉产量[42, 59, 67, 74, 78~82]。研究表明,同种花粉类型的相对花粉产量在不同地区表现出明显的差异性[83, 84]。表 4是不同地区乔木类型的相对花粉产量估算值的比较,通过对比可以看出,本文的估算结果与其他地区差异显著。其中松属的相对花粉产量明显高于其他地区;桦属的估算值比欧洲地区略微偏高;胡桃属和白蜡树属的估算值介于其他地区之间;椴属的花粉产量明显偏低。而本文太岳山对落叶松属的估算值与Li等[20]的研究结果类似,但明显低于本文长白山和欧洲地区的估算结果。同时,本文长白山和太岳山估算的同种类型的相对花粉产量也有较大差别。
| 表 4 不同地区的相对花粉产量估算值 Table 4 RPP estimates relative to Quercus in different regions |
前人认为,植被调查方法和模型参数的差异是导致同一植物类型花粉产量产生差异的主要原因[24, 36, 38]。除去前人的认识外,我们认为植被种类组成的差异可能也是造成相对花粉产量地区性差异的主要原因。花粉鉴定时,由于受鉴定水平的制约,很少能将花粉类型鉴定到种,由此导致某一种花粉类型可能对应不同种植物类型,因此,不同植被种类组成的不同地区,同一花粉类型的相对花粉产量便会有所不同。长白山桦属的相对花粉产量高于欧洲(表 4),可能是因为长白山的桦属植被主要是白桦和油桦(Betula ovalifolia),而欧洲的桦属植物主要是欧洲白桦(Betula pendula)和柔毛桦(Betula pubescens)。另外,太岳山的落叶松主要是华北落叶松,长白山的落叶松是长白落叶松,也可能是导致太岳山和长白山落叶松的相对花粉产量有显著差异的原因。同时,气候条件也可能影响不同地区花粉类型的花粉产量[86, 87]。欧洲已有研究表明桦属的相对花粉产量比落叶松属普遍偏高[67, 68],与本文研究结果一致,这可能是因为这些地区的气候条件更适宜桦属植被的生长,而对落叶松属植被的生长有所限制,从而导致桦属花粉的生产能力更强,产生的花粉更多。本文估算的长白山相对花粉产量与太岳山相比明显偏高,也与长白山充足的水热资源和优越的气候条件为各种植物的生长提供了有力保障有关。此外,参考种的选择也是造成相对花粉产量地区性差异的原因之一。许多研究将禾本科作为参考种[15, 18, 19],但是禾本科的种类繁多,各种禾本科植物花粉产量存在明显差异,而花粉鉴定通常只能鉴定到科,因此以禾本科作为参考种的其他种属的相对花粉产量也必然存在差异。本文以栎属为参考种,但是长白山主要是蒙古栎,而太岳山则以辽东栎为主,这可能是造成两个地区相对花粉产量差异的原因之一。
6 结论(1) 长白山研究区的植被花粉组合特征显示,乔木植物花粉类型主要有桦属、松属、栎属、落叶松属、椴属、榆属、胡桃属、椴属和白蜡属;灌木植物花粉类型主要有麻黄科和胡颓子科;草本类型花粉主要有蒿属、百合科、毛茛科、蓼科、藜科、唇形科、蔷薇科、莎草科、禾本科和菊科。太岳山研究区植物花粉组合特征显示,乔木植物花粉以松属、栎属、桦属、胡桃属、鹅耳枥属、落叶松属、榆属为主;灌木植物花粉主要以和胡颓子科为主;草本花粉类型主要有蒿属、禾本科、藜科、蔷薇科、毛茛科、唇形科和莎草科。两个地区的植被类型特征也分别以这些植物花粉类型为主,表明花粉组合较好地反映了研究区内的植被特征。
(2) 研究区相对花粉产量结果:以栎属为参考种(PPE为1),长白山11种花粉类型中松属(9.71±0.24)、蒿属(10.49±1.09)、桦属(6.01±0.12)和落叶松属(2.08±0.09)的相对花粉产量较高,胡桃属(0.93±0.13)、禾本科(0.10±0.11)、白蜡树属(0.15±0.03)和椴属(0.25±0.04)居中,莎草科(0.01±0.04)和榆属(0.0004±0.08)较低。太岳山10种花粉类型中的松属(5.56±0.62)、桦属(2.39±0.22)、胡颓子科(1.61±0.22)、和胡桃属(1.45±0.03)的相对花粉产量较高,毛茛科(1.13±0.50)、蒿属(0.003±0.24)、落叶松属(0.76±0.09)和禾本科(0.17±0.05)适中,莎草科(0.007±0.01)较低。
(3) 研究区相关花粉源范围计算结果:长白山研究区的相关花粉源范围1000m左右,太岳山研究区的相关花粉源范围2000m左右,风速和花粉沉降速率对其影响较小。
(4) 除去前人的认识植被调查方法和模型参数的差异是导致同一植物类型花粉产量产生差异的主要原因外,不同地区植物种类组成、区域气候特征、花粉鉴定水平导致的参考种不同等原因,也是造成同种花粉类型相对花粉产量产生明显差异的主要原因。
| 1 |
Gaillard M J, Sugita S, Mazier F et al. Holocene land-cover reconstructions for studies on land cover-climate feedbacks. Climate of the Past, 2010, 6(4): 483-499. DOI:10.5194/cp-6-483-2010 |
| 2 |
Houghton R A, Hackler J L, Lawrence K T. The US carbon budget:Contributions from land-use change. Science, 1999, 285(5427): 574-578. DOI:10.1126/science.285.5427.574 |
| 3 |
Caspersen J P, Pacala S W, Jenkins J C et al. Contributions of land-use history to carbon accumulation in US forests. Science, 2000, 290(5494): 1148-1151. DOI:10.1126/science.290.5494.1148 |
| 4 |
Bonan G B. Effects of land use on the climate of the United States. Climatic Change, 1997, 37(3): 449-486. DOI:10.1023/A:1005305708775 |
| 5 |
Fall S, Niyogi D, Gluhovsky A et al. Impacts of land use land cover on temperature trends over the continental United States:Assessment using the North American regional reanalysis. International Journal of Climatology, 2010, 30: 1980-1993. DOI:10.1002/joc.v30:13 |
| 6 |
Lowe J J, Walker M J C. Reconstructing Quaternary Environments. England: Addison Wesley Longman, 1997, 176-177.
|
| 7 |
王开发, 王宪曾. 孢粉学概论. 北京: 北京大学出版社, 1983, 14-15. Wang Kaifa, Wang Xianzeng. An Introduction to Palynology. Beijing: Peking University Press, 1983, 14-15. |
| 8 |
李文漪等. 中国第四纪植被与环境. 北京: 科学出版社, 1998, 20-138. Li Weiyi et al. Vegetation and Climate of the Quaternary in China. Beijing: Science Press, 1998, 20-138. |
| 9 |
Cushing E J. Evidence for differential pollen preservation in Late Quaternary sediments in Minnesota. Review of Palaeobotany and Palynology, 1967, 4(1): 87-101. |
| 10 |
Huntley B, Prentice I C. July temperatures in Europe from pollen data 6000 years before present. Science, 1988, 241(4866): 687-690. DOI:10.1126/science.241.4866.687 |
| 11 |
Li Yuecong. The Topsoil Pollen Assemblages and the Relationship with Modern Vegetation and Climate in the Typical Ecotope of the Northern China. Beijing: Doctoral Thesis of Institute of Geology and Geophysics, Chinese Academy of Sciences, 2005, 1-159.
|
| 12 |
许清海, 李月丛, 阳小兰等. 中国北方几种主要花粉类型与植被定量关系. 中国科学(D辑):地球科学, 2007, 37(2): 192-205. Xu Qinghai, Li Yuecong, Yang Xiaolan et al. The quantitative relationship between some main pollen types and vegetation of the Northern China. Science in China(Series D):Earth Sciences, 2007, 37(2): 192-205. |
| 13 |
宋长青, 吕厚远, 孙湘君. 中国北方花粉-气候因子转换函数建立及应用. 科学通报, 1997, 42(20): 2182-2185. Song Changqing, Lü Houyuan, Sun Xiangjun. The establishment and application of pollen-climate transition function in the Northern China. Chinese Science Bulletin, 1997, 42(20): 2182-2185. DOI:10.3321/j.issn:0023-074X.1997.20.015 |
| 14 |
孙湘君, 王琫瑜, 宋长青. 中国北方部分科属花粉-气候响应面分析. 中国科学(D辑), 1996, 26(5): 431-436. Sun Xiangjun, Wang Bengyu, Song Changqing. The analysis of the pollen-climate response surface for some families genera in the Northern China. Science in China(Series D), 1996, 26(5): 431-436. |
| 15 |
许清海, 曹现勇, Tian Fang等. 中国北方典型草原区花粉产量及其定量重建古植被的作用. 中国科学:地球科学, 2013, 43(12): 2016-2028. Xu Qinghai, Cao Xianyong, Tian Fang et al. Pollen productivity of typical steppe and its effect in quantitative palaeovegetation reconstruction in the Northern China. Science China:Earth Sciences, 2013, 43(12): 2016-2028. |
| 16 |
Wang Y B, Herzschuh U. Reassessment of Holocene vegetation change on the upper Tibetan Plateau using the pollen-based REVEALS model. Review of Palaeobotany and Palynology, 2011, 168(1): 31-40. DOI:10.1016/j.revpalbo.2011.09.004 |
| 17 |
Li Y C, Bunting M J, Xu Q H et al. Pollen-vegetation-climate relationships in some desert and desert-steppe communities in Northern China. The Holocene, 2011, 21(6): 997-1010. DOI:10.1177/0959683611400202 |
| 18 |
李洁. 内蒙古草甸草原区花粉产量和花粉源范围研究. 石家庄: 河北师范大学硕士论文, 2014, 1-6. Li Jie. Study on Relative Pollen Productivities and Relevant Source of Meadow Steppe Species in Inner Mongolia. Shijianzhuang: The Master's Thesis of Hebei Normal University, 2014, 1-6. |
| 19 |
葛亚汶, 李月丛, 李英等. 坝上草原相关花粉源范围与相对花粉产量估算. 第四纪研究, 2015, 35(4): 934-945. Ge Yawen, Li Yuecong, Li Ying et al. Relevant source area of pollen and relative pollen productivity estimates in Bashang steppe. Quaternary Sciences, 2015, 35(4): 934-945. |
| 20 |
Li Y Y, Nielsen A B, Zhao X Q et al. Pollen production estimates(PPEs)and fall speeds for major tree taxa and relevant source areas of pollen(RSAP)in Changbai Mountain, Northeastern China. Review of Palaeobotany and Palynology, 2015, 216: 92-100. DOI:10.1016/j.revpalbo.2015.02.003 |
| 21 |
张井勇, 董文杰, 叶笃正等. 中国植被覆盖对夏季气候影响的新证据. 科学通报, 2003, 48(1): 91-95. Zhang Jingyong, Dong Wenjie, Ye Duzheng et al. New evidence for the influence on summer climate by the vegetation coverage in China. Chinese Science Bulletin, 2003, 48(1): 91-95. |
| 22 |
Xu Q H, Xiao J L, Li Y C et al. Pollen-based quantitative reconstruction of Holocene climate changes in the Daihai Lake area, Inner Mongolia, China. Journal of Climate, 2010, 23(11): 2856-2868. DOI:10.1175/2009JCLI3155.1 |
| 23 |
穆克华. 长白山南地区全新世以来的环境变化. 大连: 辽宁师范大学硕士论文, 2008, 1-15. Mu Kehua. The Climatic Environmental Changes since Holocene in Changbai Mountains. Dalian: The Master Graduate Thesis of Liaoning Normal University, 2008, 1-15. |
| 24 |
王青春, 邓红兵, 王庆礼. 基于生物多样性保护的河岸带植被管理对策——以长白山二道白河为例. 生态学杂志, 2006, 25(6): 682-685. Wang Qingchun, Deng Hongbing, Wang Qingli. Management measures for riverside belt vegetation based on biodiversity conservation:With Erdaobai River in Changbai Mountains as an example. Chinese Journal of Ecology, 2006, 25(6): 682-685. |
| 25 |
姚铭, 刘成祥. 长白山北坡植被组成及土壤分布考察报告. 吉林农业科学, 1984(4): 40-47. Yao Ming, Liu Chengxiang. The investigation report of vegetation composition and soil distribution of the north slope in Changbai Mountains. Journal of Jilin Agricultural Sciences, 1984(4): 40-47. |
| 26 |
黄锡畴, 刘德生, 李祯. 长白山北侧的自然景观带. 地理学报, 1959, 25(6): 435-446. Huang Xichou, Liu Desheng, Li Zhen. Natural landscape zones of the north slope in Changbai Mountains. Journal of Geographical Sciences, 1959, 25(6): 435-446. |
| 27 |
韩士杰, 孙鸿烈, 于贵瑞等. 中国生态系统定位观测与研究数据集-森林生态系统卷(吉林长白山站). 北京: 中国农业出版社, 2012, 1-116. Han Shijie, Sun Honglie, Yu Guirui et al. The Chinese Ecosystem Positional Observation and Research Data Set-forest Ecosystem Volume(Changbai Mountains Station). Beijing: China Agriculture Press, 2012, 1-116. |
| 28 |
孙艳磊, 介冬梅, 刘朝阳等. 长白山北坡垂直植被带木本植物的植硅体形态特征及其环境意义. 微体古生物学报, 2009, 26(3): 261-270. Sun Yanlei, Jie Dongmei, Liu Chaoyang et al. Morphological characteristics of phytolith of woody plants from the vertical vegetation zones on the north slope in Changbai Mountain and its environmental significance. Acta Micropalaeontologica Sinica, 2009, 26(3): 261-270. |
| 29 |
徐文铎, 何兴元, 陈玮等. 长白山植被类型特征与演替规律的研究. 生态学杂志, 2004, 23(5): 162-174. Xu Wenduo, He Xingyuan, Chen Wei et al. Characteristics and succession rules of vegetation types in Changbai Mountain. Chinese Journal of Ecology, 2004, 23(5): 162-174. |
| 30 |
刘志锋, 南颖, 胡浩等. 2001~2008年长白山地区植被覆盖变化特征. 西北植物学报, 2010, 30(2): 391-398. Liu Zhifeng, Nan Ying, Hu Hao et al. Vegetation cover changes in Changbai Mountain from 2000 to 2008. Acta Botanica Boreali-Occidentalia Sinica, 2010, 30(2): 391-398. |
| 31 |
朱建奎, 韩海荣, 伊力塔等. 山西太岳山典型森林群落土壤有机质及氮素研究. 林业资源管理, 2009(2): 70-75. Zhu Jiankui, Han Hairong, Yi Lita et al. Study on soil organic matter and nitrogen of typical forest communities in Shanxi Taiyue Mountains. Forest Resources Management, 2009(2): 70-75. |
| 32 |
马晓勇, 上官铁梁. 太岳山森林群落物种多样性. 山地学报, 2004, 22(5): 606-612. Ma Xiaoyong, Shangguan Tieliang. Species diversity of the forest communities in Taiyue Mountain, Shanxi. Journal of Mountain Science, 2004, 22(5): 606-612. |
| 33 |
郭景唐, 王文新, 曹雪峰等. 太岳山森林土壤类型的调查研究. 北京林业大学学报, 1992, 14(增刊): 134-142. Guo Jingtang, Wang Wenxin, Cao Xuefeng et al. A study on forest soil goups of Taiyue Mounain. Journal of Beijing Forestry University, 1992, 14(Suppl.1): 134-142. |
| 34 |
马晓勇, 上官铁梁, 庞军柱. 太岳山森林群落优势种群生态位研究. 山西大学学报:自然科学版, 2004, 27(2): 209-212. Ma Xiaoyong, Shangguan Tieliang, Pang Junzhu. Study on the niche of dominate populations of the forest community in Taiyue Mountains, Shanxi. Journal of Shanxi University (Natural Science), 2004, 27(2): 209-212. |
| 35 |
张金屯. 山西太岳山植被地理. 山西大学学报:自然科学版, 1988(1): 83-90. Zhang Jintun. Vegetation geography on Taiyue Mountains. Journal of Shanxi University (Natural Science), 1988(1): 83-90. |
| 36 |
马子清, 上官铁梁, 腾崇德. 山西植被. 北京: 中国科学技术出版社, 2001, 1-303. Ma Ziqing, Shangguan Tieliang, Teng Chongde. Vegetation of Shanxi Province. Beijing: China Science and Technology Press, 2001, 1-303. |
| 37 |
李卓玉, 张峰, 上官铁梁. 太岳山种子植物区系的初步分析. 山西大学学报:自然科学版, 1993, 16(1): 101-106. Li Zhuoyu, Zhang Feng, Shangguan Tieliang. A preliminary analysis on the spermatophyte flora in Taiyue Mountains, Shanxi. Journal of Shanxi University(Natural Science), 1993, 16(1): 101-106. |
| 38 |
张丽霞, 张峰, 李秀芬等. 山西太岳山野生植物资源研究. 山西大学学报:自然科学版, 1998, 21(3): 276-280. Zhang Lixia, Zhang Feng, Li Xiufen et al. The research on the wild plants resource in Taiyue Mountains, Shanxi. Journal of Shanxi University(Natural Science), 1998, 21(3): 276-280. |
| 39 |
姚雪芹, 张钦弟, 毕润成等. 山西太岳山辽东栎群落林下草本植物功能群分类. 植物分类与资源学报, 2015, 37(6): 849-855. Yao Xueqin, Zhang Qindi, Bi Runcheng et al. Plant functional group classification of herbaceous species in Quercus wutaishanica communities in the Taiyue Mountains, Shanxi Province of China. Plant Diversity and Resources, 2015, 37(6): 849-855. |
| 40 |
Sugita S. Pollen representation of vegetation in Quaternary sediments:Theory and method in patchy vegetation. Journal of Ecology, 1994, 82(4): 881-897. DOI:10.2307/2261452 |
| 41 |
李洁, 许清海, 张生瑞等. 相对花粉产量及其在古植被定量重建中的应用. 第四纪研究, 2013, 33(6): 1101-1110. Li Jie, Xu Qinghai, Zhang Shengrui et al. Relative pollen productivity and its use in quantitative reconstruction palaeoenvironment. Quaternary Sciences, 2013, 33(6): 1101-1110. |
| 42 |
Brostr m A, Sugita S, Gaillard M J. Pollen productivity estimates for the reconstruction of past vegetation cover in the cultural landscape of Southern Sweden. The Holocene, 2004, 14(3): 368-381. DOI:10.1191/0959683604hl713rp |
| 43 |
Bunting M J, Farrell M A, Brostr m A et al. Palynological perspectives on vegetation survey:A critical step for model-based reconstruction of Quaternary land cover. Quaternary Science Reviews, 2013, 15(82): 41-55. |
| 44 |
Faegri K, Kaland P E, Krzywinski K. Textbook of Pollen Analysis. Oxford: Blackwell, 1989, 295.
|
| 45 |
Duffin K I, Bunting M J. Relative pollen productivity and fall speed estimates for Southern African savanna taxa. Vegetation History and Archaeobotany, 2008, 17(5): 507-525. DOI:10.1007/s00334-007-0101-2 |
| 46 |
Behre K E. Anthropogenic indicators in pollen diagrams. Boreas, 1986, 16(3): 304-304. |
| 47 |
Gregory P H. The Microbiology of the Atmosphere. Aylesbury: Leonard Hill, 1973, 1-377.
|
| 48 |
Bunting M J, Middlelton R. Modelling pollen dispersal and deposition using HUMPOL software:Simulating windroses and irregular lakes. Review of Palaeobotany and Palynology, 2015, 134(3): 185-196. |
| 49 |
Vegetation Survey System(Version 2.0.1). Middleton, 2012(unpublished)
|
| 50 |
Sugita S. A model of pollen source area for an entire lake surface. Quaternary Research, 1993, 39(2): 239-244. DOI:10.1006/qres.1993.1027 |
| 51 |
Nielsen A B, Odgaard B V. Quantitative landscape dynamics in Denmark through the last three millennia based on the Landscape Reconstruction Algorithm Approach. Vegetation History and Archaeobotany, 2010, 19(4): 375-387. DOI:10.1007/s00334-010-0249-z |
| 52 |
Sugita S, Gaillard M J, Hellman S et al. Model-based reconstruction of vegetation and landscape using fossil pollen. In:Proceedings of the 35thCAA(Computer Applications and Quantitative Methods in Archaeology)Conference, Berlin, 2007
|
| 53 |
Prentice I C. Pollen representation, source area and basin size:Toward a unified theory of pollen analysis. Quaternary Research, 1985, 23(1): 76-86. DOI:10.1016/0033-5894(85)90073-0 |
| 54 |
Calcote R. Pollen source area and pollen productivity:Evidence from forest hollows. Journal of Ecology, 1995, 84(4): 591-602. |
| 55 |
Prentice I C, Webb T Ⅲ. Pollen percentages, tree abundances and the Fagerlind effect. Journal of Quaternary Sciences, 1986, 1(1): 35-43. |
| 56 |
Webb T Ⅲ, Howe S E, Bradshaw R et al. Estimating plant abundances from pollen percentages:The use of regression analysis. Review of Palaeobotany and Palynology, 1981, 34(3~4): 269-300. |
| 57 |
Prentice I C, Parsons R W. Maximum log-likelihood linear calibration of pollen spectra in terms of forest composition. Biometrics, 1983, 39(4): 1051-1057. DOI:10.2307/2531338 |
| 58 |
Parsons R W, Prentice I C. Statistical approaches to R-values and the pollen-vegetation relationship. Review of Palaeobotany and Palynology, 1981, 32(2): 127-152. |
| 59 |
Abraham V, Kozáková R. Relative pollen productivity estimates in the modern agricultural landscape of Central Bohemia(Czech Republic). Review of Palaeobotany and Palynology, 2012, 179(8): 1-12. |
| 60 |
陶士臣, 安成邦, 赵家驹等. 新疆东部托勒库勒湖流域表土花粉初步分析. 第四纪研究, 2013, 33(3): 545-550. Tao Shichen, An Chengbang, Zhao Jiaju et al. The preliminary study on the surface pollen from Tuolekule Lake basin eastern Xinjiang, China. Quaternary Sciences, 2013, 33(3): 545-550. |
| 61 |
曹现勇, 田芳, 许清海等. 阴山山脉东段花粉通量及其与表土花粉比较研究. 古生物学报, 2007, 46(4): 411-419. Cao Xianyong, Tian Fang, Xu Qinghai et al. Pollen influx and comparison with surface pollen in the east part of Yinshan Mountains. Acta Palaeontologica Sinica, 2007, 46(4): 411-419. |
| 62 |
Trondman A K, Gaillard M J, Mazier F et al. Pollen-based quantitative reconstructions of Holocene regional vegetation cover(plant-functional types and land-cover types)in Europe suitable for climate modelling. Global Change Biology, 2015, 21(2): 676-697. DOI:10.1111/gcb.12737 |
| 63 |
李月丛, 许清海, 肖举乐等. 中国北方森林植被主要表土花粉类型对植被的指示性. 第四纪研究, 2005, 25(5): 598-608. Li Yuecong, Xu Qinghai, Xiao Jule et al. Indication of some major pollen taxa in surface samples to their parent plants of forest in Northern China. Quaternary Sciences, 2005, 25(5): 598-608. |
| 64 |
Mazier F, Brostr m A, Gaillard M J et al. Pollen productivity estimates and relevant source area of pollen for selected plant taxa in a pasture woodland landscape of the Jura Mountains(Switzerland). Vegetation History and Archaeobotany, 2008, 17(5): 479-495. DOI:10.1007/s00334-008-0143-0 |
| 65 |
Räsänen S, Suutari H, Nielsen A B. A step further towards quantitative reconstructions of past vegetation in Fennoscandian boreal forests:Pollen productivity estimates for six dominant taxa. Review of Palaeobotany and Palynology, 2007, 146(1): 208-220. |
| 66 |
Von Stedingk H, Fyfe R M, Allard A. Pollen productivity estimates from the forest-tundra ecotone in west-central Sweden:Implications for vegetation reconstruction at the limits of the boreal forest. The Holocene, 2008, 18(2): 323-332. DOI:10.1177/0959683607086769 |
| 67 |
Soepboer W, Vervoort J M, Sugita S et al. Evaluating Swiss pollen productivity estimates using a simulation approach. Vegetation History and Archaeobotany, 2008, 17(5): 497-506. DOI:10.1007/s00334-007-0128-4 |
| 68 |
Brostr m A, Sugita S, Gaillard M J et al. Estimating the spatial scale of pollen dispersal in the cultural landscape of Southern Sweden. The Holocene, 2005, 15(2): 252-262. DOI:10.1191/0959683605hl790rp |
| 69 |
Räsänen S, Froyd C, Goslar T. The impact of tourism and reindeer herding on forest vegetation at Saariselkä, Finnish Lapland:A pollen analytical study of a high-resolution peat profile. The Holocene, 2007, 17(4): 447-456. DOI:10.1177/0959683607077016 |
| 70 |
宋之琛. 北京西近郊空气中的孢粉组合. 中国第四纪研究, 1959(2): 69-74. Song Zhichen. The pollen assemblages of the air from Beijing west suburb. Quaternary Sciences, 1959(2): 69-74. |
| 71 |
Poska A, Sepp E, Veski S et al. Using quantitative pollen-based land-cover estimations and a spatial CA_Markov model to reconstruct the development of cultural landscape at Rõuge, South Estonia. Vegetation History and Archaeobotany, 2005, 17(5): 527-541. |
| 72 |
Wang Y, Liu X, Herzschuh U et al. Temporally changing drivers for Late Holocene vegetation changes on the northern Tibetan Plateau. Palaeogeography, Palaeoclimatology, Palaeoecology, 2012, 353(1): 10-20. |
| 73 |
伍婧, 马玉贞, 桑艳礼等. 古植被定量重建与R值模型的发展——R值和ERV模型在兴隆山地区的应用. 第四纪研究, 2013, 33(3): 554-564. Wu Jing, Ma Yuzhen, Sang Yanli et al. Quantitative reconstruction of palaeovegetation and the development of R-value model——Application of R-value and ERV model on Xinglong Mountains. Quaternary Sciences, 2013, 33(3): 554-564. |
| 74 |
Soepboer W, Sugita S, Lotter A F et al. Pollen productivity estimates for quantitative reconstruction of vegetation cover on the Swiss Plateau. The Holocene, 2007, 17(1): 65-77. DOI:10.1177/0959683607073279 |
| 75 |
Nielsen A B, Sugita S. Estimating relevant source area of pollen for small Danish lakes around AD 1800. The Holocene, 2005, 15(7): 1006-1020. DOI:10.1191/0959683605hl874ra |
| 76 |
Bunting M J, Gaillard M J, Sugita S et al. Vegetation structure and pollen source area. The Holocene, 2004, 14(5): 651-660. DOI:10.1191/0959683604hl744rp |
| 77 |
Jackson S T, Wong A. Using forest patchiness to determine pollen source areas of closed-canopy pollen assemblages. Journal of Ecology, 1994, 82(1): 89-99. |
| 78 |
Sugita S, Gaillard M J, Brostr m A. Landscape openness and pollen records:A simulation approach. The Holocene, 1999, 9(4): 409-421. DOI:10.1191/095968399666429937 |
| 79 |
Filipova-Marinova M V, Kvavadze E V, Connor S E et al. Estimating absolute pollen productivity for some European Tertiary-relict taxa. Vegetation History and Archaeobotany, 2010, 19(4): 351-364. DOI:10.1007/s00334-010-0257-z |
| 80 |
Poska A, Meltsov V, Sugita S et al. Relative pollen productivity estimates of major anemophilous taxa and relevant source area of pollen in a cultural landscape of the hemi-boreal forest zone(Estonia). Review of Palaeobotany and Palynology, 2011, 167(1~2): 30-39. |
| 81 |
Hjelle K L, Sugita S. Estimating pollen productivity and relevant source area of pollen using lake sediments in Norway:How does lake size variation affect the estimates. The Holocene, 2012, 22(3): 313-324. DOI:10.1177/0959683611423690 |
| 82 |
Matthias I, Nielsen A B, Giesecke T. Evaluating the effect of flowering age and forest structure on pollen productivity estimates. Vegetation History and Archaeobotany, 2012, 21(6): 471-484. DOI:10.1007/s00334-012-0373-z |
| 83 |
Brostr m A, Nielsen A B, Gaillard M J et al. Pollen productive estimates of key European plant taxa for quantitative reconstruction of vegetation:A review. Vegetation History and Archaeobotany, 2008, 17(5): 461-478. DOI:10.1007/s00334-008-0148-8 |
| 84 |
Bunting M J, Schofield J E, Edwards K J. Estimates of relative pollen productivity(RPP)for selected taxa from southern Greenland:A pragmatic solution. Review of Palaeobotany and Palynology, 2015, 190: 66-74. |
| 85 |
Bunting M J, Armitage R, Binney H A et al. Estimates of relative pollen productivity and relevant source area of pollen for major tree taxa in two Norfolk(UK)woodlands. The Holocene, 2005, 15(3): 459-465. DOI:10.1191/0959683605hl821rr |
| 86 |
Mazier F, Nielsen A B, Brostr m A et al. Signals of tree volume and temperature in a high-resolution record of pollen accumulation rates in northern Finland. Journal of Quaternary Sciences, 2012, 27(6): 564-574. DOI:10.1002/jqs.v27.6 |
| 87 |
Nielsen A B, Moller P F, Giesecke T et al. The effect of climate conditions on inter-annual flowering variability monitored by pollen traps below the canopy in Draved Forest, Denmark. Vegetation History and Archaeobotany, 2010, 19(4): 309-323. DOI:10.1007/s00334-010-0253-3 |
② Linnaeus University, Kalmar, Sweden;
③ Institute of Nihewan Archaeology Research, Hebei Normal University, Shijiazhuang 050024)
Abstract
Relative pollen productivity (RPP) and relevant source area of pollen (RSAP) are the most important factors to infect the relationship between pollen and vegetation. Therefore, the pollen production of plants from one region and its pollen source area must be determined to interpret pollen assemblages and recover paleovegetation and paleoclimate correctly. This paper estimated the RPPs for 11 pollen types from Changbai Mountains (42°19'39"~42°41'29"N, 127°50'11"~128°23'53"E; 500~1115m a.s.l.) and 10 pollen types from Taiyue Mountains (36°33'01"~36°53'26"N, 111°59'09"~112°25'17"E; 1100~2300m a.s.l.), as well as RSAP of study areas using the ERV model based on detailed vegetation survey from 36 points in Changbai Mountains and 30 points in Taiyue Mountains. Results show that RSAP of Changbai Mountains is about 1000m, whereas that of Taiyue Mountains is about 2000m. Wind speed and pollen fall speed have little influence on the RSAP. With Quercus as a reference taxon (PPE=1), among 11 pollen types in Changbai Mountains, RPPs of Pinus (9.71±0.24), Artemisia (10.49±1.09), Betula (6.01±0.12) and Larix (2.08±0.09) is relatively high; RPPs of Juglans (0.93±0.13), Poaceae (0.10±0.11), Fraxinus (0.15±0.03) and Tilia (0.25±0.04) is moderate; and RPPs of Cyperaceae (0.01±0.04) and Ulmus (0.0004±0.08) is relatively low. Among 10 pollen types in Taiyue Mountains, RPPs of Pinus (5.56±0.62), Betula (2.39±0.22), Elaeagnaceae (1.61±0.22) Juglans (1.45±0.03) is relatively high; RPPs of Ranunculaceae (1.13±0.50), Artemisia (0.003±0.24), Larix (0.76±0.09) and Poaceae (0.17±0.05) is moderate; and RPP of Cyperaceae (0.007±0.01) is relatively low. Vegetation composition, regional climatic characteristics, different reference taxon, different species of the same reference taxon, and other reasons could make the RPP of same pollen type remarkably different in various areas. 2017, Vol.37

