2. 自然资源部地裂缝地质灾害重点实验室,南京市珠江路700号,210004;
3. 西部矿产资源与地质工程教育部重点实验室,西安市雁塔路126号,710054
合成孔径雷达干涉测量(InSAR)[1]技术作为当前空间对地观测的重要手段之一,因能大范围、全天候、高精度地获取地表形变信息而得到迅速发展,在机场沉降[2-3]及地裂缝[4-5]监测方面有比较广泛的应用。
北京首都国际机场位于北京市顺义区平各庄和后沙峪两个沉降中心之间,是中国三大门户复合枢纽之一,也是我国最繁忙的机场。但自2003年机场内部出现地面沉降以来,机场范围内已发现多条地表裂缝,为机场正常运营带来了安全隐患[6]。因此,开展北京首都国际机场周围区域地面沉降及机场内部地裂缝稳定性监测,对保障机场的正常运营具有重要意义[7]。
本文对北京首都国际机场周边区域及机场内地裂缝进行监测,基于Sentinel-1卫星2017-05~2021-12的133景升轨和95景降轨影像,采用StaMPS技术[8-9]得到机场周边沉降区的空间分布、时序变化特征及机场内地裂缝长时间活动规律,并对结果展开讨论,为城市地面沉降和地裂缝灾害防治研究提供数据参考和技术支持。
1 研究区概况与数据来源研究区地处华北平原东北部,主要包括北京首都国际机场及其周边地区,地势较平坦,西北高东南低,平均海拔43.5 m。该地区人口众多,用水量大但降水不足,导致地下水开采严重,引发地面沉降。北京首都国际机场始建于1958年,后经多次改、扩建,目前拥有3座航站楼及3条跑道(18R/36L、18L/36R、19/01)。2003年机场出现地面沉降,国内专家学者利用时序InSAR技术获取了2003-06~2019-02机场周边形变结果,发现机场北部形成了2个明显的沉降漏斗,机场内地裂缝的局部沉降发生在顺义-良乡断裂西北侧,断裂东南侧有局部抬升,且地裂缝走向与顺义-良乡断裂走向一致,机场内的不均匀沉降在一定程度上受顺义-良乡断裂控制[10-11]。
为获取北京首都国际机场周围及内部地裂缝的最新形变信息,选取2017-05~2021-12覆盖研究区的133景升轨和95景降轨Sentinel-1影像数据,参数信息见表 1,使用美国NASA SRTM DEM数据消除干涉图中的地形相位并进行像元地理编码,DEM空间分辨率为30 m。精密轨道卫星星历数据被用于提升Sentinel-1影像的轨道精度,去除因轨道误差引起的系统误差,定位精度优于5 cm[12]。
|
|
表 1 SAR影像的详细参数 Tab. 1 Detailed parameters of SAR image |
StaMPS技术的基本原理是利用多景覆盖同一地区的SAR影像,选择其中一景作为主影像,使所有影像均与该主影像配准,并生成干涉图。差分干涉相位可表示为:
| $ \begin{aligned} & \varPhi_{\text {int }, x, i}=\varPhi_{\text {def. } x, i}+\varPhi_{\epsilon, x, i}+ \\ & \varPhi_{\text {atm } x, x i}+\varPhi_{\text {orb }, x, i}+\varPhi_{n, x, i} \\ & \end{aligned} $ | (1) |
式中,Фint, x, i为第x个点目标在第i个干涉图上的缠绕相位,Фdef, x, i为LOS向的形变相位,Ф∈, x, i为地形误差相位,Фatm, x, i为大气延迟相位,Фorb, x, i为轨道误差相位,Фn, x, i为噪声相位。
通过振幅离差指数阈值方法初选PS点,第x个点目标半径L内所有PS点的平均相位值为:
| $ \begin{gathered} \bar{\varPhi}_{\mathrm{int}, x, i}= \\ \bar{\varPhi}_{\mathrm{def}, x, i}+\bar{\varPhi}_{\mathrm{atm}, x, i}+\bar{\varPhi}_{\mathrm{orb}, x, i}+\bar{\varPhi}_{n, x, i} \end{gathered} $ | (2) |
式中,Фn, x, i为Фn, x, i和Ф∈, x, i的样本均值,可忽略不计。式(1)减式(2)得:
| $ \varPhi_{\text {int }, x, i}-\bar{\varPhi}_{\text {int }, x, i}=\varPhi_{\in, x, i}+\varPhi_{n, x, i}-\bar{\varPhi}_{n, x, i}^{\prime \prime} $ | (3) |
式中,
| $ \begin{gathered} \varPhi_{\mathrm{int}, x, i}-\bar{\varPhi}_{\mathrm{int}, x, i}= \\ B_{\perp, x, i} K_{\in, x}+\varPhi_{n, x, i}-\bar{\varPhi}_{n, x, i}^{\prime \prime} \end{gathered} $ | (4) |
定义基于像素时间相关性的评定相位稳定性方法为:
| $ \begin{array}{c} \gamma_x= \left.\frac{1}{N} \right\rvert\, \sum\limits_{i=1}^N \exp \left[\mathrm { j } \left(\varPhi_{\mathrm{in} t, x, i}-\right.\right. \\ \left.\left.\bar{\varPhi}_{\mathrm{int}, x, i}-\Delta \hat{\varPhi}_{\epsilon, x, i}\right)\right] \end{array} $ | (5) |
式中,N为干涉对个数,γx为可用于估计像元相位稳定性选取的最终PS点,
| $ \begin{gathered} \varPhi_{\mathrm{int}, x, i}-\Delta \hat{\varPhi}_{\epsilon, x, i}=\varPhi_{\mathrm{def}, x, i}+\varPhi_{\mathrm{atm}, x, i}+ \\ \varPhi_{\mathrm{orb}, x, i}+\varPhi_{\epsilon, x, i}^{\prime}+\varPhi_{n, x, i} \end{gathered} $ | (6) |
式中,Ф′∈, x, i为由K∈, x估计不准确引起的残余误差,可忽略不计。采用三维相位解缠算法对式(6)的相位进行解缠,并结合SAR影像的分辨率对解缠相位进行时域高通滤波和空域低通滤波,不断调整滤波窗口大小,迭代处理直至获得足够多的PS点并进行网格化处理,最终估计出干涉相位中空间相关的分量,将其去除就能得到形变相位。
2.2 数据处理流程顾及时空基线及多普勒质心差异,选取2019-09-19和2019-08-23为Sentinel-1升轨和降轨的主影像,并与其他影像进行配准和干涉处理。为保证干涉质量,设置空间基线阈值为80 m,最终分别得到119幅和85幅升轨和降轨影像干涉对,其时空基线分布如图 1所示。以振幅离差值0.4为阈值、最大迭代次数为4进行迭代,筛选出高质量PS点,基于时空滤波方法对大气延迟误差进行分离和剔除,采用多项式拟合消除差分干涉图中的轨道误差,利用时空三维相位解缠技术进行解缠,获得最终的地表形变信息。

|
图 1 Sentinel-1影像时空基线分布 Fig. 1 Spatiotemporal space baseline distribution of Sentinel-1 images |
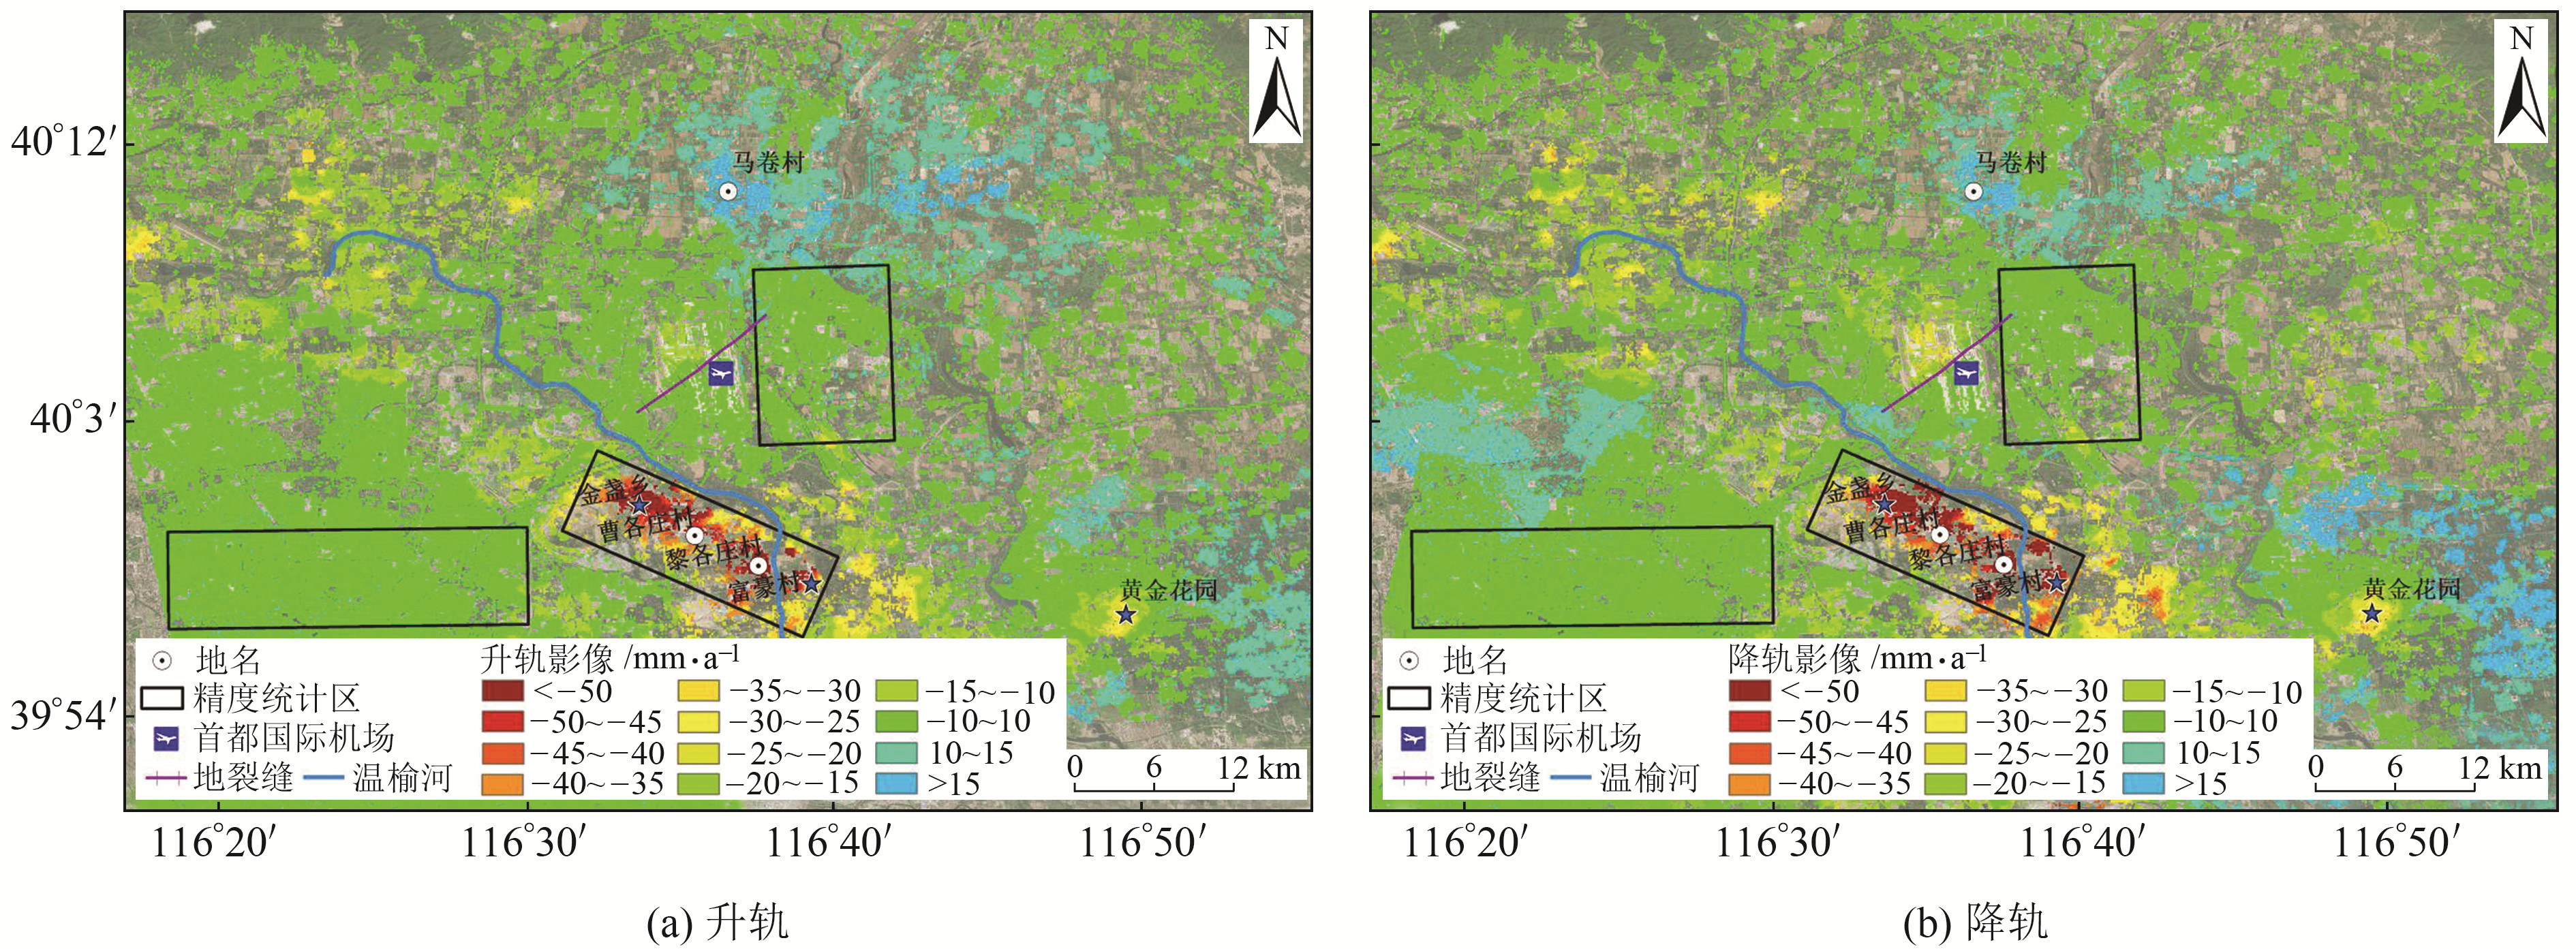
处理得到2017-05~2021-12北京首都国际机场周边区域Sentinel-1升降轨影像雷达视线(LOS)向形变速率。根据影像入射角,利用式(7)将LOS向形变速率转至垂直向[13],如图 2所示,图中正值表示地面抬升,负值表示地面沉降:
| $ \Delta d_{\text {vertical }}=\Delta R / \cos \theta $ | (7) |

|
图 2 北京首都国际机场周边地表垂向形变速率 Fig. 2 Velocity of vertical surface deformation around Beijing capital international airport |
式中,Δdvertical为垂直向形变量,ΔR为LOS向形变量,θ为雷达视线入射角。
由图 2可知,Sentinel-1升降轨影像监测结果的一致性较好,沉降主要发生在北京首都国际机场南部温榆河以南区域,其中金盏乡、曹各庄村、黎各庄村及富豪村附近沉降较严重,最大沉降速率超过40 mm/a;机场东南部黄金花园小区附近也形成一个小型沉降漏斗,最大沉降速率超过25 mm/a,地下水过量抽取是引起该区域地面沉降的主要原因[14-15];机场北部马卷村附近区域地表处于抬升状态,最大抬升速率超过15 mm/a;其余大部分区域形变速度在±10 mm/a之间,相对稳定。
3.2 内符合精度验证由于未收集到监测时段内的外部监测数据,无法对InSAR监测结果进行外符合精度评定,而Sentinel-1升降轨影像的时间范围基本一致,故对基于升降轨影像得到的垂直向形变速率结果进行内符合精度评定[16]。在研究区同名像元点上,利用Sentinel-1降轨影像垂直向形变速率减去升轨影像垂直向形变速率,获得同名像元点上垂直向形变速率差值,统计该差值并绘制直方图。
由于研究区监测结果的像元过多,选取3个典型区域(图 2黑色方框)进行验证,Sentinel-1升降轨影像垂直向形变速率差值统计结果如图 3所示。结果表明,90%以上公共像元的垂直向形变速率差在±10 mm/a之间,3个典型区域的形变速率差值标准差分别为2.6 mm/a、5.4 mm/a和1.5 mm/a,表明升降轨影像形变监测结果的内符合精度较好。

|
图 3 SAR影像的形变差值统计 Fig. 3 Statistics of deformation differences of SAR images |
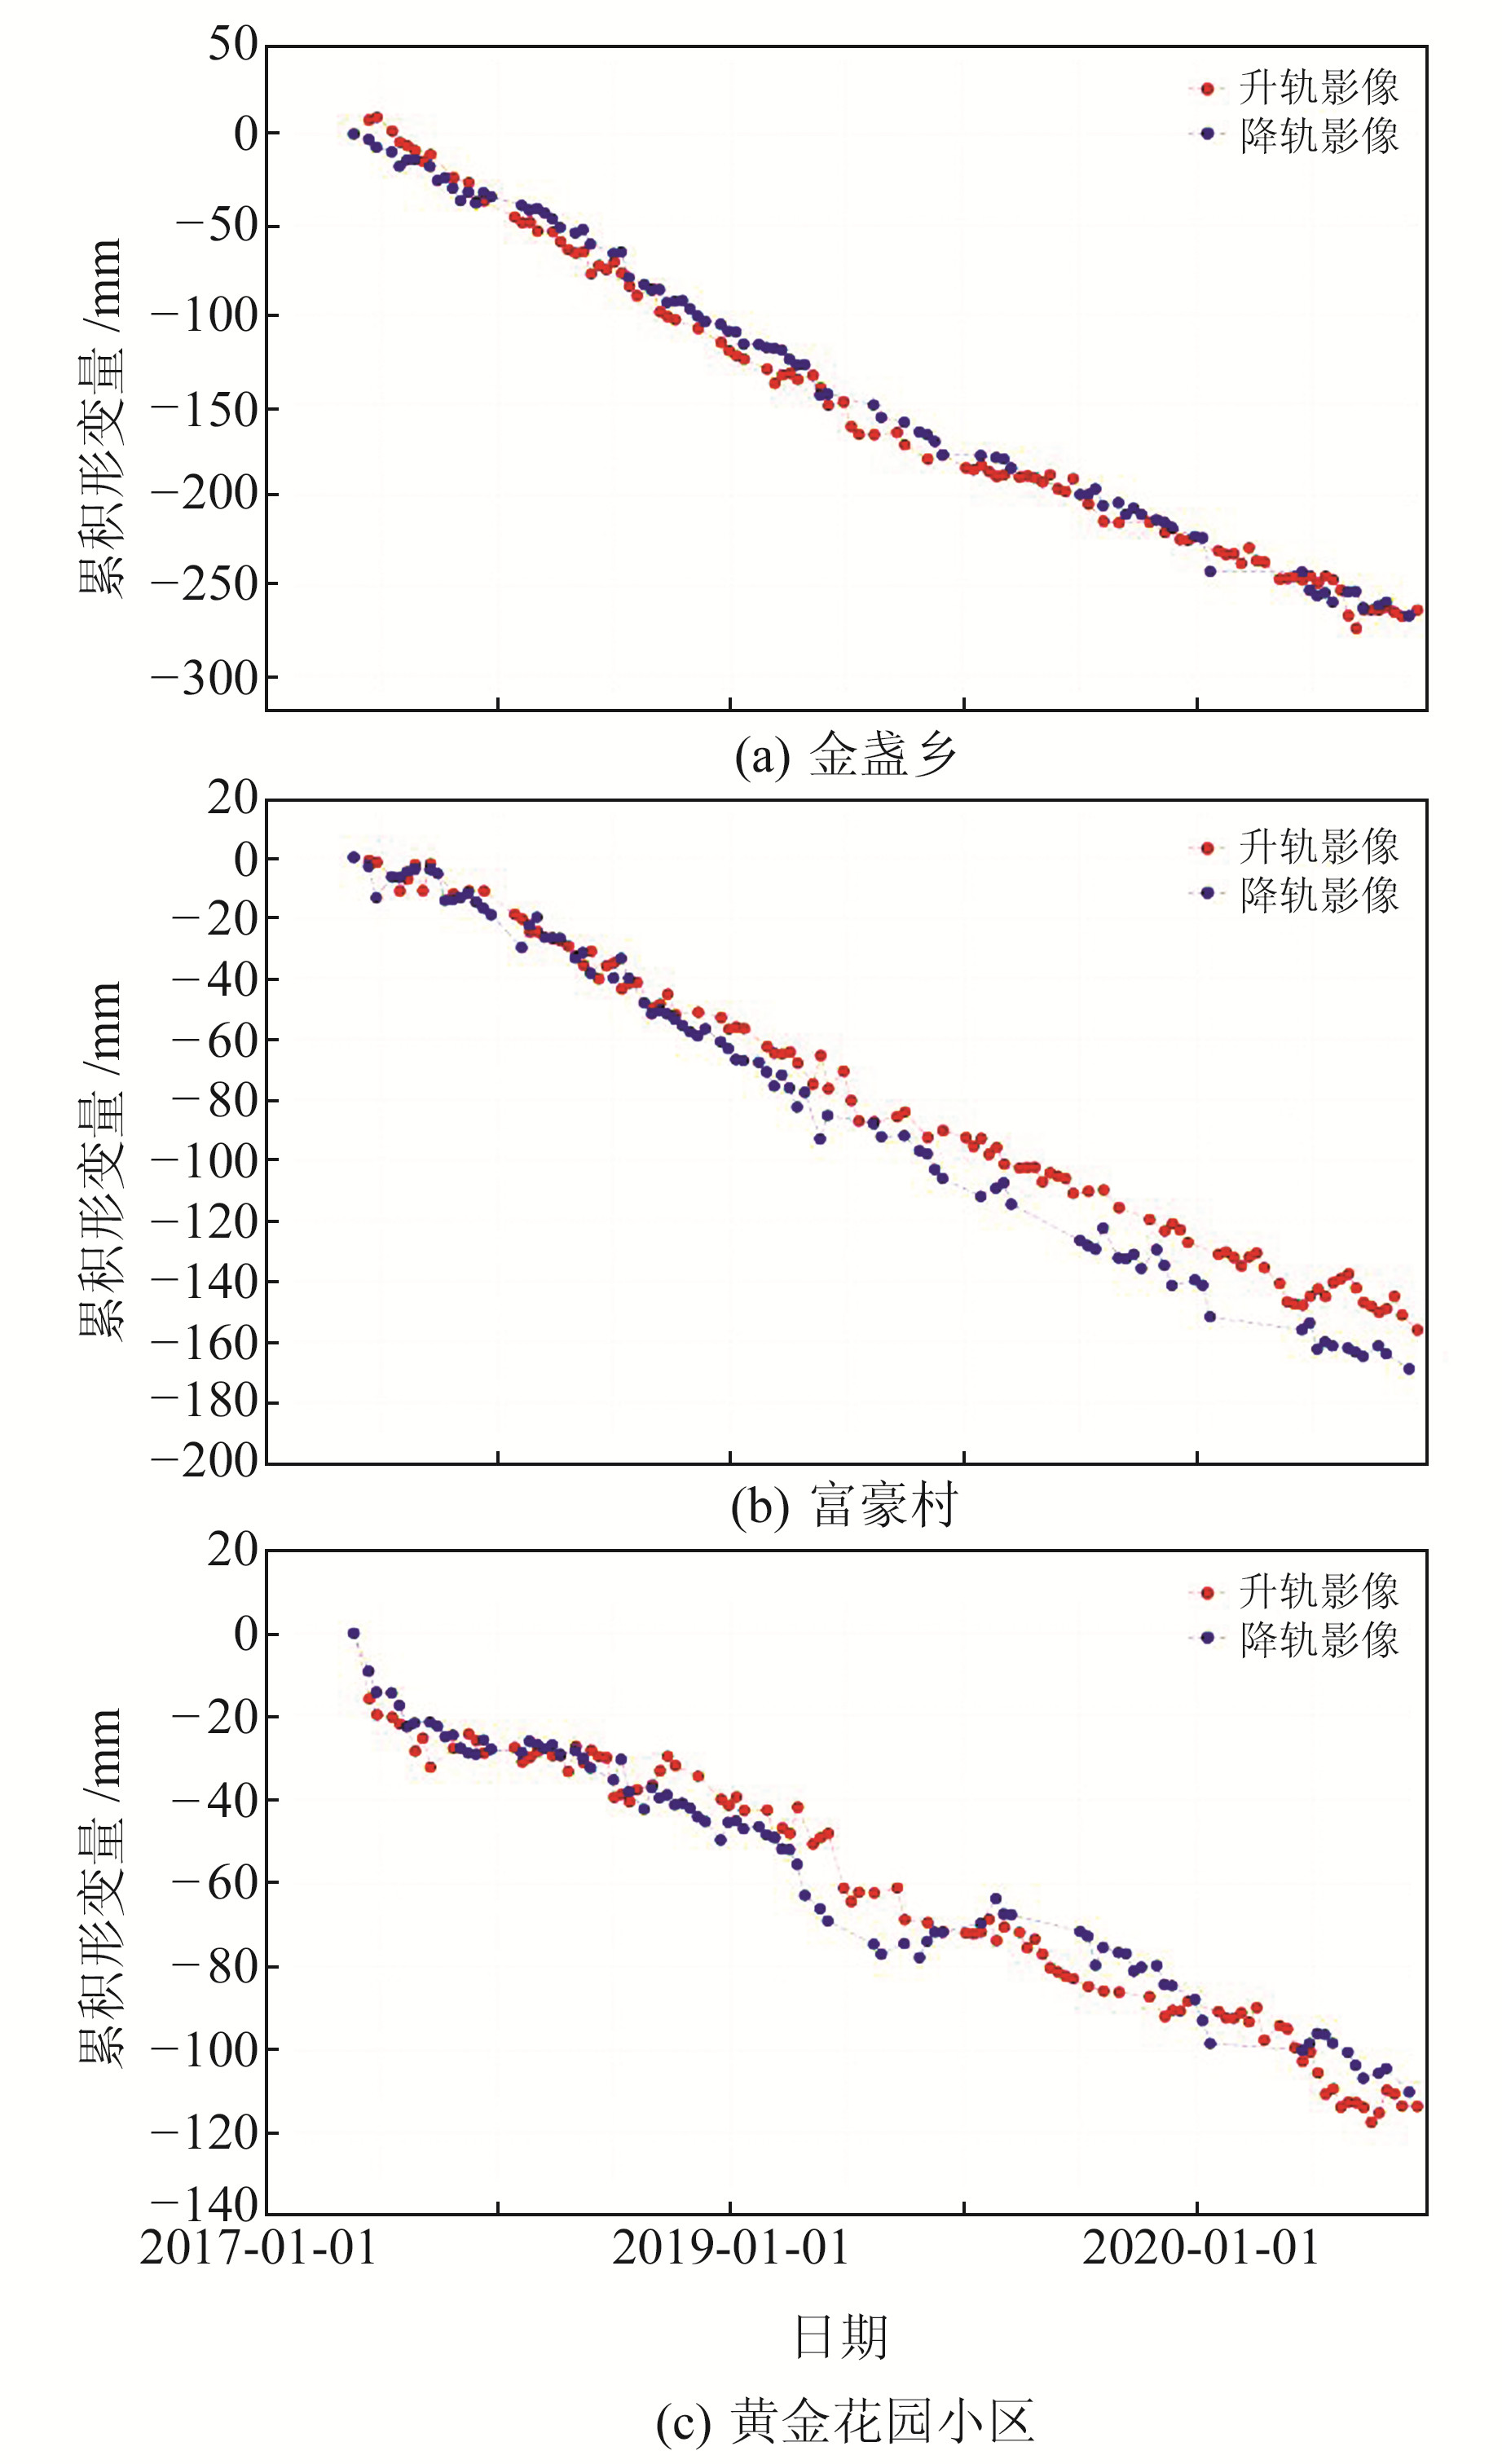
基于InSAR监测结果,提取3个典型区域(图 2蓝色五角星,分别位于金盏乡、富豪村及黄金花园小区)的时序分布。从图 4可以看出,基于Sentinel-1升降轨影像监测结果提取的时序分布较一致,其中金盏乡和富豪村位于北京首都国际机场南部温榆河附近的沉降漏斗中,两地均发生了较严重的沉降,富豪村最大累积沉降量超过150 mm,金盏乡最大累积沉降量超过250 mm;黄金花园小区最大累积沉降量超过110 mm。值得注意的是,基于3个典型区域提取的时序结果整体呈线性变化趋势。

|
图 4 典型形变区的时序结果 Fig. 4 Time series results of typical deformation regions |
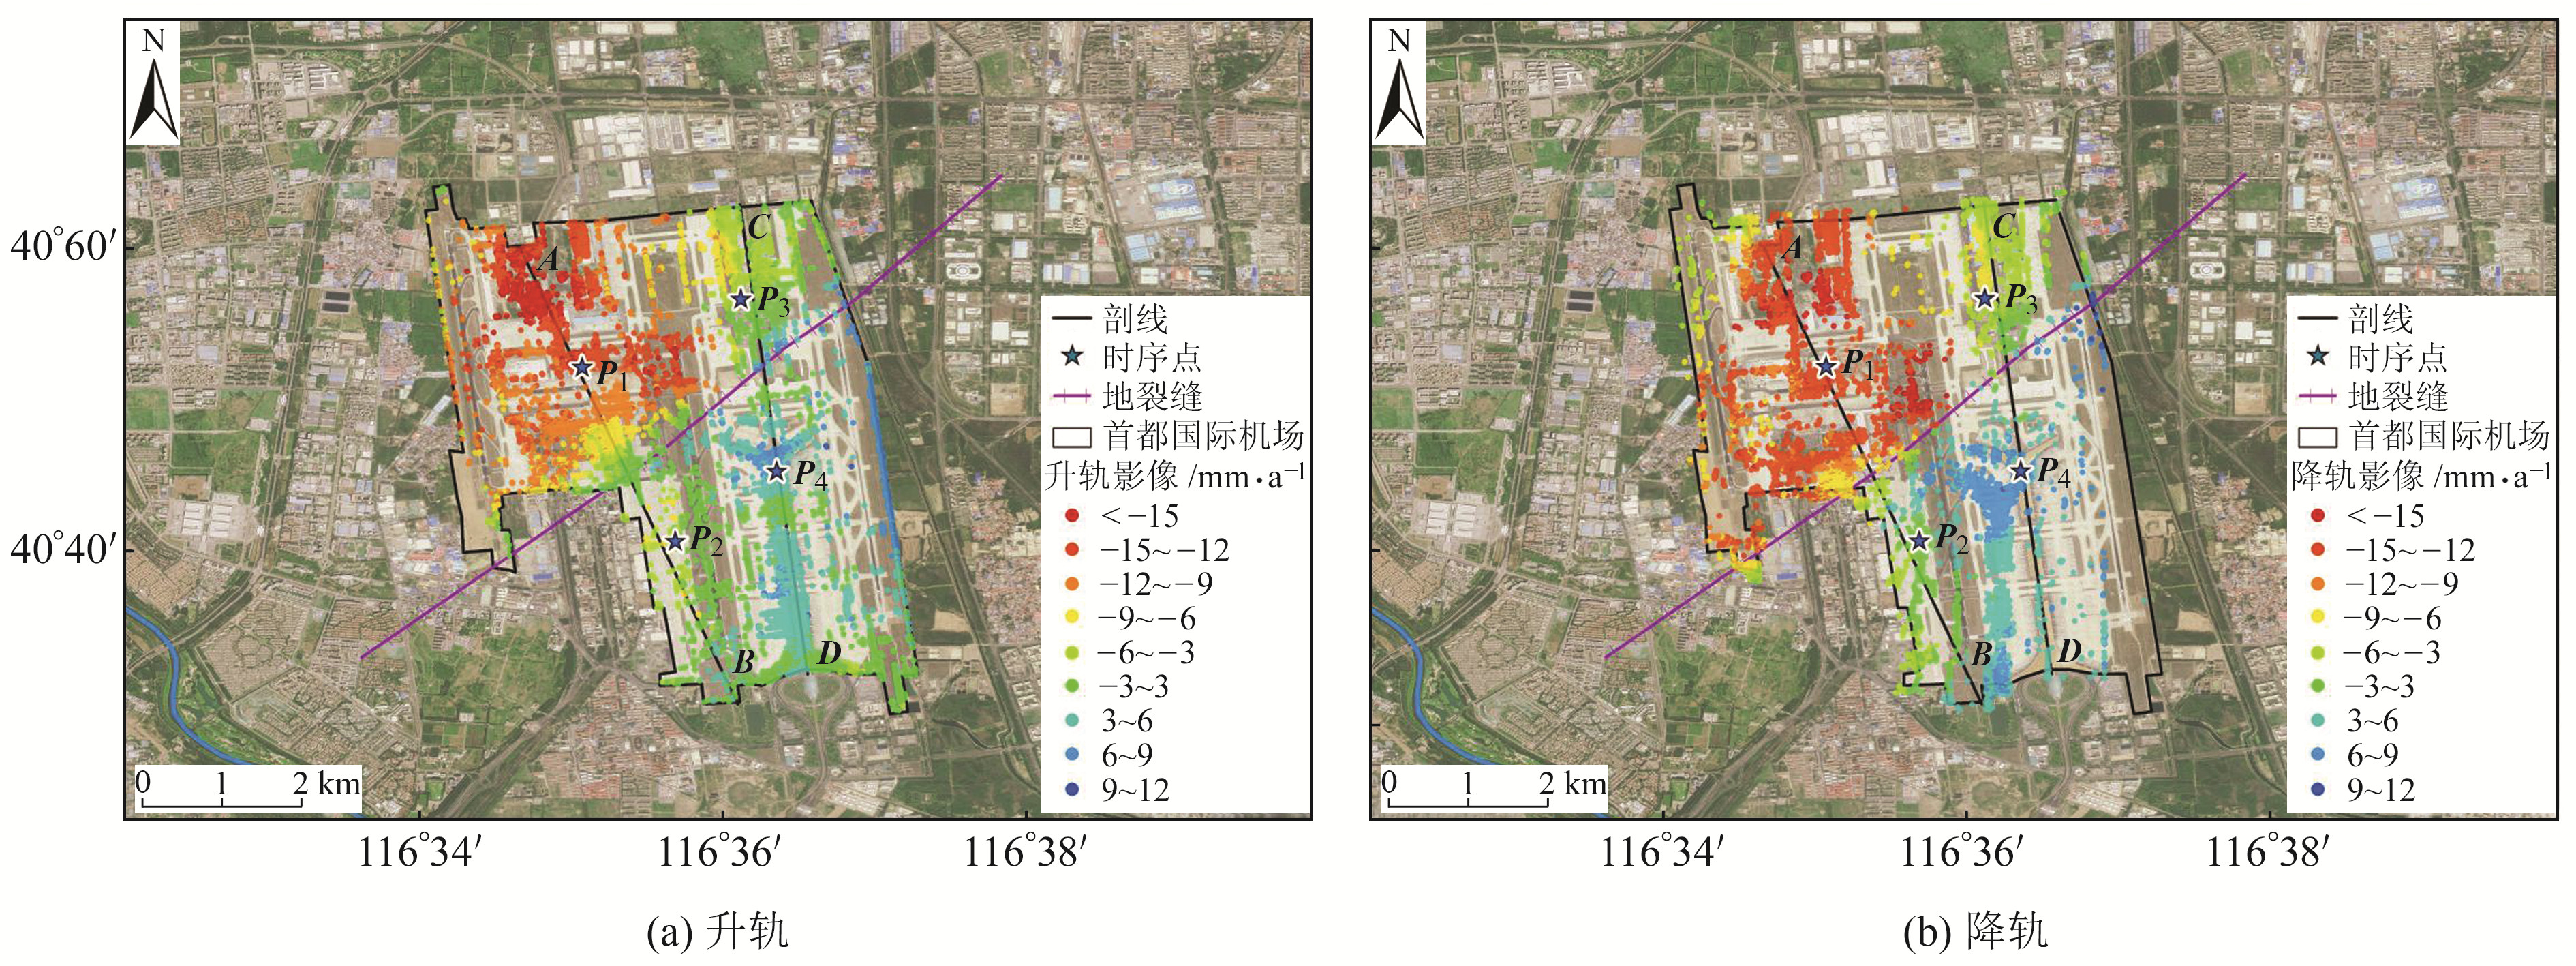
由于北京首都国际机场区域整体形变速率较小,将机场区域范围的监测结果重新着色,得到机场区域垂直向形变速率(图 5)和累积形变结果(图 6),图中紫色长线为顺义地裂缝。从图 5和6可以看出,地裂缝北侧机场区域大部分处于沉降状态,沉降速率达9 mm/a,局部超过15 mm/a;而地裂缝南侧机场区域大部分处于抬升状态,抬升速率超过6 mm/a,局部达10 mm/a。对比前人研究成果[10-11]可知,近5 a北京首都国际机场区域内的沉降速率显著降低。

|
图 5 北京首都国际机场的垂向年均形变速率 Fig. 5 Annual vertical deformation rate of Beijing capital international airport |

|
图 6 北京首都国际机场的累积形变量 Fig. 6 Cumulative deformation of Beijing capital international airport |
虽然北京首都国际机场区域整体年均形变速率和累积形变量均较小,但地裂缝两侧地面的差异形变较为明显,且差异分界线与地裂缝位置比较吻合。研究表明,机场地区的沉降受顺义地面沉降和顺义-良乡断裂共同影响[17],地下水的过量开采导致土层持续固结,诱发地表的不均匀沉降,加剧机场附近地裂缝的发育,导致机场内部出现不均匀沉降。地裂缝是造成机场区域出现差异性沉降的主要原因[18]。
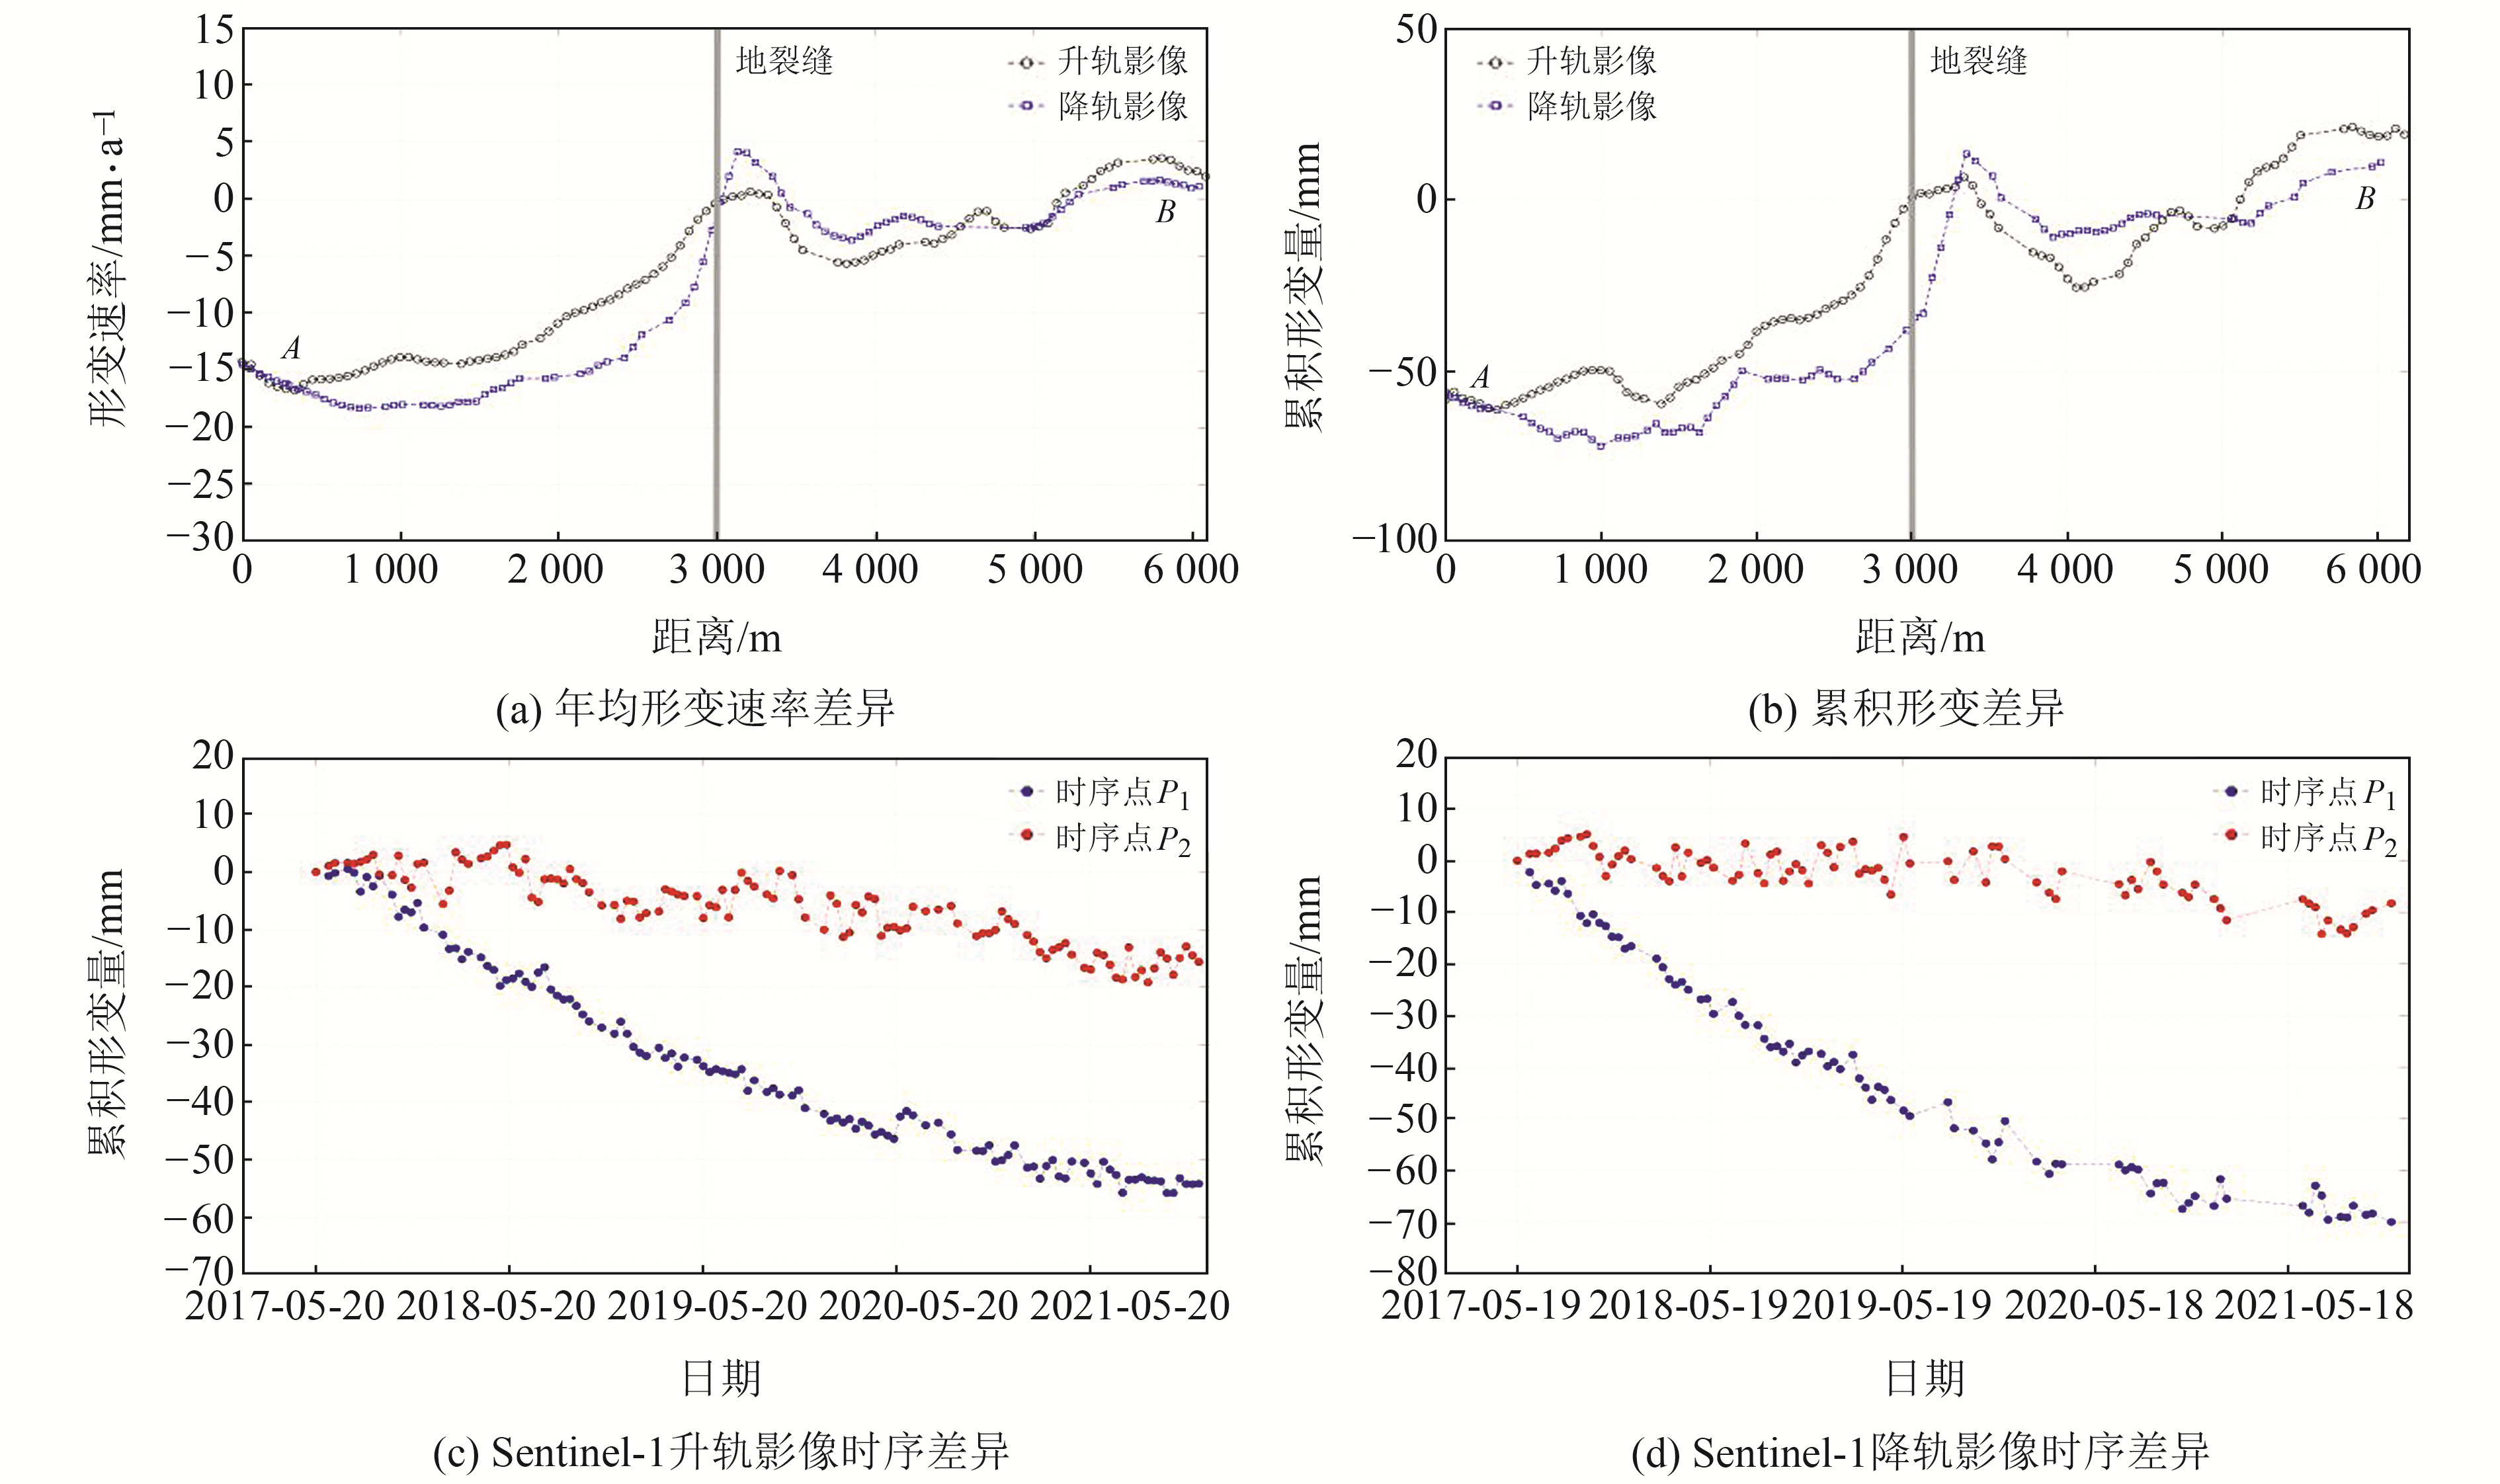
3.5 机场地裂缝两侧形变差异分析为分析机场内的差异形变,提取地裂缝两侧时序及剖线分布,时序点位置见图 5蓝色五角星,剖线位置见图 6黑色实线,结果如图 7和8所示。从地裂缝两侧剖线结果(图 7(a)和7(b)、图 8(a)和8(b))可以看出,剖线AB北侧地面处于沉降状态,南侧地面相对较稳定,两侧形变速率差最大达15 mm/a;剖线CD北侧地面处于沉降状态,南侧地面处于抬升状态,两侧形变速率差最大达10 mm/a。从地裂缝两侧时序结果(图 7(c)和7(d)、图 8(a)和8(d)) 可以看出,位于地裂缝北侧的时序点P1附近地表处于沉降状态,地裂缝南侧的时序点P2附近地表相对较稳定,2个时序点的最大累积形变量差超过30 mm;位于地裂缝北侧的时序点P3附近地表处于沉降状态,南侧时序点P4附近地表处于抬升状态,2个时序点的最大累积形变量差超过60 mm。

|
图 7 剖线AB两侧形变差异 Fig. 7 Deformation difference on both sides of section line AB |

|
图 8 剖线CD两侧形变差异 Fig. 8 Deformation difference on both sides of section line CD |
从剖线结果可以看出,以地裂缝为界,虽然两侧地表的年均形变速率和累积形变量均较小,但差异较为明显。值得注意的是,从时序结果可以看出,4个时序点的变化趋势都是先急后缓,形变主要发生在2020年之前,即2017~2019年;2020~2021年形变变缓。由此推断,北京首都国际机场区域内沉降速率有逐年减缓的趋势。
4 结语本文利用时序InSAR技术对北京首都国际机场附近区域2017~2021年地表形变进行监测。结果表明,北京首都国际机场南部温榆河以南区域地表沉降较严重,最大沉降速率超过40 mm/a,沉降区沿温榆河分布。分析机场区域范围的监测结果及地裂缝两侧的差异形变发现,地裂缝两侧仍存在明显的差异形变,且差异分界线与地裂缝位置基本一致,由此认为地裂缝是造成机场地区出现不均匀沉降的主要原因,地裂缝的活动值得持续关注。地下水开采是影响该地区地面沉降的关键因素,后续应考虑收集与Sentinel-1影像同时段的地下水数据,分析区域地面沉降与地下水位的关系,以对该地区地面沉降的具体原因进行解译分析。
| [1] |
朱建军, 李志伟, 胡俊. InSAR变形监测方法与研究进展[J]. 测绘学报, 2017, 46(10): 1 717-1 733 (Zhu Jianjun, Li Zhiwei, Hu Jun. Research Progress and Methods of InSAR for Deformation Monitoring[J]. Acta Geodaetica et Cartographica Sinica, 2017, 46(10): 1 717-1 733)
(  0) 0) |
| [2] |
An B, Jiang Y N, Wang C C, et al. Ground Infrastructure Monitoring in Coastal Areas Using Time-Series InSAR Technology: The Case Study of Pudong International Airport, Shanghai[J]. International Journal of Digital Earth, 2023, 16(1)
(  0) 0) |
| [3] |
陈毅, 何毅, 张立峰, 等. 长短时记忆网络TS-InSAR地表形变预测[J]. 遥感学报, 2022, 26(7): 1 326-1 341 (Chen Yi, He Yi, Zhang Lifeng, et al. Surface Deformation Prediction Based on TS-InSAR Technology and Long Short-Term Memory Networks[J]. National Remote Sensing Bulletin, 2022, 26(7): 1 326-1 341)
(  0) 0) |
| [4] |
杨成生, 张勤, 赵超英, 等. 短基线集InSAR技术用于大同盆地地面沉降、地裂缝及断裂活动监测[J]. 武汉大学学报: 信息科学版, 2014, 39(8): 945-950 (Yang Chengsheng, Zhang Qin, Zhao Chaoying, et al. Small Baseline Bubset InSAR Technology Used in Datong Basin Ground Subsidence, Fissure and Fault Zone Monitoring[J]. Geomatics and Information Science of Wuhan University, 2014, 39(8): 945-950)
(  0) 0) |
| [5] |
孙月敏, 杨天亮, 卢全中, 等. 基于SBAS-InSAR的西安市鱼化寨地区地面沉降与地裂缝时空演变特征研究[J]. 工程地质学报, 2022, 30(2): 553-564 (Sun Yuemin, Yang Tianliang, Lu Quanzhong, et al. Spatial-Temporal Evolution Characteristics of Land Subsidence and Ground Fissure in Yuhua Village of Xi'an City Using SBAS-InSAR Technique[J]. Journal of Engineering Geology, 2022, 30(2): 553-564)
(  0) 0) |
| [6] |
Gao M L, Gong H L, Li X J, et al. Land Subsidence and Ground Fissures in Beijing Capital International Airport(BCIA): Evidence from Quasi-PS InSAR Analysis[J]. Remote Sensing, 2019, 11(12): 1 466 DOI:10.3390/rs11121466
(  0) 0) |
| [7] |
何亚乐, 朱琳, 宫辉力, 等. TerraSAR的首都机场形变特征分析[J]. 测绘科学, 2016, 41(12): 14-18 (He Yale, Zhu Lin, Gong Huili, et al. Analysis of Land Subsidence Features Based on TerraSAR Images in Beijing-Capital International Airport[J]. Science of Surveying and Mapping, 2016, 41(12): 14-18)
(  0) 0) |
| [8] |
Hooper A, Zebker H, Segall P, et al. A New Method for Measuring Deformation on Volcanoes and other Natural Terrains Using InSAR Persistent Scatterers[J]. Geophysical Research Letters, 2004, 31(23)
(  0) 0) |
| [9] |
Liu Y L, Liu J Q, Xia X F, et al. Land Subsidence of the Yellow River Delta in China Driven by River Sediment Compaction[J]. Science of the Total Environment, 2021, 750: 142 165
(  0) 0) |
| [10] |
Zhou Z K, Yao X, Ren K Y, et al. Formation Mechanism of Ground Fissure at Beijing Capital International Airport Revealed by High-Resolution InSAR and Numerical Modelling[J]. Engineering Geology, 2022, 306: 106 775
(  0) 0) |
| [11] |
Dai K R, Shi X L, Gou J S, et al. Diagnosing Subsidence Geohazard at Beijing Capital International Airport, from High-Resolution SAR Interferometry[J]. Sustainability, 2020, 12(6): 2 269
(  0) 0) |
| [12] |
吴文豪, 周志伟, 李陶, 等. 精密轨道支持下的哨兵卫星TOPS模式干涉处理[J]. 测绘学报, 2017, 46(9): 1 156-1 164 (Wu Wenhao, Zhou Zhiwei, Li Tao, et al. A Study of Sentinel-1 TOPS Mode Co-Registration[J]. Acta Geodaetica et Cartographica Sinica, 2017, 46(9): 1 156-1 164)
(  0) 0) |
| [13] |
Qu F F, Zhang Q, Lu Z, et al. Land Subsidence and Ground Fissures in Xi'an, China 2005-2012 Revealed by Multi-Band InSAR Time-Series Analysis[J]. Remote Sensing of Environment, 2014, 155: 366-376
(  0) 0) |
| [14] |
Zhou C D, Lan H X, Gong H L, et al. Reduced Rate of Land Subsidence since 2016 in Beijing, China: Evidence from Tomo-PS InSAR Using Radar SAT-2 and Sentinel-1 Datasets[J]. International Journal of Remote Sensing, 2020, 41(4): 1 259-1 285
(  0) 0) |
| [15] |
Guo L, Gong H L, Zhu F, et al. Analysis of the Spatiotemporal Variation in Land Subsidence on the Beijing Plain, China[J]. Remote Sensing, 2019, 11(10): 1 170
(  0) 0) |
| [16] |
张帆. 运城盆地地裂缝活动时序InSAR监测与机理分析[D]. 西安: 长安大学, 2019 (Zhang Fan. Monitoring of Ground Fissure Activity in Yuncheng Basin by Time Series InSAR and Mechanism Analysis[D]. Xi'an: Chang'an University, 2019)
(  0) 0) |
| [17] |
杜建涛. InSAR技术用于张家口地区不同尺度形变监测[D]. 西安: 长安大学, 2020 (Du Jiantao. Different-Scale Surface Deformation Monitoring in Zhangjiakou with InSAR Technology[D]. Xi'an: Chang'an University, 2020)
(  0) 0) |
| [18] |
关金环, 高明亮, 宫辉力. 首都国际机场区域差异性沉降原因探讨[J]. 测绘科学, 2021, 46(9): 67-75 (Guan Jinhuan, Gao Mingliang, Gong Huili. Discussion on the Causes of Regional Differential Settlement of Beijing-Capital International Airport[J]. Science of Surveying and Mapping, 2021, 46(9): 67-75)
(  0) 0) |
2. Key Laboratory of Earth Fissures Geological Disaster, MNR, 700 Zhujiang Road, Nanjing 210004, China;
3. Key Laboratory of Mineral Resources and Geological Engineering in Western China, Ministry of Education, 126 Yanta Road, Xi'an 710054, China
 2024, Vol. 44


