2. 赣东学院,江西省抚州市学府路56号,344100;
3. 攀枝花学院土木与建筑工程学院,四川省攀枝花市三线大道北段10号,617000
利用GNSS连续跟踪站数据解算的多年数据坐标可进行诸如海平面变化[1]、地壳形变[2]、陆地水储量变化[3]等地球物理现象研究。受卫星轨道误差、解算误差以及人为误差等因素的影响,GNSS坐标时间序列中不可避免地含有异常值。已有研究表明,异常值的存在会严重影响GNSS坐标时间序列的形变参数估计及噪声分析[4],进而影响形变监测信号的提取,因此异常值探测一直是GNSS坐标时间序列分析研究的重点和热点之一。Mao等[5]、吴浩等[6]利用测量数据处理中常用的3σ准则进行异常值探测,将大于3倍标准差的残差标记为异常值并将其剔除;Nikolaidis[7]、Bos等[8]利用四分位距统计量代替3σ统计量进行异常值识别,虽然该方法更具稳健性,但只适用于离散度较小的观测数据,离散度较大数据序列的四分位间距也会随之变大,导致其对异常值的敏感性大幅降低[9];Bilen等[10]、Rizzo等[11]、徐洪钟等[12]结合小波分析理论提出多种小波异常值探测算法,基于小波变换后的小波系数模极大值将异常值探测转换为突变点检测。但由于小波变换后的信号具有奇异性,上述算法效率不高且需要人工干预。
目前常用谐波模型描述GNSS坐标时间序列,认为GNSS坐标时间序列是由线性信号、周年和半周年信号、观测噪声3部分组成[13-16]。从数学角度看,谐波模型本质上是Gauss-Markov模型,可基于传统数理统计方法进行异常值探测。然而GNSS时间序列的观测数据和异常值数量均较多,经典DIA算法耗时较长。针对上述问题,Amiri-Simkooei等[17]基于矩阵反演原理推导出一种计算效率更高的迭代DIA探测算法;方兴等[18]基于矩阵反演原理提出一种高效率的抗差估计算法,并将其用于水准网数据处理中。本文将经典DIA理论引入GNSS坐标时间序列分析中,分别采用经典DIA算法和改进DIA算法进行异常值探测,利用模拟数据和实测数据比较DIA算法和经典3σ算法的性能。
1 GNSS坐标时间序列的函数模型和随机模型已有研究表明,GNSS坐标时间序列中含有丰富的地球物理信号,主要包含线性信号、季节性信号和噪声3部分。其中线性信号主要表现为站点的运动速度,反映在区域(全球)站点上则称为区域(全球)速度场;季节性信号主要由重力激发、环境负载、热效应及GNSS系统误差等因素导致。目前常用谐波模型来描述GNSS坐标时间序列,其数学模型为:
| $ \begin{array}{c} y\left(t_i\right)=y_0+v t_i+\sum\limits_{i=1}^2\left[a_i \sin \left(2 \pi t_i\right)+\right. \\ \left.b_i \cos \left(2 \pi t_i\right)\right]+e\left(t_i\right), 1 \leqslant i \leqslant m \end{array} $ | (1) |
式中,y(ti)和e(ti)分别为ti时刻的坐标及其观测误差,y0和v分别为测站初始位置和运动速度,ai和bi分别为年周期和半年周期振幅因子,m为观测个数。若顾及所有历元,则可将式(1)改写为矩阵形式:
| $ \boldsymbol{y}=\boldsymbol{A x}+\boldsymbol{e} $ | (2) |
式中,
| $ \begin{array}{l} \boldsymbol{A}=\left[\begin{array}{cccccc} 1 & t_1 & \sin \left(2 \pi t_1\right) & \cos \left(2 \pi t_1\right) & \sin \left(4 \pi t_1\right) & \cos \left(4 \pi t_1\right) \\ 1 & t_2 & \sin \left(2 \pi t_2\right) & \cos \left(2 \pi t_2\right) & \sin \left(4 \pi t_2\right) & \cos \left(4 \pi t_2\right) \\ \vdots & \vdots & \vdots & \vdots & \vdots & \vdots \\ 1 & t_m & \sin \left(2 \pi t_m\right) & \cos \left(2 \pi t_m\right) & \sin \left(4 \pi t_m\right) & \cos \left(4 \pi t_m\right) \end{array}\right] \\ \boldsymbol{y}=\left[\begin{array}{llll} y\left(t_1\right) & y\left(t_2\right) & \cdots & y\left(t_m\right) \end{array}\right]^{\mathrm{T}} \quad \boldsymbol{e}=\left[\begin{array}{llll} e\left(t_1\right) & e\left(t_2\right) & \cdots & e\left(t_m\right) \end{array}\right]^{\mathrm{T}} \\ \boldsymbol{x}=\left[\begin{array}{llllll} y_0 & v & a_1 & b_1 & a_2 & b_2 \end{array}\right]^{\mathrm{T}} \\ \end{array} $ | (3) |
式(2)的最小二乘估值为:
| $ \hat{\boldsymbol{x}}=\left(\boldsymbol{A}^{\mathrm{T}} \boldsymbol{\varSigma}_y^{-1} \boldsymbol{A}\right)^{-1}\left(\boldsymbol{A}^{\mathrm{T}} \boldsymbol{\varSigma}_y^{-1} \boldsymbol{y}\right) $ | (4) |
式中,Σy为观测值的协方差矩阵。
2 基于DIA的GNSS坐标时间序列异常值探测 2.1 传统DIA方法传统DIA方法也被称为序贯data-snooping方法,主要包含3个步骤:探测、诊断和调节[19],探测阶段是指对模型进行总体检验。将式(4)代入式(2)可得残差:
| $ \hat{\boldsymbol{e}}=\boldsymbol{P}_A^{\perp} \boldsymbol{y} $ | (5) |
式中,
| $ T=\hat{\boldsymbol{e}}^{\mathrm{T}} \boldsymbol{\varSigma}_y^{-1} \hat{\boldsymbol{e}} $ | (6) |
根据二次型分布定理可知,统计量T服从自由度为(m-n)的χ2分布。零假设和备选假设可选为:
| $ H_0: T \sim \chi^2(m-n, 0) \text { vs. } \;\;H_1: \chi^2(m-n, \lambda) $ | (7) |
利用式(6)对观测数据和线性模型的差异进行检验。若零假设未通过检验,则表明模型不正确或观测数据中存在粗差,此时应对观测数据作进一步识别。根据误差传播定律,残差估值的协方差矩阵为:
| $ \boldsymbol{\varSigma}_{\hat{e}}=\boldsymbol{\varSigma}_y-\boldsymbol{A}\left(\boldsymbol{A}^{\mathrm{T}} \boldsymbol{\varSigma}_y^{-1} \boldsymbol{A}\right)^{-1} \boldsymbol{A}^{\mathrm{T}}=\boldsymbol{P}_{\mathrm{A}}^{\perp} \boldsymbol{\varSigma}_y $ | (8) |
构造w-test统计量:
| $ w_i=\frac{\boldsymbol{c}_i^{\mathrm{T}} \boldsymbol{\varSigma}_y^{-1} \hat{\boldsymbol{e}}}{\sqrt{\boldsymbol{c}_i^{\mathrm{T}} \boldsymbol{\varSigma}_y^{-1} \boldsymbol{\varSigma}_{\hat{e}} \boldsymbol{\varSigma}_y^{-1} \boldsymbol{c}_i}} $ | (9) |
式中,ci=[0 ⋯ 0 1 0 ⋯ 0]T为第i个位置为1、其余为0的行向量。若Σy为对角矩阵,则式(9)可简化为:
| $ w_i=\frac{\hat{\boldsymbol{e}}_i}{\sqrt{\left(\boldsymbol{\varSigma}_{\hat{e}}\right)_{i i}}}=\frac{\hat{\boldsymbol{e}}_i}{\sqrt{\sigma_{\hat{e}_i}}} $ | (10) |
若观测值中无粗差,则wi统计量服从标准正态分布,可构建如下假设:
| $ H_0: w \sim N(0, 1) \text { vs. }\; H_1: w \sim N(\nabla w, 1) $ | (11) |
若零假设被拒绝,则表明观测值中存在粗差,此时应进行调整,即该观测值对应的系数矩阵相关行及观测值的方差矩阵对应行列应被删除,并重新进行平差处理。对更新后的残差及其协方差矩阵重新进行模型的全局性检验,反复迭代,直至模型通过检验。
2.2 改进的DIA方法由于传统DIA方法在识别阶段每识别一个粗差,均需要在调整阶段重构系数矩阵和观测值,其法矩阵也需要重新求逆,因此当观测值及粗差个数较多时,该算法的时间复杂度较高。Amiri-Simkooei等[17]基于矩阵反演原理推导出一种计算效率更高的迭代DIA探测算法,该算法在DIA的调整阶段进行重构,在保持估值不变的同时能显著提升算法效率。假设第m个观测值被识别为粗差,则系数阵A可改写为:
| $ \boldsymbol{A}=\left[\begin{array}{c} \boldsymbol{A}_{m-1} \\ \boldsymbol{a}_m^{\mathrm{T}} \end{array}\right], \boldsymbol{\varSigma}_y=\left[\begin{array}{cc} \boldsymbol{\varSigma}_{y_{m-1}} & 0 \\ 0 & \sigma_m^2 \end{array}\right], \boldsymbol{y}=\left[\begin{array}{c} y_{m-1} \\ y_m \end{array}\right] $ | (12) |
若移除第m个观测值的影响,则最小二乘估值为:
| $ \hat{\boldsymbol{x}}_{m-1}=\left(\boldsymbol{A}_{m-1}^{\mathrm{T}} \boldsymbol{\varSigma}_{y_{m-1}}^{-1} \boldsymbol{A}_{m-1}\right)^{-1} \boldsymbol{A}_{m-1}^{\mathrm{T}} \boldsymbol{\varSigma}_{y_{m-1}}^{-1} \boldsymbol{y}_{m-1} $ | (13) |
其残差及相应的协方差矩阵为:
| $ \left\{\begin{array}{l} \hat{\boldsymbol{e}}_{m-1}=\boldsymbol{y}_{m-1}-\boldsymbol{A}_{m-1} \hat{\boldsymbol{x}}_{m-1} \\ \boldsymbol{\varSigma}_{\hat{e}_{m-1}}=\boldsymbol{\varSigma}_{y_{m-1}}-\boldsymbol{A}_{m-1}\left(\boldsymbol{A}_{m-1}^{\mathrm{T}} \boldsymbol{\varSigma}_{y_{m-1}}^{-1} \boldsymbol{A}_{m-1}\right)^{-1} \boldsymbol{A}_{m-1}^{\mathrm{T}} \end{array}\right. $ | (14) |
将式(13)重写为:
| $ \hat{\boldsymbol{x}}_{m-1}=\boldsymbol{N}_{m-1}^{-1} \boldsymbol{u}_{m-1} $ | (15) |
式中,
| $ \left\{\begin{array}{l} \boldsymbol{N}_{m-1}=\boldsymbol{A}_{m-1}^{\mathrm{T}} \boldsymbol{\varSigma}_{y_{m-1}}^{-1} \boldsymbol{A}_{m-1}=\boldsymbol{N}-\sigma_m^{-2} \boldsymbol{a}_m \boldsymbol{a}_m^{\mathrm{T}} \\ \boldsymbol{u}_{m-1}=\boldsymbol{A}_{m-1}^{\mathrm{T}} \boldsymbol{\varSigma}_{y_{m-1}}^{-1} \boldsymbol{y}_{m-1}=\boldsymbol{u}-\sigma_m^{-2} \boldsymbol{y}_m \boldsymbol{a}_m \\ \boldsymbol{u}=\boldsymbol{A}^{\mathrm{T}} \boldsymbol{\varSigma}_y^{-1} \boldsymbol{y} \end{array}\right. $ | (16) |
若直接对Nm-1求逆,则运算量较大。由矩阵反演公式[17]可得:
| $ \begin{array}{c} \boldsymbol{N}_{m-1}^{-1}=\left(\boldsymbol{N}-\sigma_m^{-2} \boldsymbol{a}_m \boldsymbol{a}_m^{\mathrm{T}}\right)^{-1}= \\ \boldsymbol{N}^{-1}+\frac{\sigma_m^{-2}}{1-\sigma_m^{-2} \boldsymbol{a}_m^{\mathrm{T}} \boldsymbol{N}^{-1} \boldsymbol{a}_m} \boldsymbol{N}^{-1} \boldsymbol{a}_m \boldsymbol{a}_m^{\mathrm{T}} \boldsymbol{N}^{-1} \end{array} $ | (17) |
顾及式(15),经推导可得:
| $ \hat{\boldsymbol{x}}_{m-1}=\hat{\boldsymbol{x}}-\sigma_m^{-2}\left(1-f_1 \sigma_m^{-2}\right)^{-1}\left(\boldsymbol{y}_m-f_2\right) \boldsymbol{N}^{-1} \boldsymbol{a}_m $ | (18) |
式中,
| $ f_1=\boldsymbol{a}_m^{\mathrm{T}} \boldsymbol{N}^{-1} \boldsymbol{a}_m, f_2=\boldsymbol{a}_m^{\mathrm{T}} \boldsymbol{N}^{-1} \boldsymbol{u} $ | (19) |
由此可知,式(18)与式(13)完全等价,但二者计算效率差异较大。在调整阶段,式(13)均需对法矩阵
为验证算法的有效性,选取CMONOC一期工程27个实测GNSS基准站坐标时间序列进行分析,数据可在中国地壳运动观测网络GNSS数据共享服务中心(http://www.cgps.ac.cn/)下载。选取BJFS站进行分析,其时间序列见图 1。利用谐波模型估计模型参数时,需已知时间序列的噪声模型。本文采用白噪声+闪烁噪声组合模型,使用最小二乘方差分量估计LS_VCE噪声振幅。表 1(单位mm)为BJFS站3个方向上的白噪声与闪烁噪声方差分量估值。由表可见,GNSS坐标时间序列中的噪声主要为有色噪声,且高程方向噪声振幅明显高于水平方向[14, 16]。分别采用3σ法、传统DIA法以及改进DIA法进行异常值探测,图 2为剔除异常值后的时间序列。由图可见,3σ法探测的异常值比例较低,剔除后的时间序列中仍含有较为明显的异常值;传统DIA法和改进DIA法能够探测出更多的异常值,剔除后的时间序列中几乎没有明显的异常值,二者探测结果完全等价。为比较2种DIA算法的计算效率,采用MATLAB提供的tic和toc函数统计相应耗时,结果如表 2(单位s)所示。由表可见,相比于传统DIA算法,改进的DIA算法计算效率更高,验证了文献[17]中的结论。
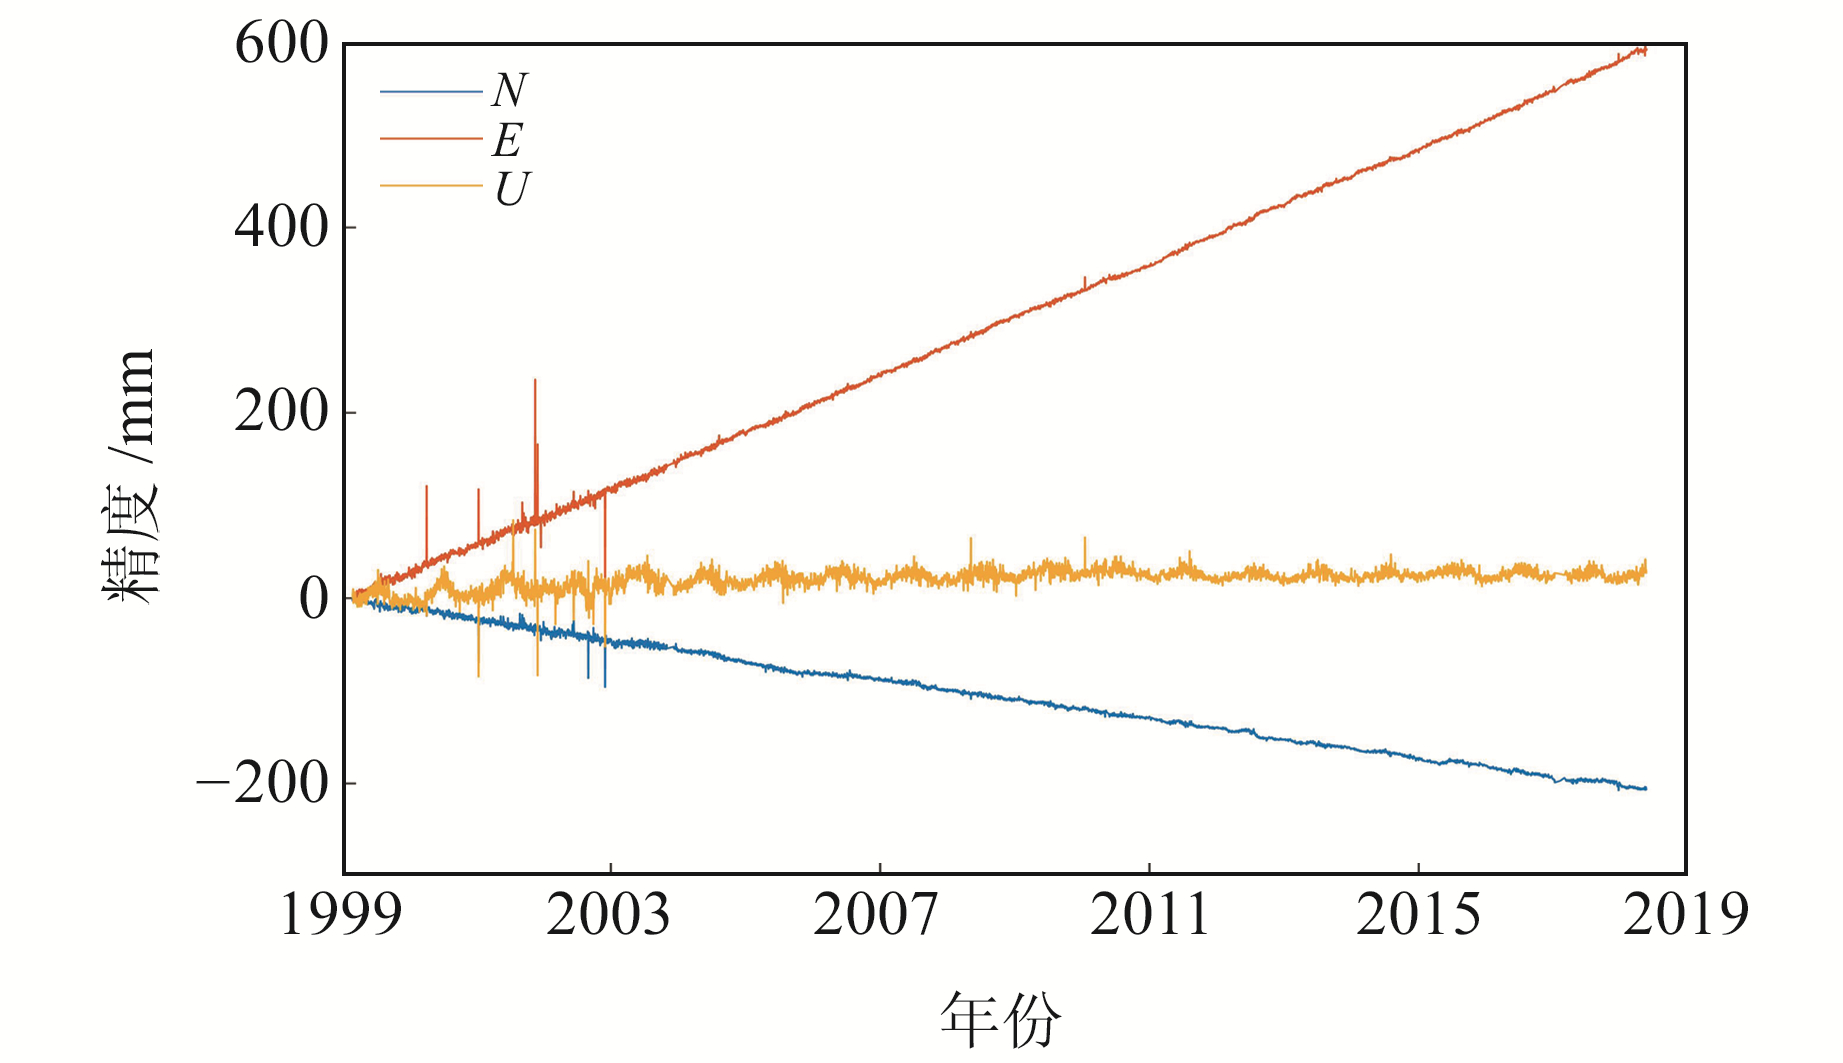
|
图 1 BJFS站坐标时间序列 Fig. 1 Time series of BJFS station |
|
|
表 1 BJFS站噪声估值 Tab. 1 Noise components estimates of BJFS time series |
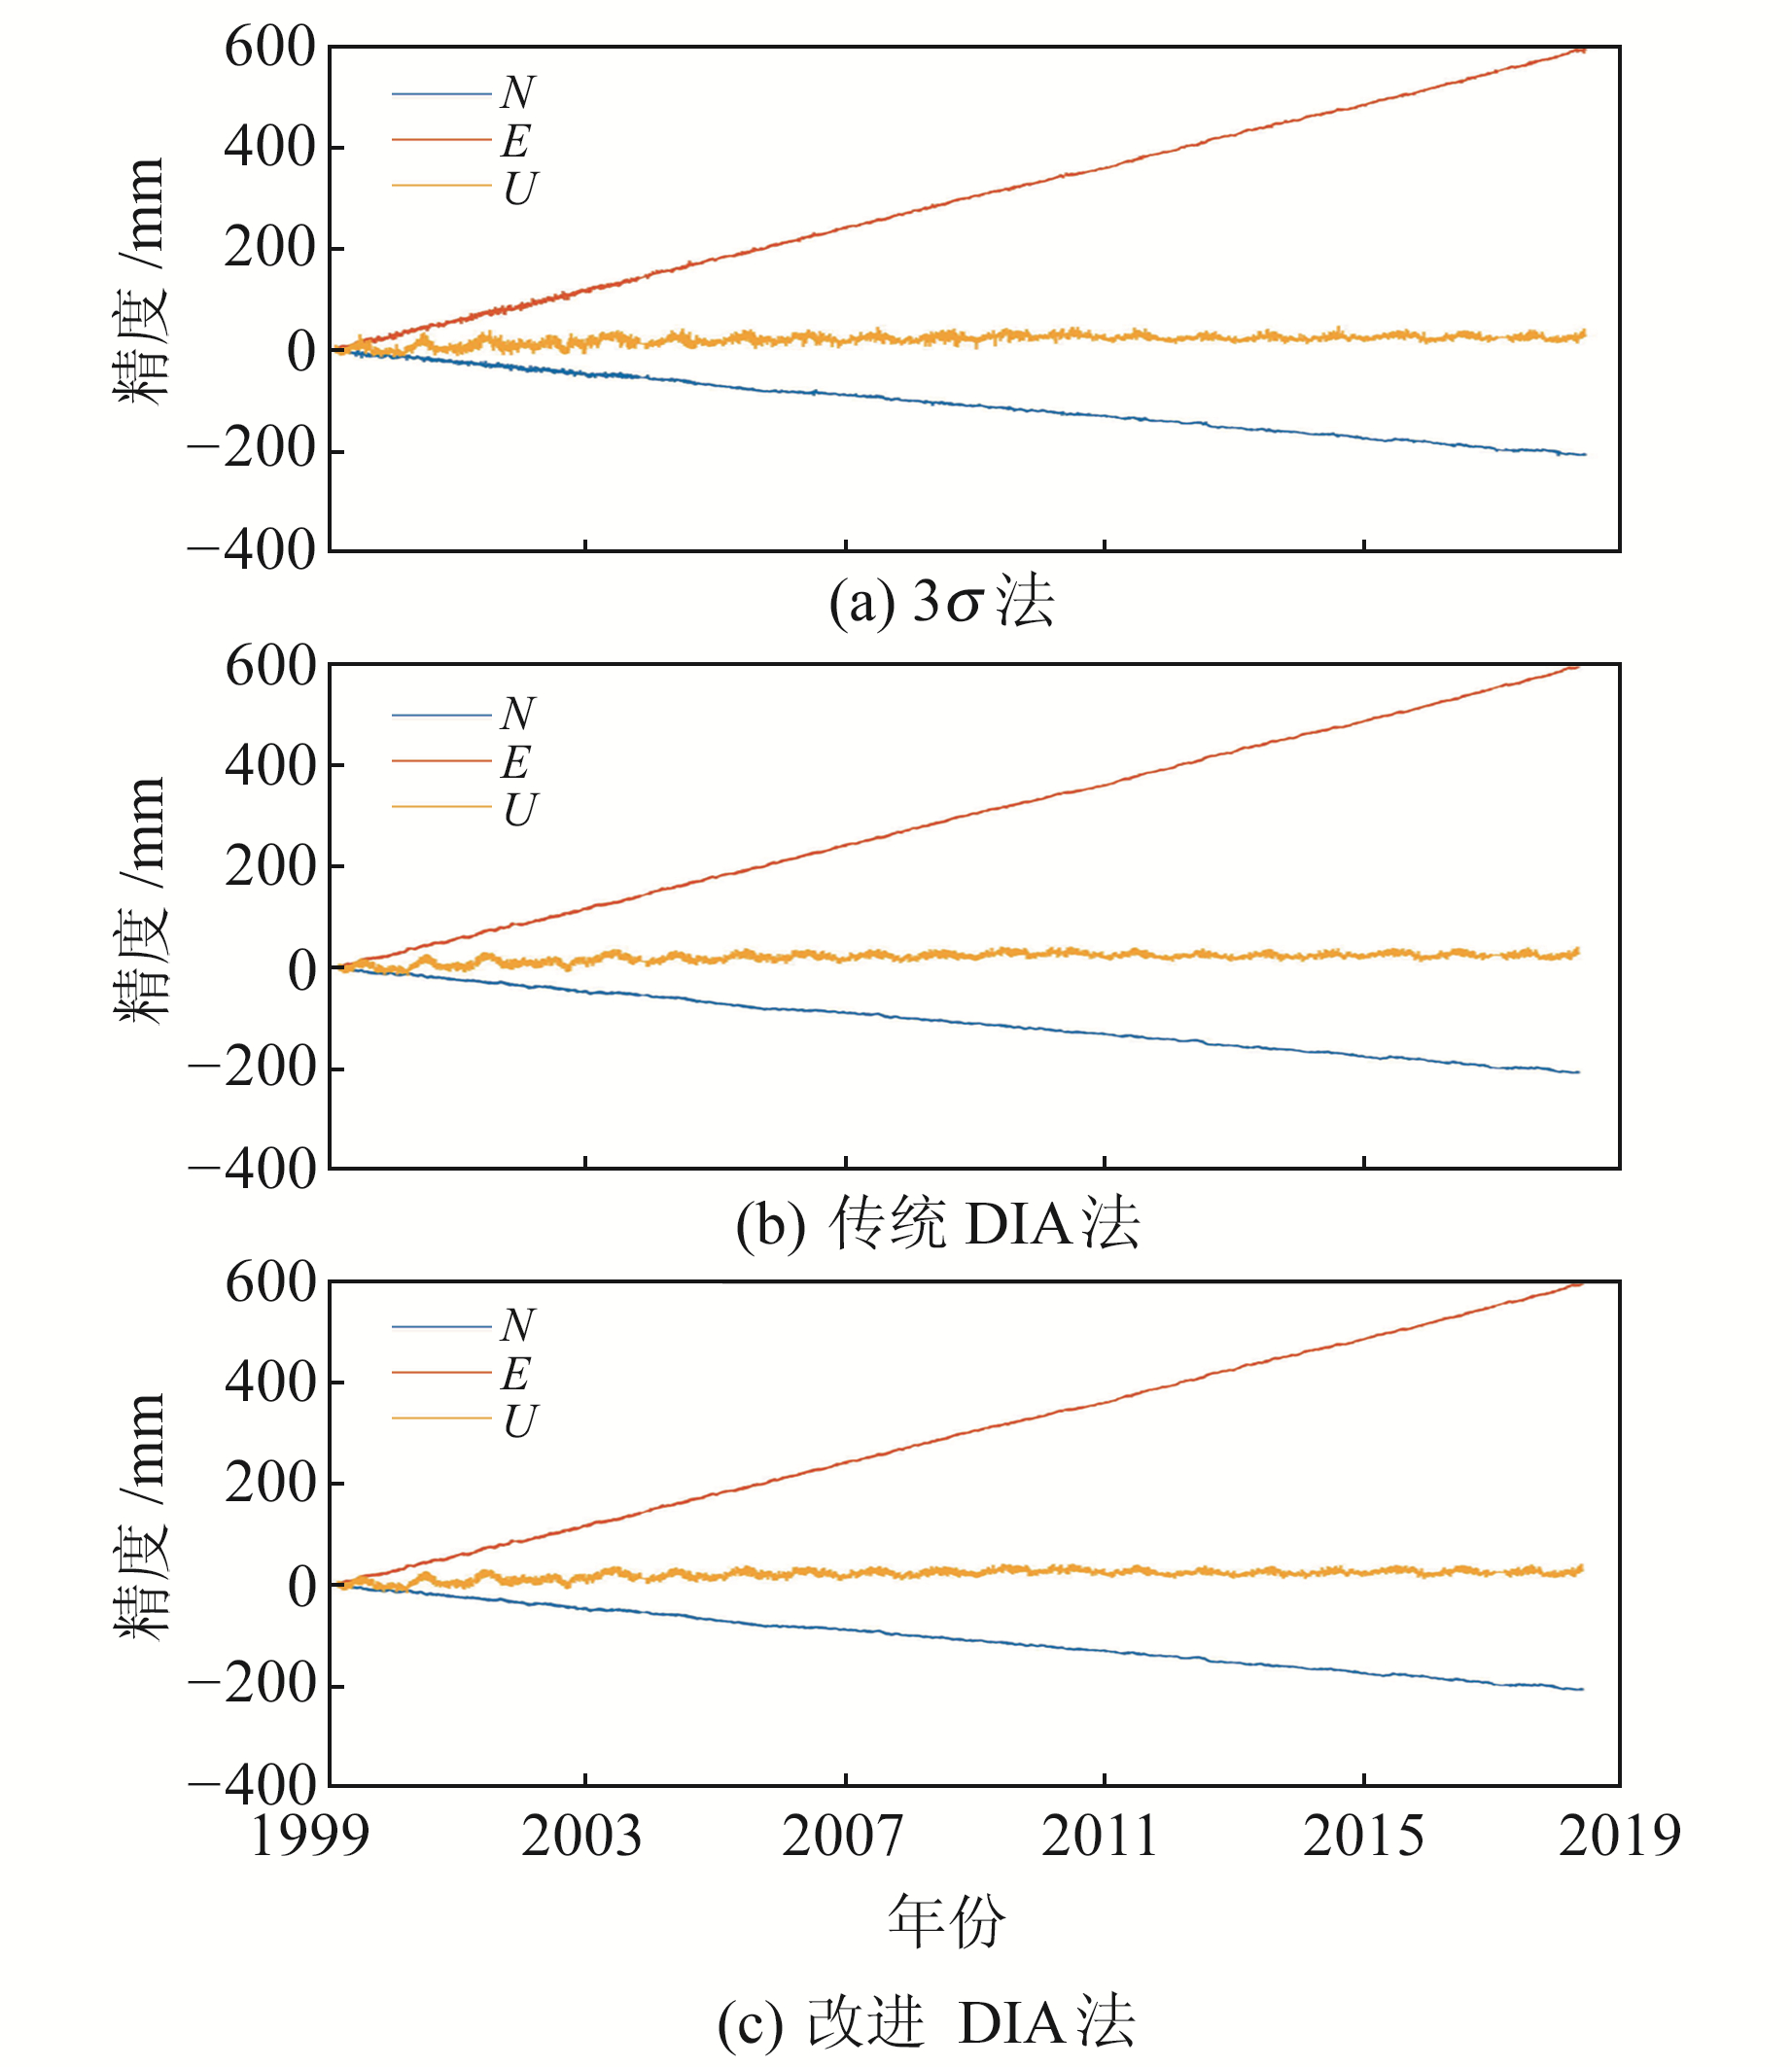
|
图 2 剔除异常值后的时间序列 Fig. 2 Time series after eliminating the outliers |
|
|
表 2 2种DIA法的计算时间对比 Tab. 2 The comparison of computation time for two DIA algorithms |
图 3和图 4分别为3种算法探测到的27个基准站异常值比例和计算时间。由图 3可见,3σ法的探测能力弱于DIA法,3σ法探测到N、E、U方向上的平均异常值比例分别为1.62%、1.92%和1.62%;DIA法探测到N、E、U方向上的平均异常值比例分别为4.61%、4.65%和2.59%,相比于3σ法分别提升2.99%、2.73%和0.97%。此外,改进的DIA法结果与传统DIA完全等价,但其耗时明显减少。传统DIA法在N、E、U方向上的平均耗时分别为21.47 s、21.3 s和24.85 s;改进的DIA法在N、E、U方向上的平均耗时分别为14.55 s、14.70 s和17.80 s,相比于传统DIA法分别提升32.23%、31.15%和28.37%。
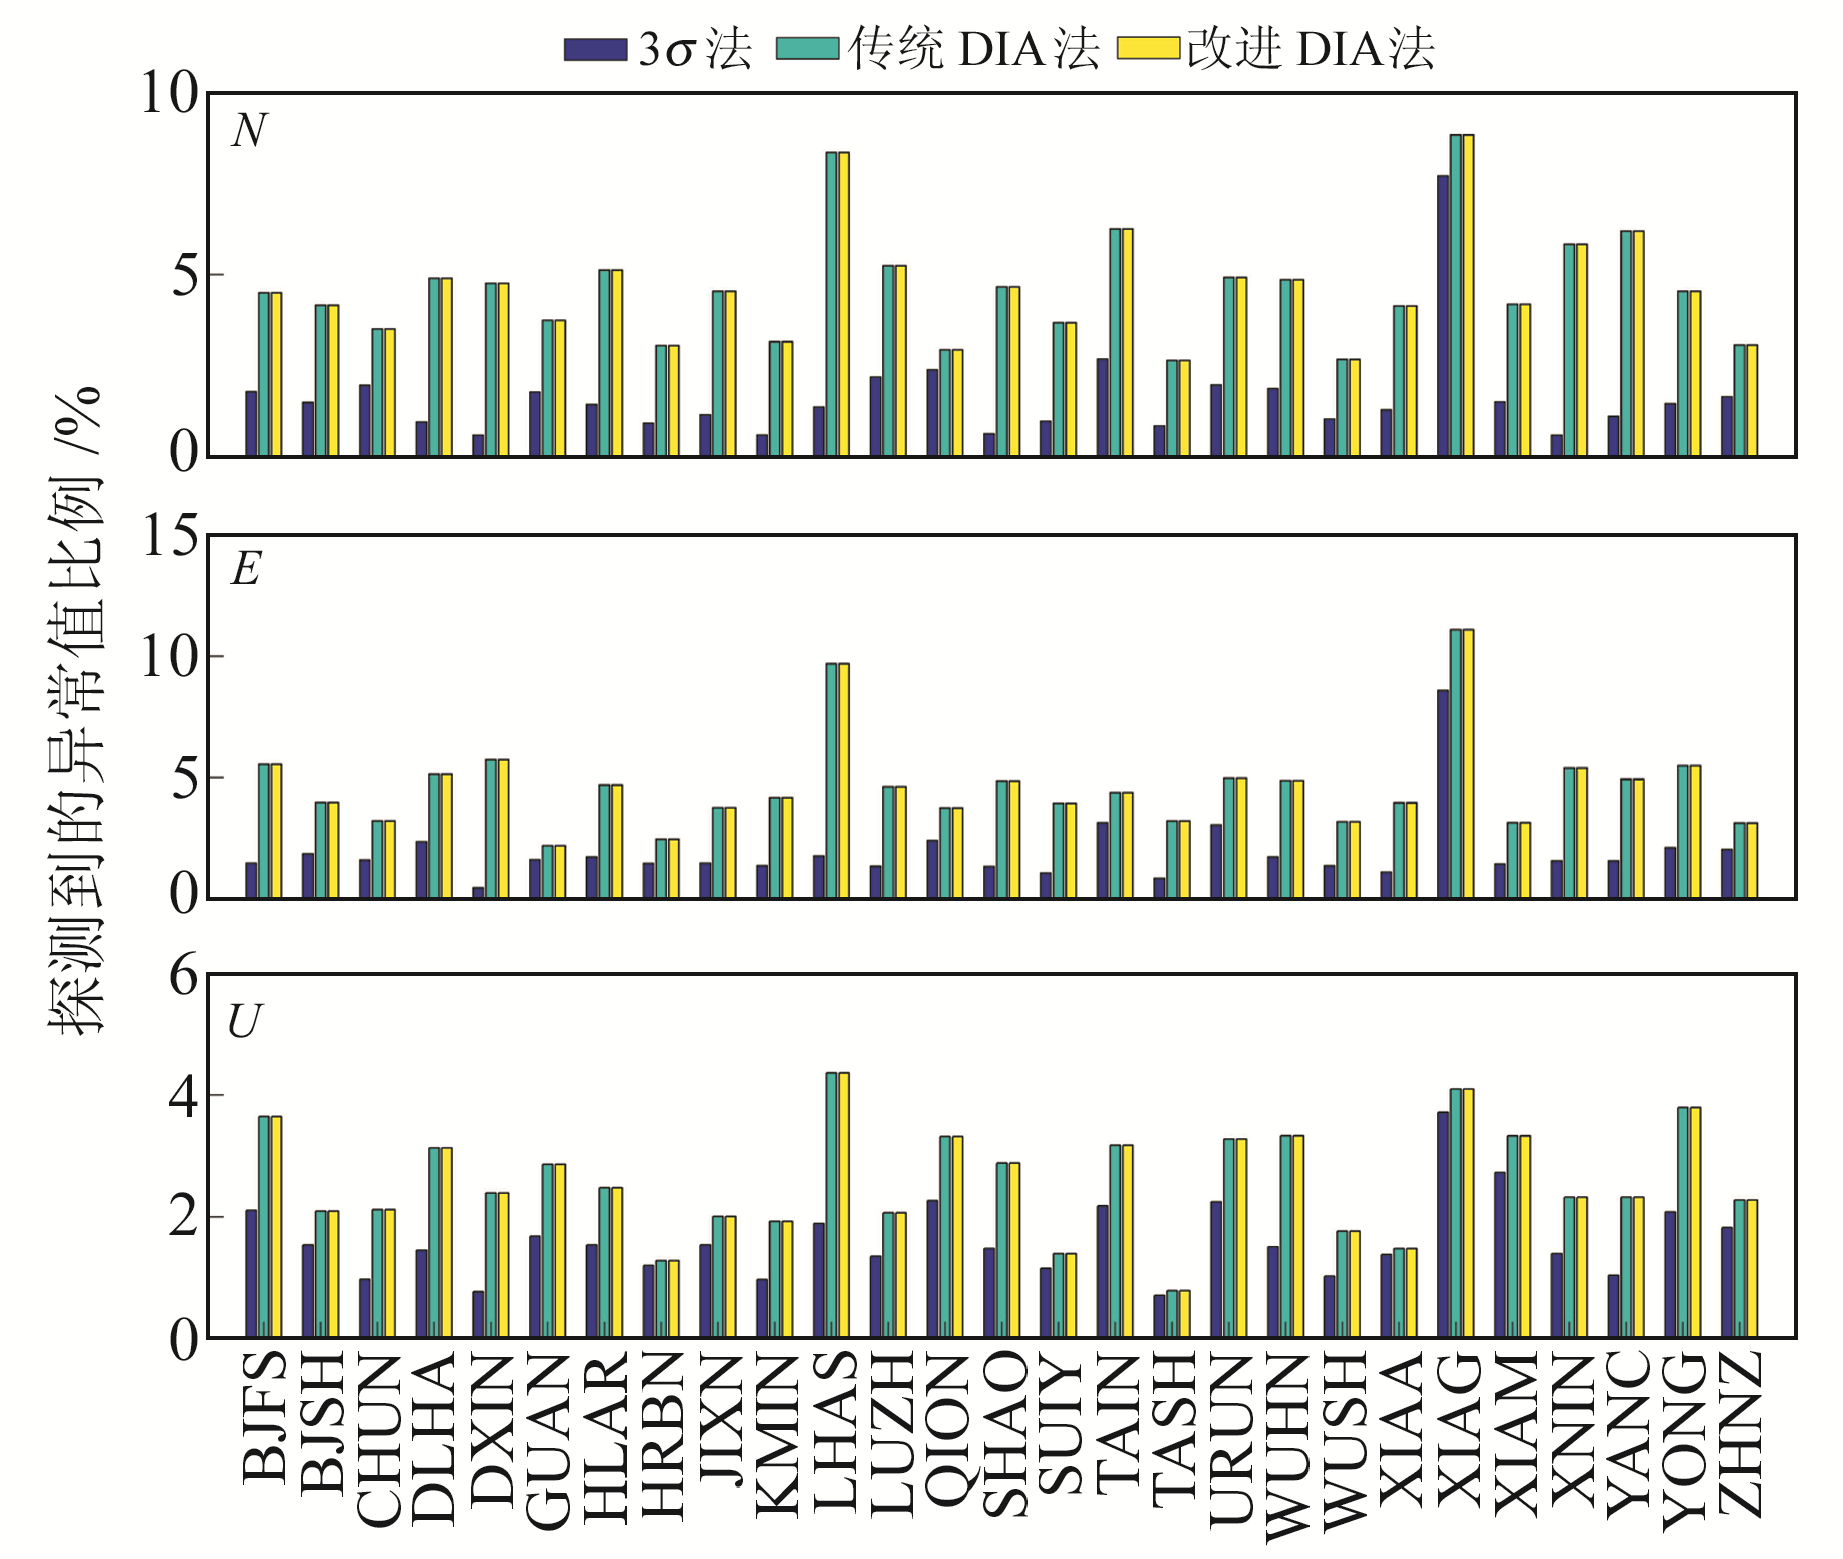
|
图 3 3种算法探测的异常值比例 Fig. 3 Proportions of detected outliers using three algorithms |
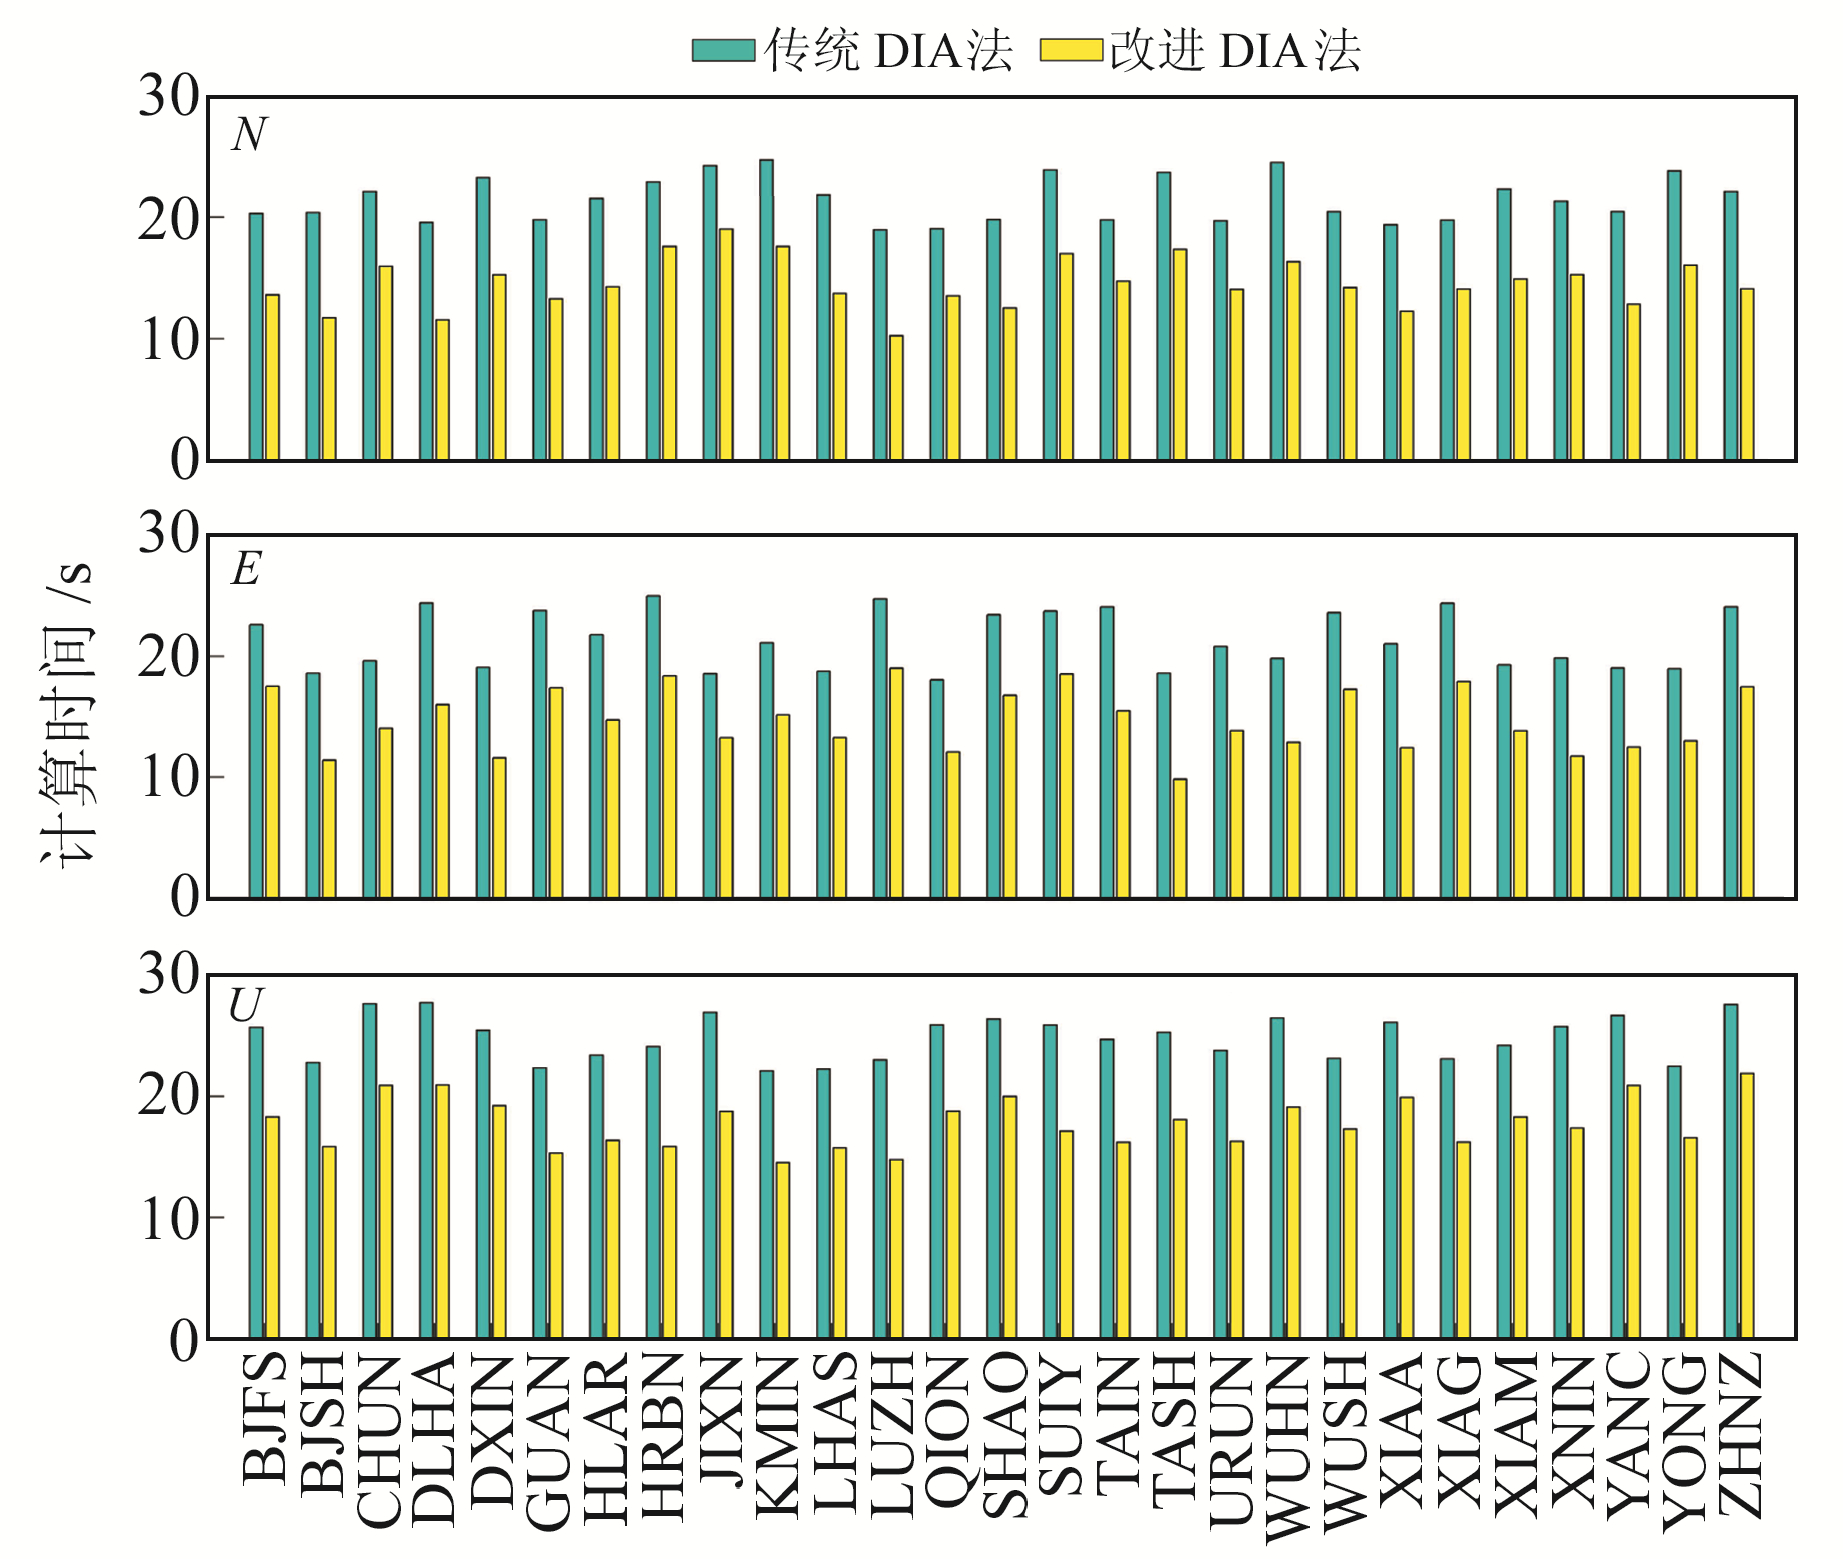
|
图 4 传统DIA法和改进DIA法的计算时间对比 Fig. 4 The comparison of computation times of traditional DIA and modified DIA |
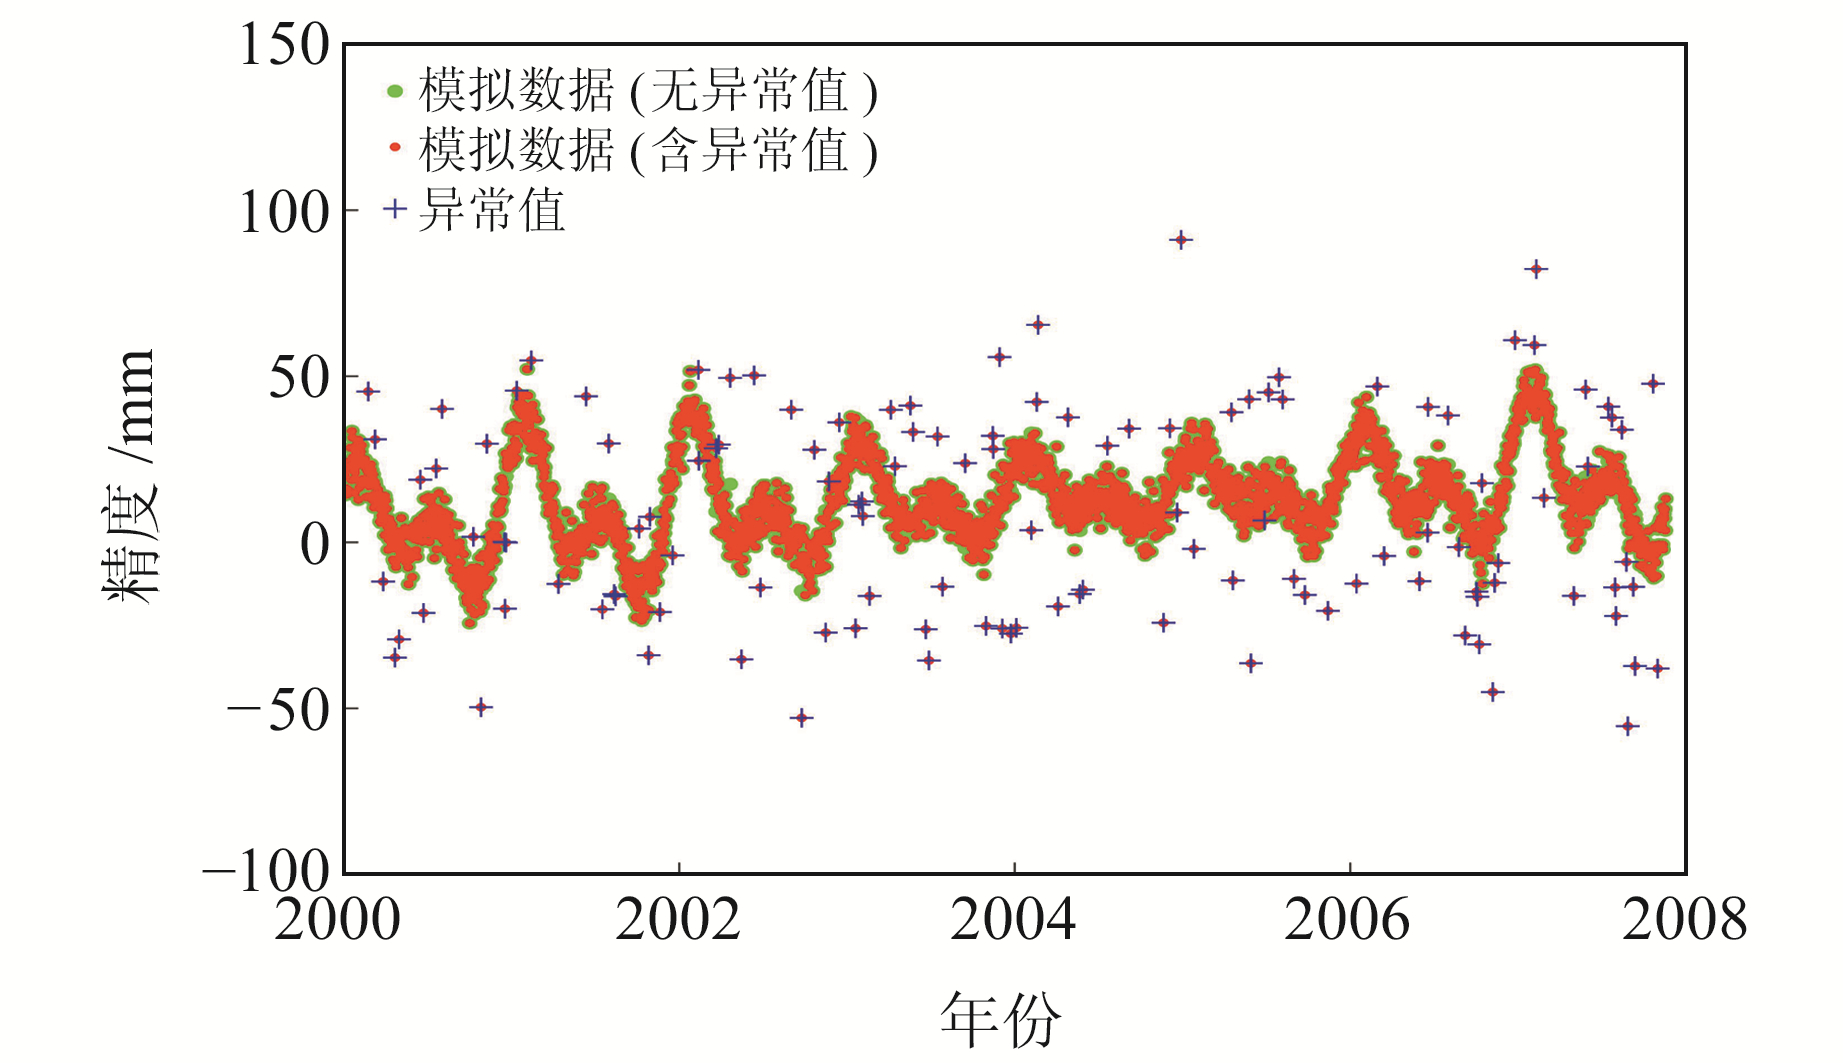
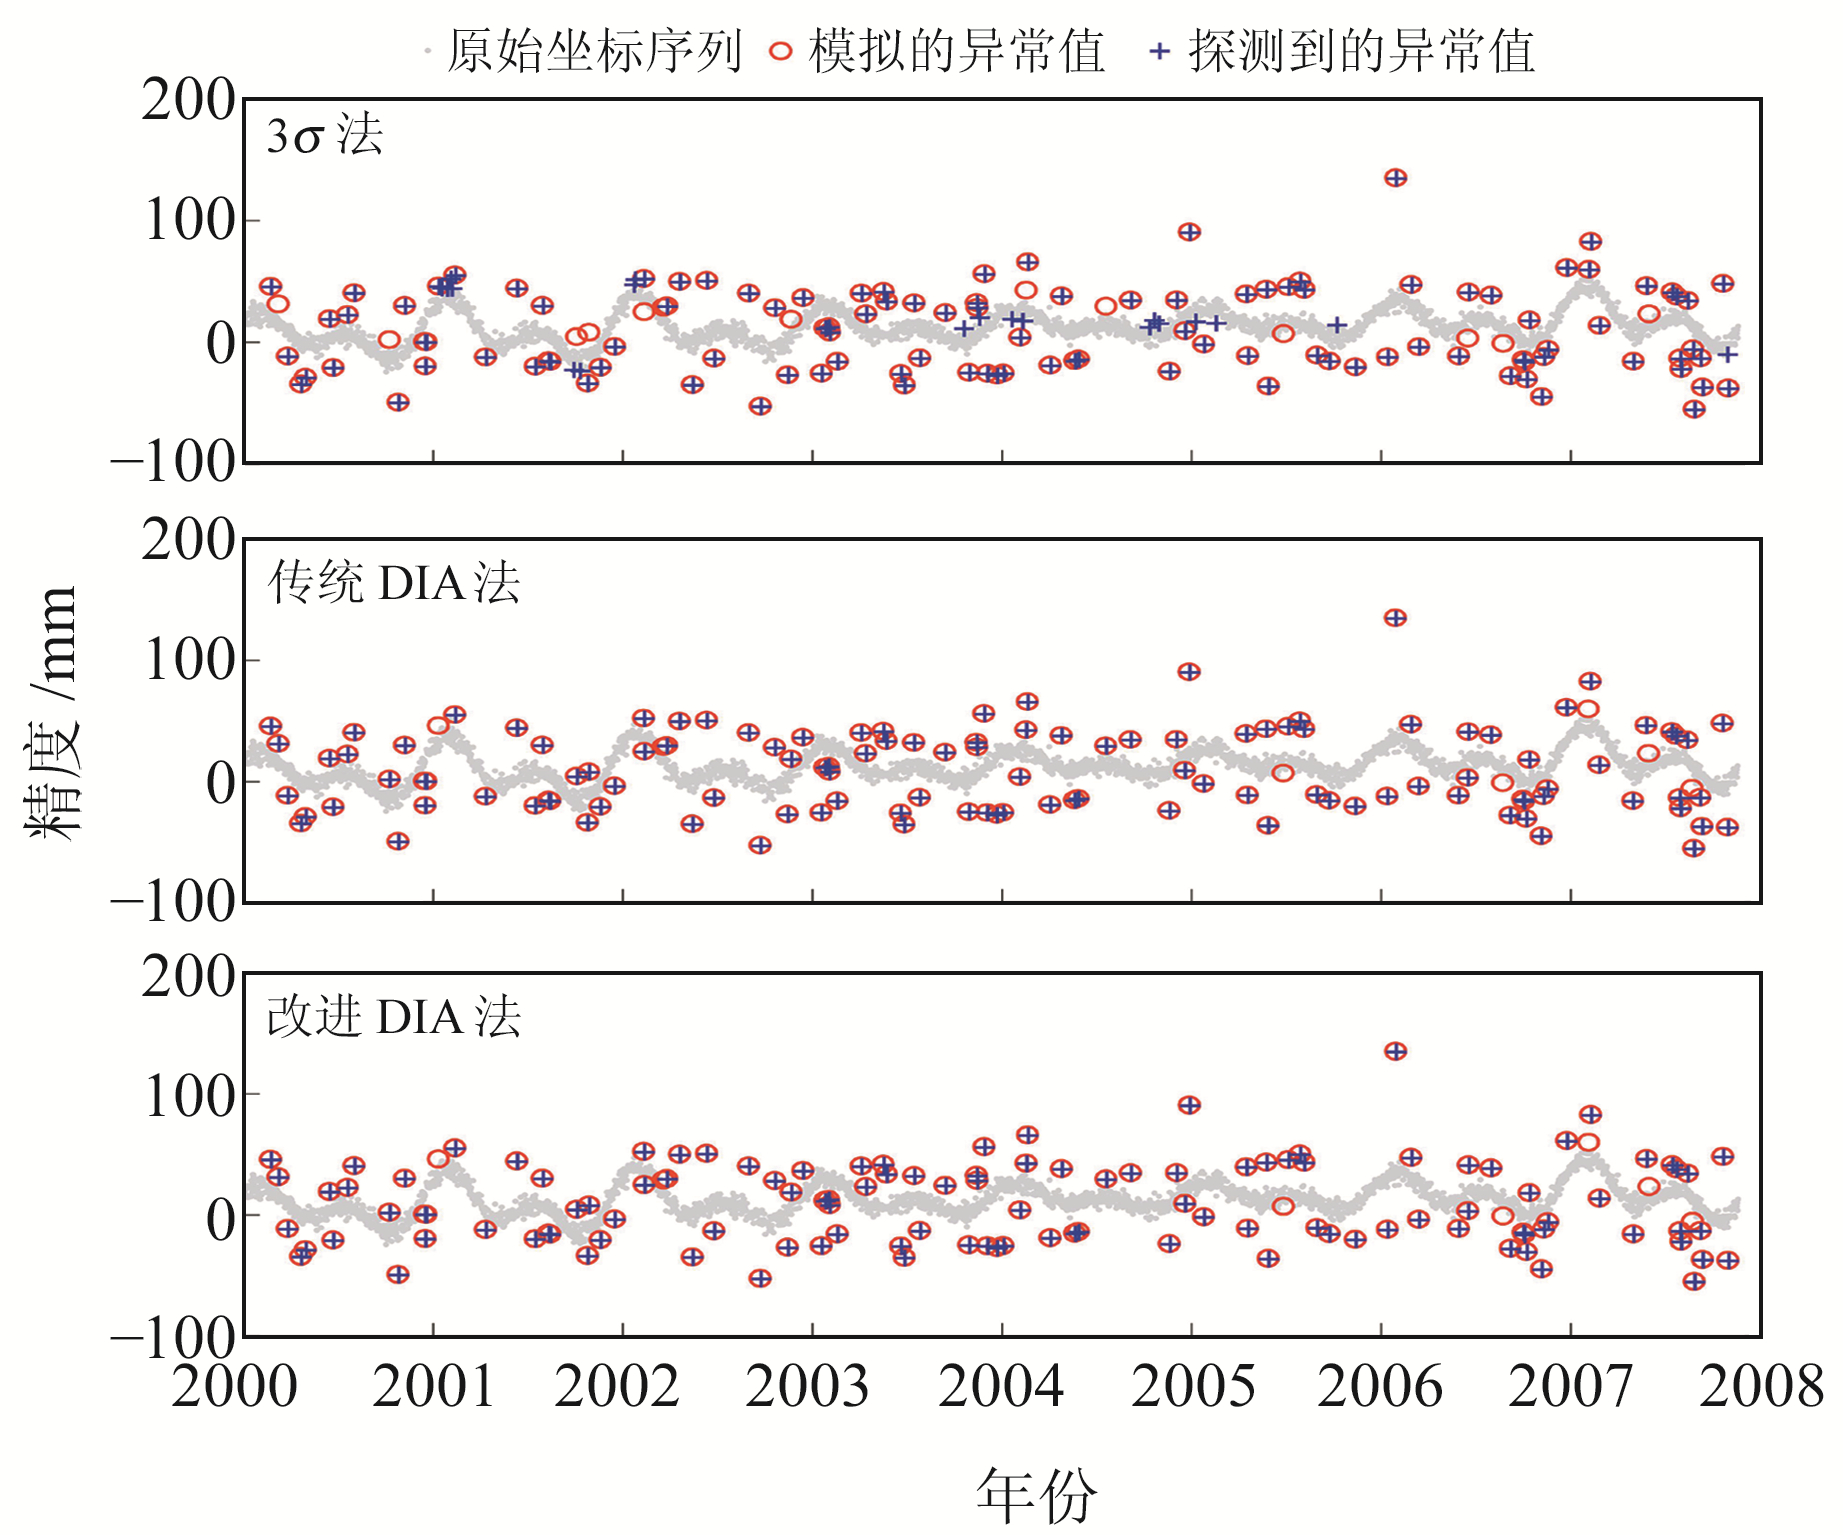
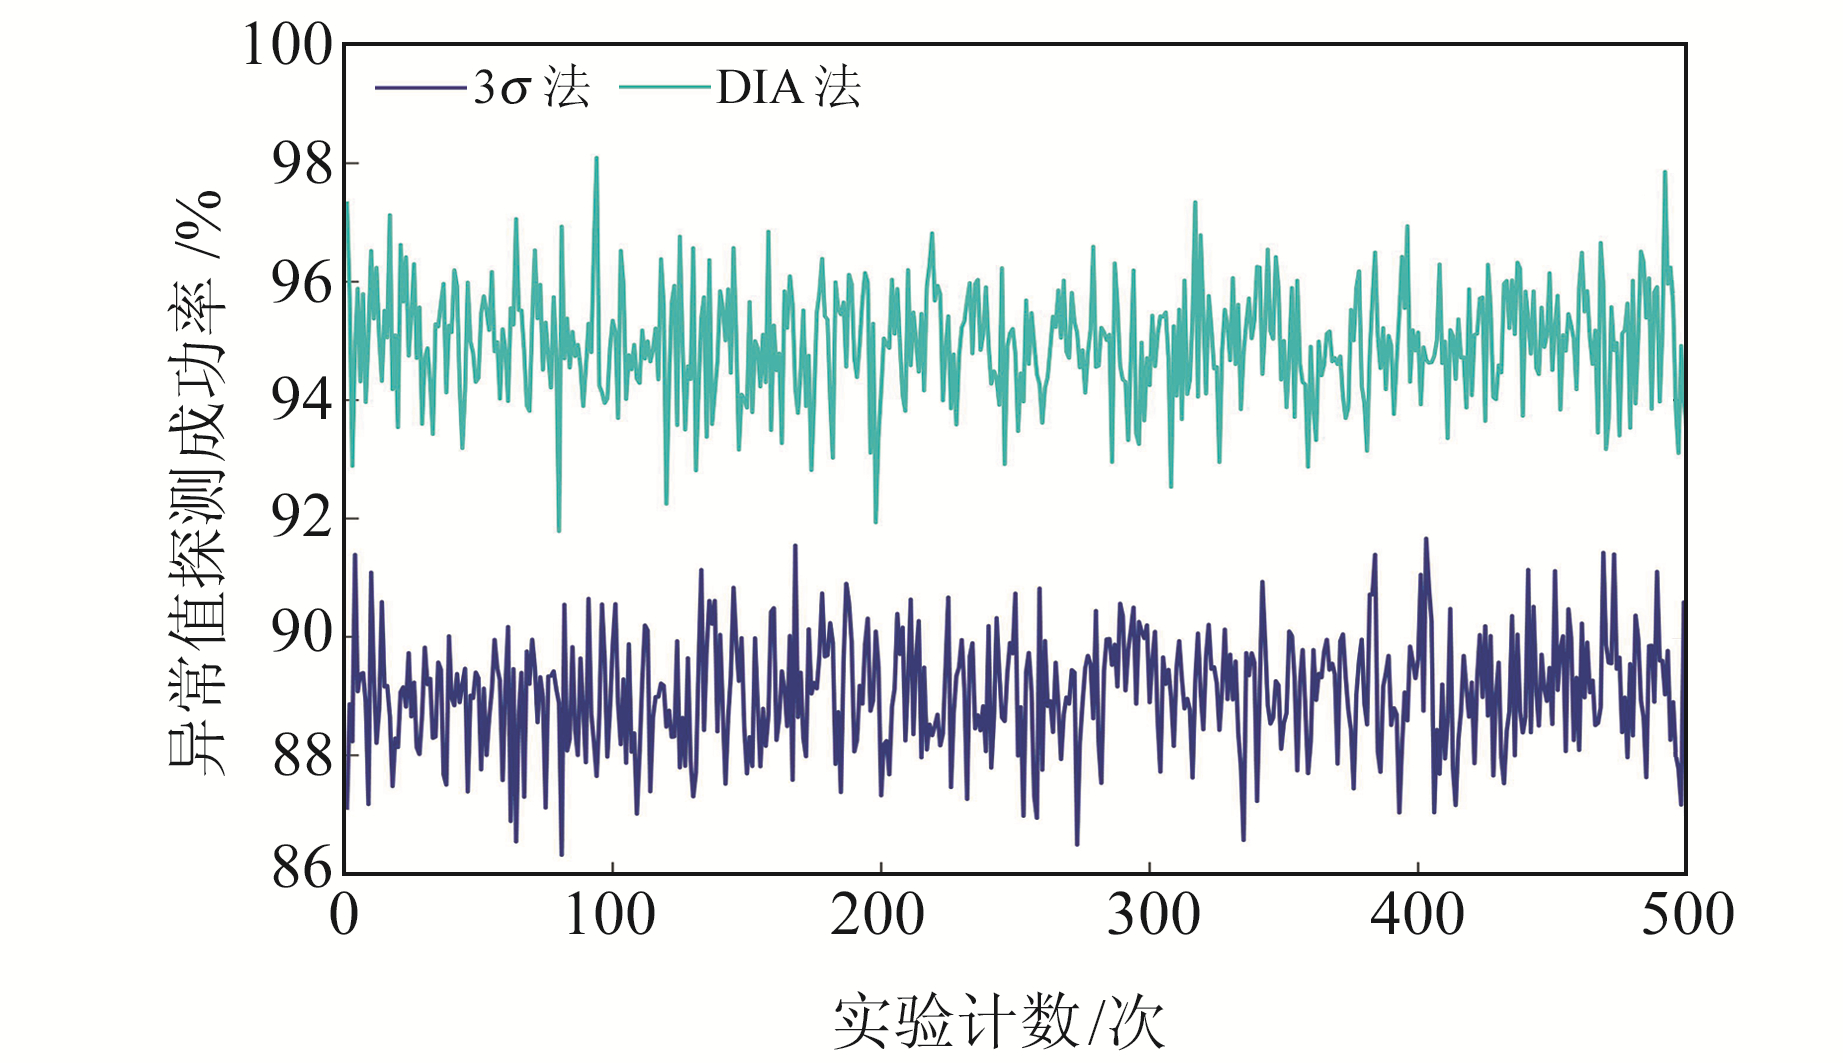
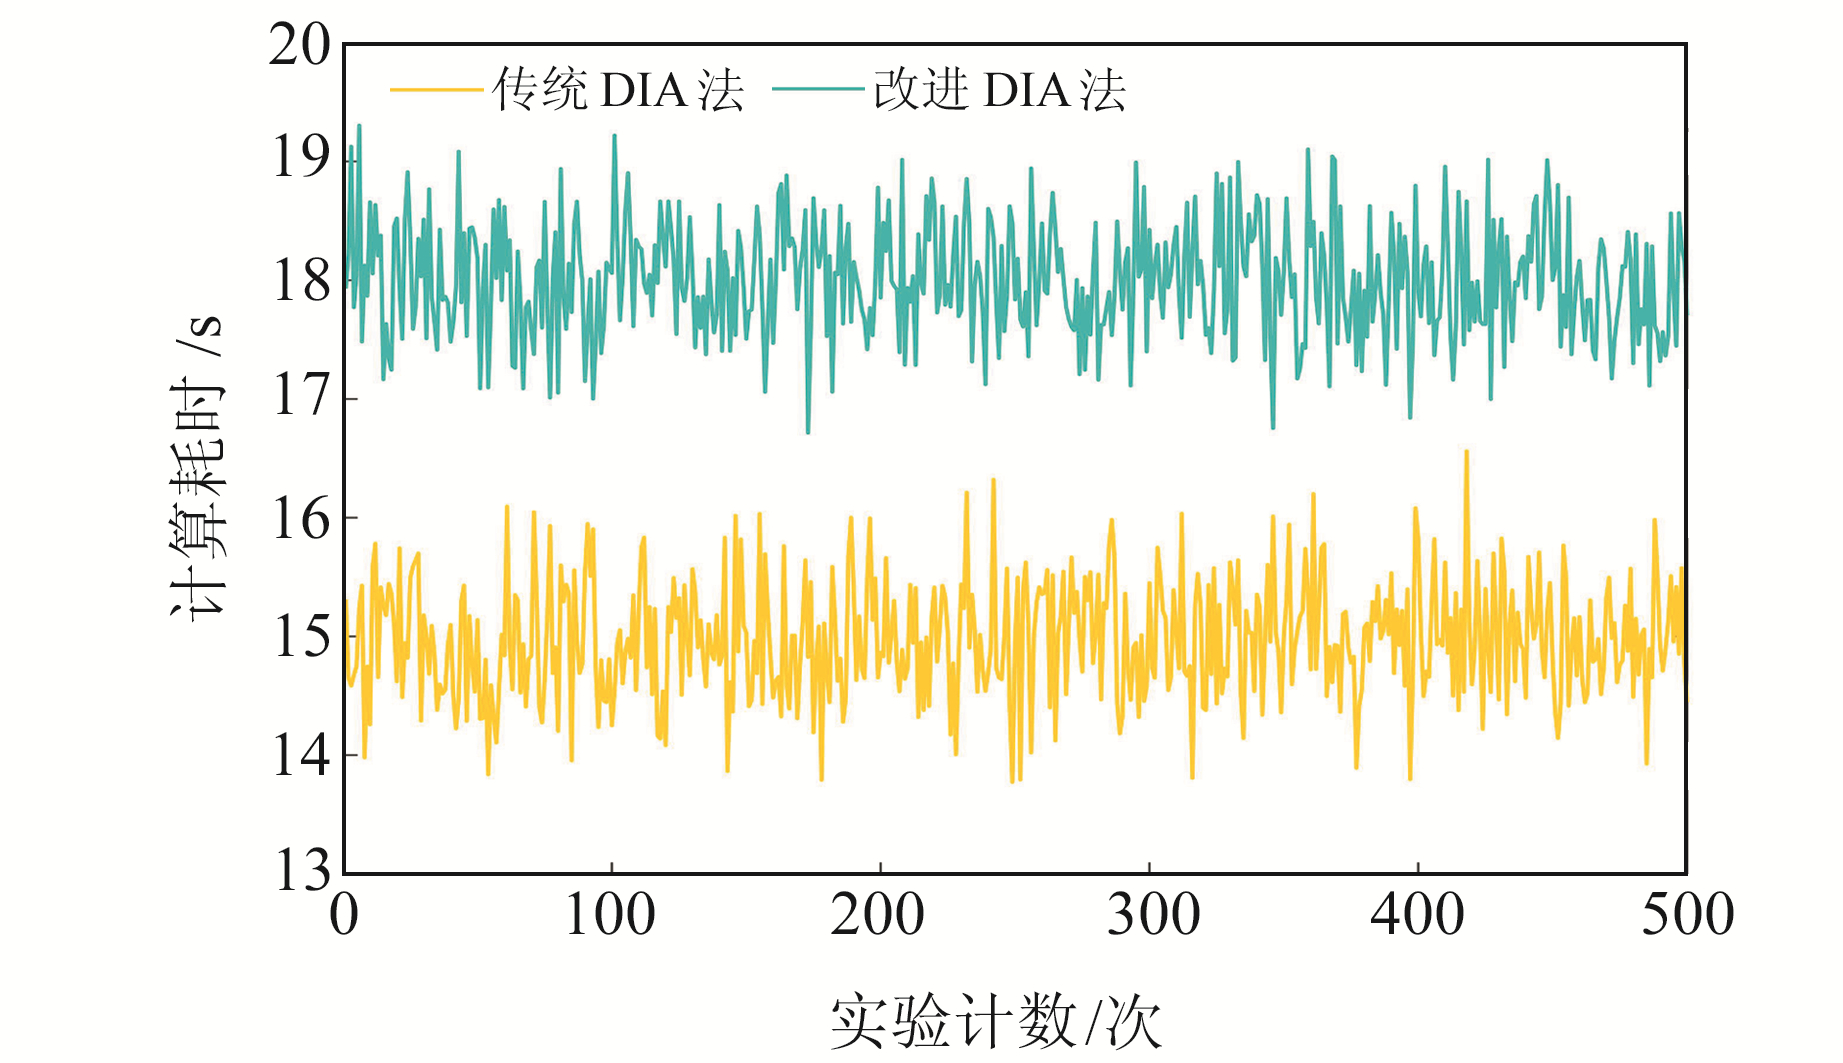
为进一步验证算法的有效性,采用模拟数据进行验证分析。按式(1)生成模拟数据,所用参数见表 3。根据文献[20]中的策略模拟异常值,首先按照均值为0、标准差为6σ的正态分布生成一组数据序列,然后将绝对值小于3σ的数据序列剔除,最后将剩余数据随机加入至模拟的坐标时间序列中,得到被异常值污染的数据,图 5为生成的时间序列。分别采用3σ法、传统DIA法和改进的DIA法进行异常值探测,结果如图 6所示。由图可见,3σ法的探测准确率低于DIA法,仅为86%,误判率也较高;DIA法的准确率高达95%,且误判率较低。图 7为3σ法和DIA法的500次模拟实验探测准确率,图 8为2种DIA法的计算时间。由图 7可见,3σ可探测到89%的异常值,DIA可探测到95%的异常值;由图 8可见,传统DIA法平均耗时为18.01 s,改进的DIA法平均耗时为14.97 s。
|
|
表 3 模拟的坐标序列参数 Tab. 3 Parameters of simulated coordinate time series |
|
图 5 模拟的时间序列 Fig. 5 The simulated time series |
|
图 6 3种算法探测到的异常值与模拟的异常值分布 Fig. 6 Distribution of outliers and simulated outliers detected by three algorithms |
|
图 7 500次模拟实验的3σ法和DIA法探测异常值的准确率 Fig. 7 The accuracy of the 3σ and DIA methods in detecting outliers for 500 simulations |
|
图 8 500次模拟实验的传统DIA法和改进DIA法的计算时间 Fig. 8 The computation times of traditional DIA and modified DIA for 500 simulations |
本文将谐波模型和DIA进行有效融合,分别采用传统DIA法和改进DIA法进行异常值探测,并将其与传统3σ法进行比较分析。模拟数据和中国大陆构造环境监测网络实测数据分析结果表明,DIA法和3σ法均能有效探测出GNSS坐标时间序列中的异常值,其中DIA法性能优于3σ法。当观测数据量较大时,改进DIA法的计算效率更高。
| [1] |
Alothman A O, Bos M, Fernandes R, et al. Annual Sea Level Variations in the Red Sea Observed Using GNSS[J]. Geophysical Journal International, 2019, 221(1): 826-834
(  0) 0) |
| [2] |
Ding H, Xu X Y, Pan Y J, et al. A Time-Varying 3-D Displacement Model of the Similar to 5.9 Year Westward Motion and Its Applications for the Global Navigation Satellite System Positions and Velocities[J]. Journal of Geophysical Research: Solid Earth, 2020, 125(4)
(  0) 0) |
| [3] |
Jiang Z S, Hsu Y J, Yuan L G, et al. Characterizing Spatiotemporal Patterns of Terrestrial Water Storage Variations Using GNSS Vertical Data in Sichuan, China[J]. Journal of Geophysical Research: Solid Earth, 2021, 126(12)
(  0) 0) |
| [4] |
Zhang Q Q, Gui Q M. Bayesian Methods for Outliers Detection in GNSS Time Series[J]. Journal of Geodesy, 2013, 87(7): 609-627 DOI:10.1007/s00190-013-0640-5
(  0) 0) |
| [5] |
Mao A L, Harrison C G A, Dixon T H. Noise in GPS Coordinate Time Series[J]. Journal of Geophysical Research: Solid Earth, 1999, 104(B2): 2 797-2 816 DOI:10.1029/1998JB900033
(  0) 0) |
| [6] |
吴浩, 卢楠, 邹进贵, 等. GNSS变形监测时间序列的改进型3σ粗差探测方法[J]. 武汉大学学报: 信息科学版, 2019, 44(9): 1 282-1 288 (Wu Hao, Lu Nan, Zou Jingui, et al. An Improved 3σ Gross Error Detection Method for GNSS Deformation Monitoring Time Series[J]. Geomatics and Information Science of Wuhan University, 2019, 44(9): 1 282-1 288)
(  0) 0) |
| [7] |
Nikolaidis R. Observation of Geodetic and Seismic Deformation with the Global Positioning System[M]. California: Scripps Institution of Oceanography, 2002
(  0) 0) |
| [8] |
Bos M S, Fernandes R M S, Williams S D P, et al. Fast Error Analysis of Continuous GNSS Observations with Missing Data[J]. Journal of Geodesy, 2013, 87(4): 351-360 DOI:10.1007/s00190-012-0605-0
(  0) 0) |
| [9] |
Ahmad S, Lin Z, Abbasi S A, et al. On Efficient Monitoring of Process Dispersion Using Interquartile Range[J]. Open Journal of Applied Sciences, 2012, 2(48): 39-43
(  0) 0) |
| [10] |
Bilen C, Huzurbazar S. Wavelet-Based Detection of Outliers in Time Series[J]. Journal of Computational and Graphical Statistics, 2002, 11(2): 311-327 DOI:10.1198/106186002760180536
(  0) 0) |
| [11] |
Rizzo P, Sorrivi E, Lanza S F, et al. Wavelet-Based Outlier Analysis for Guided Wave Structural Monitoring: Application to Multi-Wire Strands[J]. Journal of Sound and Vibration, 2007, 307(1-2): 52-68 DOI:10.1016/j.jsv.2007.06.058
(  0) 0) |
| [12] |
徐洪钟, 吴中如, 李雪红, 等. 基于小波分析的大坝观测数据异常值检测[J]. 水电能源科学, 2002, 20(4): 20-21 (Xu Hongzhong, Wu Zhongru, Li Xuehong, et al. Outliers Detecting of Dam Observation Data Based on Wavelet Analysis[J]. Hydroelectric Energy, 2002, 20(4): 20-21)
(  0) 0) |
| [13] |
Klos A, Bos M S, Bogusz J. Detecting Time-Varying Seasonal Signal in GPS Position Time Series with Different Noise Levels[J]. GPS Solutions, 2017, 22(1): 1-11
(  0) 0) |
| [14] |
姜卫平, 王锴华, 李昭, 等. GNSS坐标时间序列分析理论与方法及展望[J]. 武汉大学学报: 信息科学版, 2018, 43(12): 2 112-2 123 (Jiang Weiping, Wang Kaihua, Li Zhao, et al. Prospect and Theory of GNSS Coordinate Time Series Analysis[J]. Geomatics and Information Science of Wuhan University, 2018, 43(12): 2 112-2 123)
(  0) 0) |
| [15] |
Yuan P, Jiang W P, Wang K H, et al. Effects of Spatiotemporal Filtering on the Periodic Signals and Noise in the GPS Position Time Series of the Crustal Movement Observation Network of China[J]. Remote Sensing, 2018, 10(9): 1 472 DOI:10.3390/rs10091472
(  0) 0) |
| [16] |
Williams S D P. CATS: GPS Coordinate Time Series Analysis Software[J]. GPS Solutions, 2008, 12(2): 147-153 DOI:10.1007/s10291-007-0086-4
(  0) 0) |
| [17] |
Amiri-Simkooei A R, Ansari H, Sharifi M A. Application of Recursive Least Squares to Efficient Blunder Detection in Linear Models[J]. Journal of Geomatics Science and Technology, 2015, 5(2): 258-267
(  0) 0) |
| [18] |
方兴, 黄李雄, 曾文宪, 等. 稳健估计的一种改进迭代算法[J]. 测绘学报, 2018, 47(10): 1 301-1 306 (Fang Xing, Huang Lixiong, Zeng Wenxian, et al. On an Improved Iterative Reweighted Least Squares Algorithm in Robust Estimation[J]. Acta Geodaetica et Cartographica Sinica, 2018, 47(10): 1 301-1 306)
(  0) 0) |
| [19] |
Teunissen P J G. Distributional Theory for the DIA Method[J]. Journal of Geodesy, 2018, 92(1): 59-80
(  0) 0) |
| [20] |
明锋, 曾安敏, 景一帆. L1范数与IQR统计量组合的GNSS坐标序列粗差探测算法[J]. 测绘科学技术学报, 2016, 33(2): 127-132 (Ming Feng, Zeng Anmin, Jing Yifan. A New Method of Outlier Detection for GNSS Position Time Series Based on the Combination of L1-Norm and IQR Statistic[J]. Journal of Geomatics Science and Technology, 2016, 33(2): 127-132)
(  0) 0) |
2. Gandong College, 56 Xuefu Road, Fuzhou 344100, China;
3. School of Civil and Architecture Engineering, Panzhihua University, 10 North-Sanxian Avenue, Panzhihua 617000, China
 2023, Vol. 43

