2. 吉林大学仪器科学与电气工程学院,长春市民主大街938号,130026;
3. 应急管理部国家自然灾害防治研究院,北京市安宁庄路1号,100085
井水位观测值动态表达式一般为:
| $ y_n=x_n+P_n+T_n+R_n+\varepsilon_n $ | (1) |
式中,yn为水位观测值;xn为水位残差;Pn为气压效应;Tn为潮汐效应(体应变潮汐理论值);Rn为降雨效应;εn为测量噪声,假定其为均值为0、方差为σ2的高斯白噪声[1]。为简化计算,暂不考虑井水位降雨效应。从已有研究来看,井水位中潮汐效应与气压效应并非是简单的一元线性关系,而是存在延时、滞后且持续一段时间。考虑实际过程,本文侧重讨论一元线性关系的计算,并对一元线性拟合后的数学问题进行简单讨论。
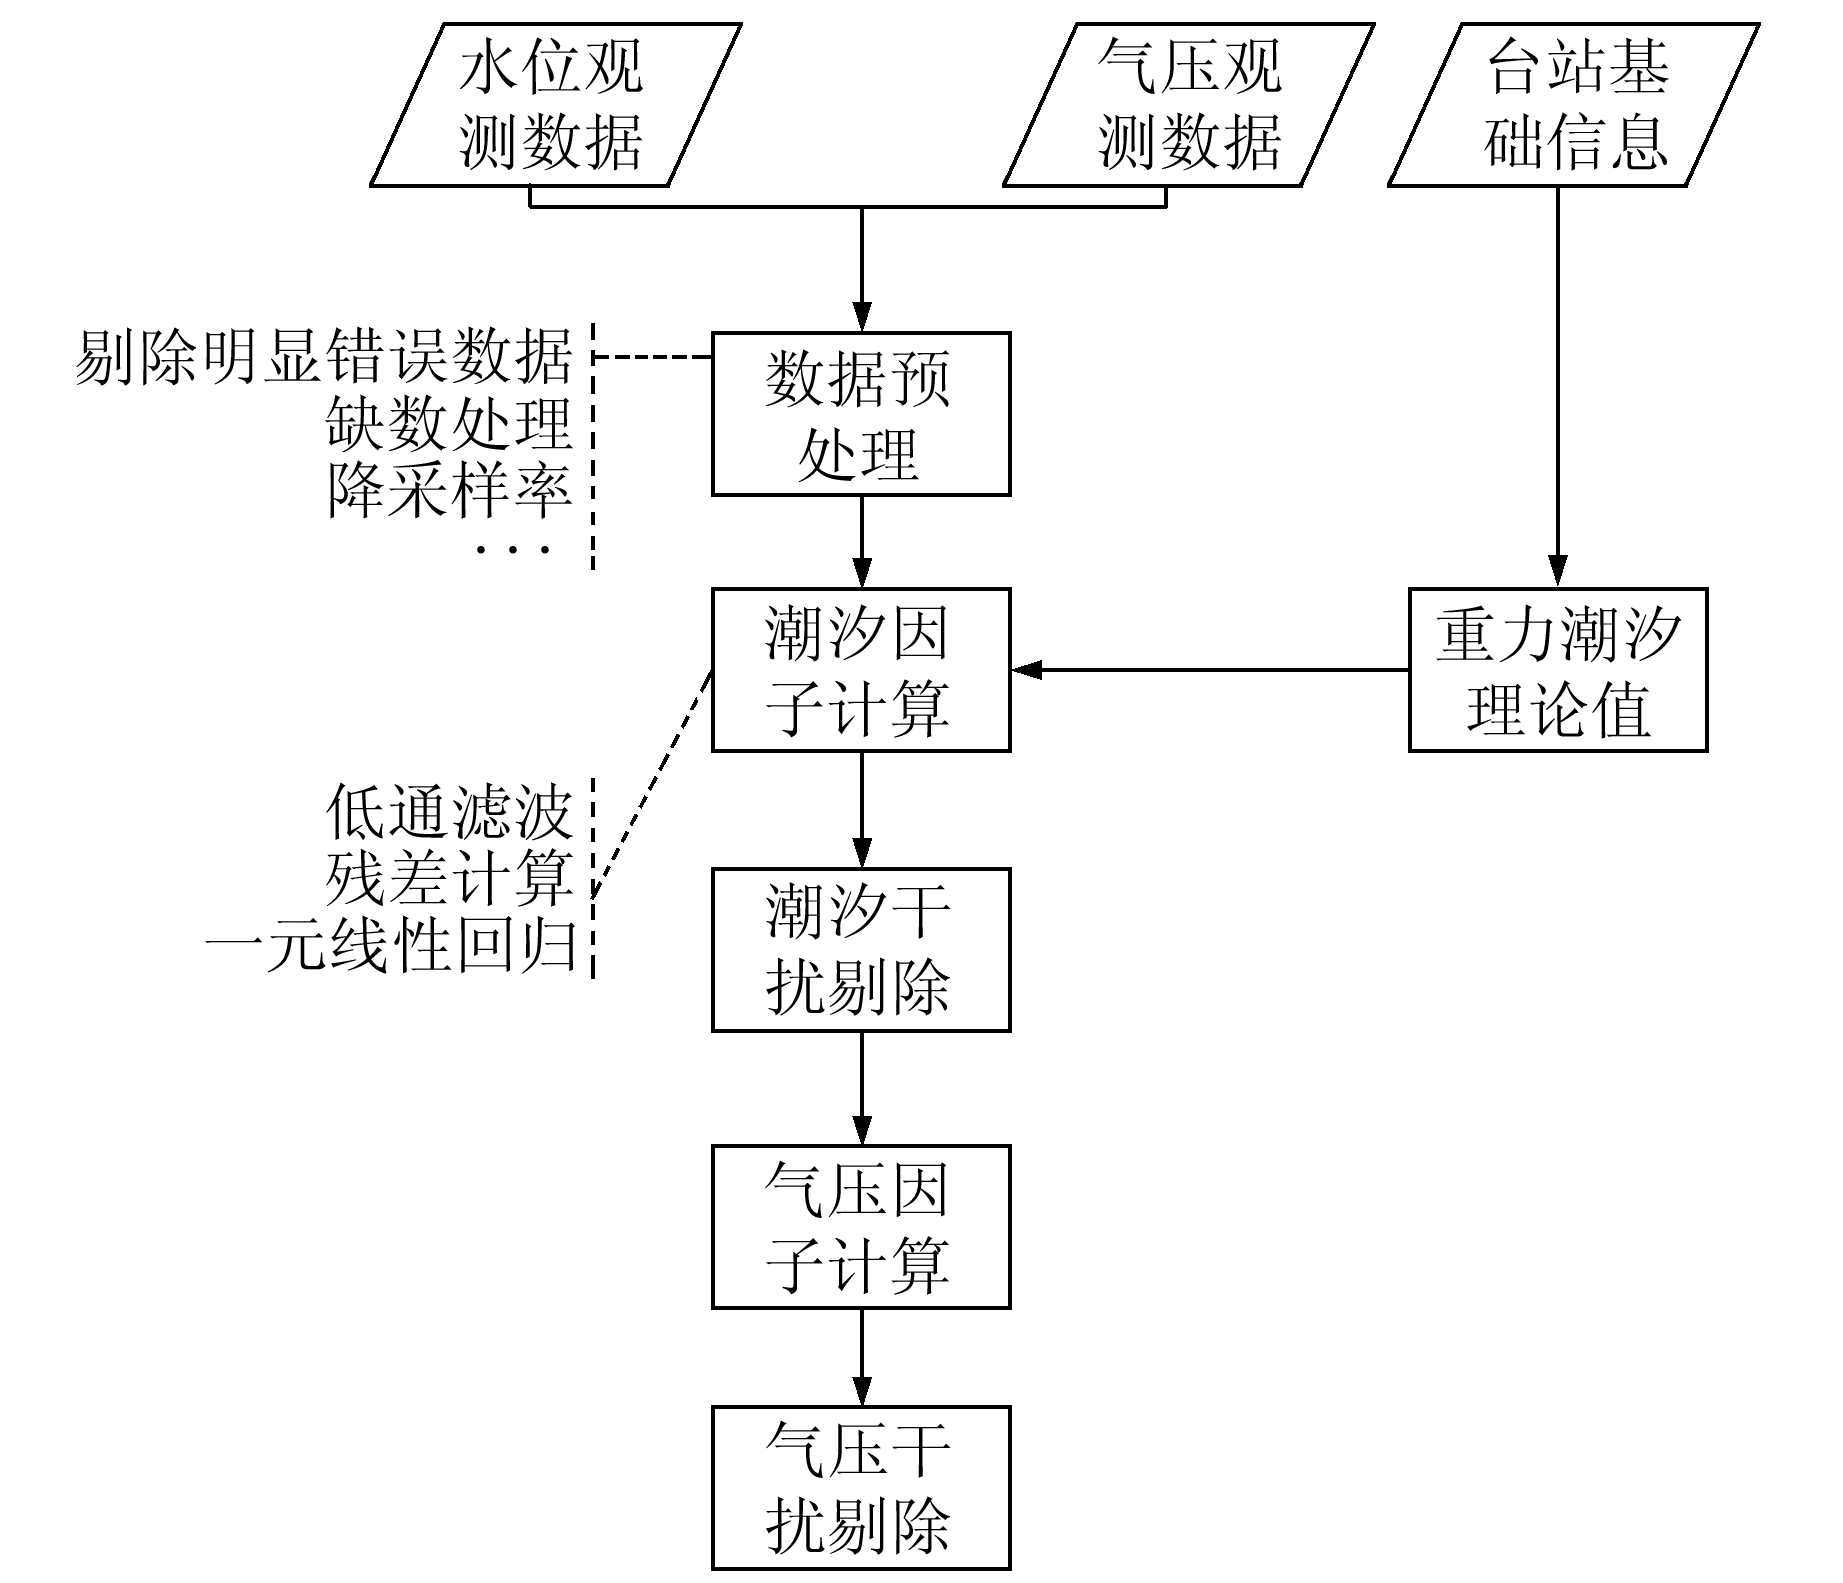
1 井水位潮汐因子与气压因子计算井水位潮汐与气压效应计算过程如图 1所示,主要步骤如下:

|
图 1 井水位潮汐与气压效应计算过程 Fig. 1 The calculating process of tidal and barometric effects of groundwater level |
1) 源数据预处理。①剔除明显错误数据;②缺数处理,由于MATLAB许多计算过程要求数据完整,故采用一定数学方法对缺数进行插值;③降采样率,由于观测数据采样率多为1次/min,甚至1次/s,而地球固体潮汐、气压等周期都是以小时为单位,为减少计算的复杂性,进行适当降采样率处理,本文采用1次/10 min。
2) 潮汐理论值计算。常规计算方法为采用专用软件,如MAPSIS按指定要求进行计算,得到相应数据文件后再参与计算,但这会增加处理的复杂性。通过梳理重力固体潮汐理论,采用H_gravity_earthtide自定义函数进行实时计算,即根据台站基础信息(经纬度)以及数据时间进行计算。
3) 潮汐因子计算。采用低通滤波提取趋势变化,然后用源数据减去低通滤波的趋势性变化即得到仅保留潮汐成分的水位,利用一元线性回归计算潮汐因子,进而剔除水位中的潮汐成分。
4) 气压因子计算。由于气压效应存在滞后效应[2],故先求出最大相关系数,并取得滞后时间;再根据滞后时间进行一元线性回归计算,求取气压因子并剔除气压干扰。
根据上述过程,MATLAB代码如下:
fc=1/(24*60*60*2);%截止频率
fs=1/(10*60);%采样频率
[fdata, ddata]=H_butter_lowpass(fc, fs, sw);
subplot(211);
plot(dates, sw, 'b.', dates, fdata, 'r-', 'linewidth', 2);
set(gca, 'xlim', [xmin xmax], 'xtick', xtk, 'xticklabel', xtkl, 'fontsize', 12, 'fontweight', 'bold', 'ydir', 'reverse');
xlabel('日期(2022年)', 'fontsize', 12, 'fontweight', 'bold');
ylabel('水位(m)', 'fontsize', 12, 'fontweight', 'bold');
legend('水位原始观测数据', '水位低通滤波后数据', 'location', 'best');
subplot(212);
plot(dates, ddata, 'linewidth', 2);
set(gca, 'xlim', [xmin xmax], 'xtick', xtk, 'xticklabel', xtkl, 'fontsize', 12, 'fontweight', 'bold', 'ydir', 'reverse');
xlabel('日期(2022年)', 'fontsize', 12, 'fontweight', 'bold');
legend('去掉低频波成分后水位数据', 'location', 'best');
ylabel('水位(m)', 'fontsize', 12, 'fontweight', 'bold');
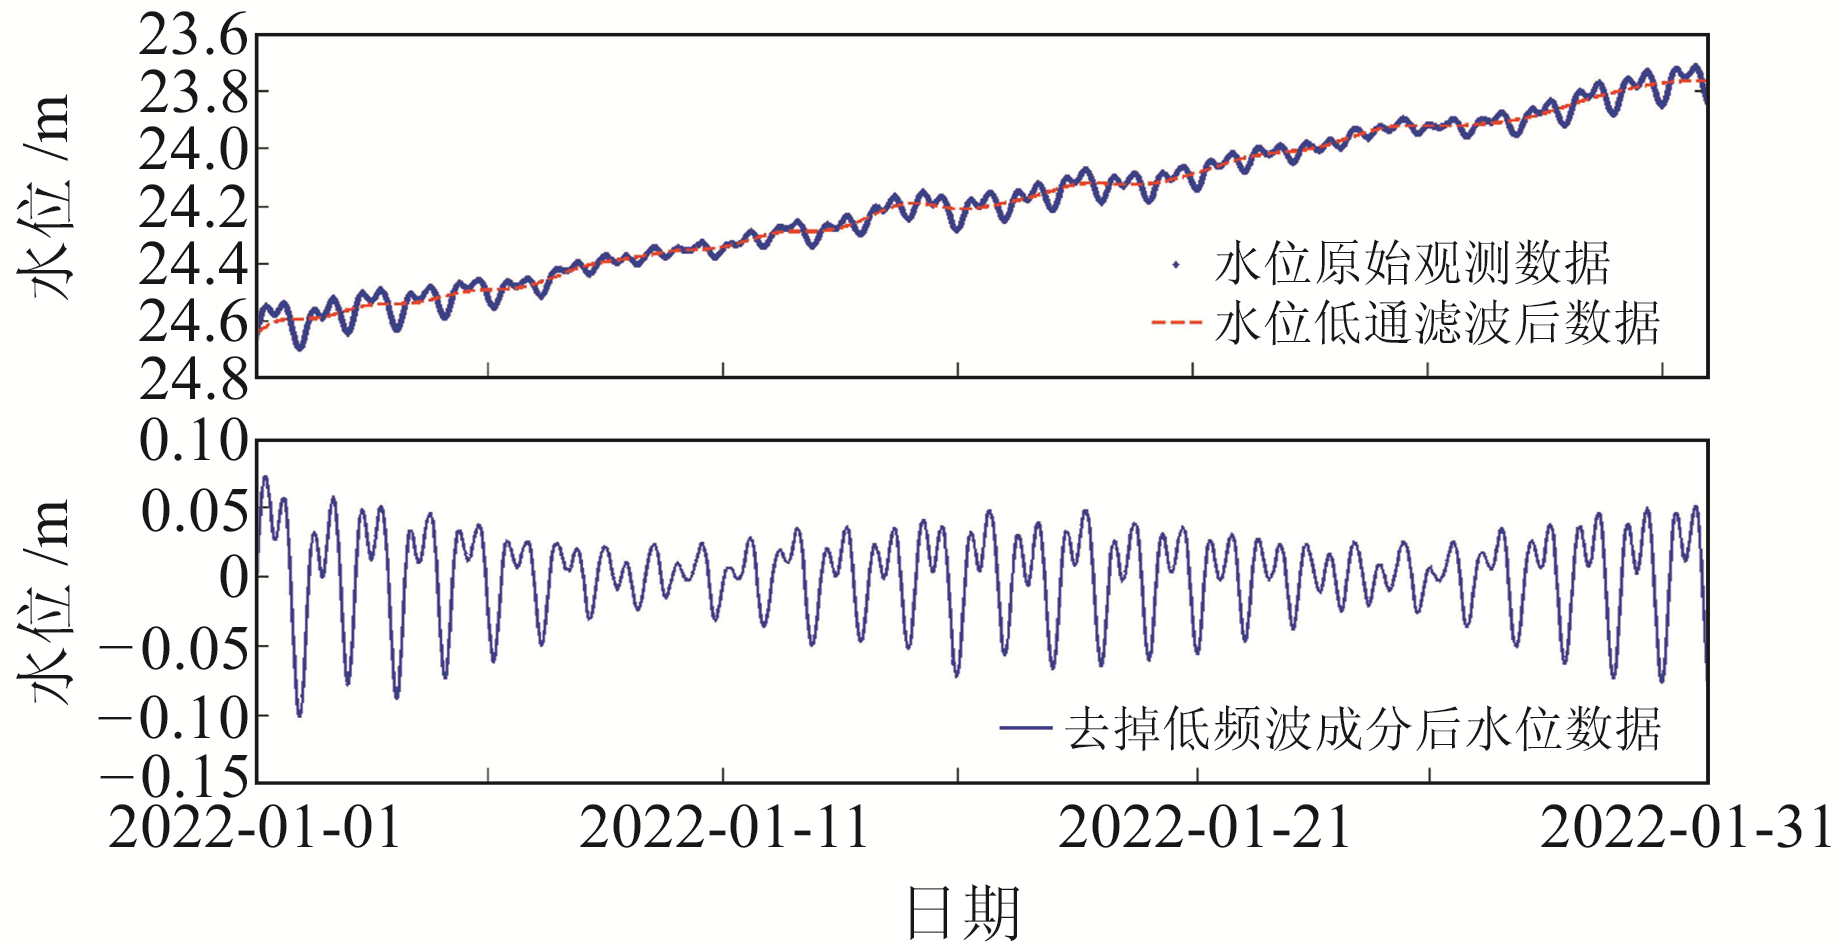
将水位原始数据通过取均值方法[3]降采样率为1次/10 min,低通滤波取截止频率fc=1/(24 ·60 ·60 ·2),图 2为低通滤波后产品。

|
图 2 井水位低通滤波及残差 Fig. 2 Low pass filtering and residual error of groundwater level |
td =[]; %按台站信息求出重力潮汐理论值
for i=1:length(dates)
td=[td H_gravity_earthtide(dates(i), stationlongitude, stationlatitude)];
end
figure(2);
subplot(221);
plottwo(dates, ddata, td, 'reverse', 'normal', '水位(m)', '重力潮汐(uGal)', '日期(2022年)',
datenum(0, 0, 5), 'mm/dd');
subplot(222);
plot(td, ddata, '*'); hold on;
x=[td' ones(1, length(td))'];
y=ddata';
[b, bint, r, rint, stats]=regress(y, x, 0.05);
x=-170:10:100;
y=b(1).*x+b(2);
plot(x, y, 'r-', 'linewidth', 2); hold off;
set(gca, 'xlim', [-170 100], 'xtick', -170:20:100);
xlabel('重力潮汐(uGal)', 'fontsize', 12, 'fontweight', 'bold');
ylabel('水位(m)', 'fontsize', 12, 'fontweight', 'bold');
strtemp=sprintf('y=%.06f*x+%.04f', b(1), b(2));
text(-70, 0.1, strtemp, 'fontsize', 12, 'fontweight', 'bold');
采用自定义的H_gravity_earthtide计算重力潮汐理论值。通过MATLAB自带的regress完成一元线性回归,可通过stats查询回归结果,在本实例中得到回归结果R2=0.930 2,说明回归效果非常理想。求得潮汐因子为-0.000 479 m/μGal,负号是由于水位为静水位数据,其数值大小与重力潮汐呈负相关(图 3)。

|
图 3 井水位潮汐因子计算 Fig. 3 The tidal factor calculating of groundwater level |
figure(3);
sw_eliminate_td=detrend(sw-(b(1).*td+b(2))); %剔除潮汐干扰
qytemp=qy(1:144*3);%计算水位与气压最大相关系数,确定气压效应滞后时间
cor=[];
for i=1:1:20
swtemp=sw_eliminate_td(i: i+144*3-1);
cor=[cor min(min(corrcoef(swtemp, qytemp)))];
end
[val pos]=max(cor);
subplot(221);
plottwo(dates(pos: end), sw_eliminate_td(pos: end), qy(1:end-pos+1), 'reverse', 'reverse', '水位(m)', '气压(hPa)', '日期(2022年)', datenum(0, 0, 5), 'mm/dd');
swtemp=sw_eliminate_td(pos: end);
qytemp=qy(1:end-pos+1);
x=[qytemp' ones(1, length(qytemp))'];
y=swtemp';
[b, bint, r, rint, stats]=regress(y, x, 0.05);
subplot(222);
plot(qytemp, swtemp, '*'); hold on;
x=1008:1027;
y=b(1)*x+b(2);
plot(x, y, 'r-', 'linewidth', 2); hold off;
xlabel('气压(hPa)', 'fontsize', 12, 'fontweight', 'bold');
ylabel('水位(m)', 'fontsize', 12, 'fontweight', 'bold');
strtemp=sprintf('y=%.06f*x+%.04f', b(1), b(2));
text(1016, -0.04, strtemp, 'fontsize', 12, 'fontweight', 'bold');
x=qytemp;
y=swtemp-(b(1)*qytemp+b(2));
subplot(212);
plot(dates(pos: end), y, 'linewidth', 2);
[xmin, xmax, xtk, xtkl]=GetXInfo(dates(pos: end), datenum(0, 0, 5), 'mm/dd');
set(gca, 'xlim', [xmin xmax], 'xtick', xtk, 'xticklabel', xtkl, 'fontsize', 12, 'fontweight', 'bold', 'ydir', 'reverse');
text(datenum(2022, 1, 15, 19, 30, 0), -0.01, '\downarrow汤加火山', 'color', 'r', 'fontsize', 12, 'fontweight', 'bold');
采用查找最大相关系数方法,先求取气压效应的滞后时间,本例中气压效应滞后时间pos=6,采样率为1次/10 min,即气压效应滞后时间为60 min。利用相同线性回归求得气压因子为0.004 631 m/hPa。通过去除气压效应,可清晰观察到原来隐藏在观测数据中的汤加火山爆发事件(图 4)。

|
图 4 井水位气压因子计算及最终井水位动态 Fig. 4 The barometric factor calculating of groundwater level and the final groundwater level dynamics |
重力潮汐理论值的计算原理与计算过程可参考文献[4-5],但上述文献未给出详细的MATLAB实现,本文在此提供。
function Gg=H_gravity_earthtide(date, longtitude, latitude)
longtitude=longtitude * pi/180;
latitude=latitude * pi/180;
Phi=latitude;
Phip=atan(power(1-1/298.256, 2)*tan(Phi));
[y, m, d, HH, MM, SS]=datevec(date);
t=HH+MM/60+SS/3600;
T0=juliandate(y, m, d, 0, 0, 0);
T=(T0-2451545.0+(t-8)/24)/36525;
S=218.31643+481267.88128*T-0.00161*power(T, 2)+0.000005 * power(T, 3);
H=280.46607+36000.76980*T+0.00030*power(T, 2);
P=83.35345+4069.01388*T-0.01031*power(T, 2)-0.000001*power(T, 3);
N=125.04452-1934.13626*T+0.00207*power(T, 2)+0.000002*power(T, 3);
Ps=282.93835+1.71946*T+0.00046*power(T, 2)+0.000003*power(T, 3);
sigma=23.43929-0.01300*T-0.000000167*power(T, 2)+0.0000005*power(T, 3);
S=S * pi/180;
H=H * pi/180;
P=P * pi/180;
N=N * pi/180;
Ps=Ps * pi/180;
sigma=sigma * pi/180;
Cm_Rm=1+0.01*cos(S-2*H+P)+0.0545*cos(S-P)+0.0030*cos(2*S-2*P)+0.0009*cos(3*S-2*H-P)...
+0.0006*cos(2*S-3*H+Ps)+0.0082*cos(2*S-2*H);
Lambdam=S-0.00324*sin(H-Ps)-0.00103*sin(2*H-2*P)+0.001*sin(S-3*H+P+Ps)+0.02224*sin(S-2*H+P)...
+0.00072*sin(S-H-P+Ps)-0.00061*sin(S-H)+0.10976*sin(S-P)-0.00053*sin(S+H-P-Ps)...
+0.0008*sin(2*S-3*H+Ps)+0.01149*sin(2*S-2*H)+0.00373*sin(2*S-2*P)-0.002*sin(2*S-2*N)+0.00093*sin(3*S-2*H-P);
Beltam=-0.00485*sin(P-N) -0.00081*sin(2*H-P-N)+0.00303*sin(S-2*H+N)+0.0895*sin(S-N)+0.00097*sin(2*S-2*H+P-N)...
+0.0049*sin(2*S-P-N)+0.00057*sin(3*S-2*H-N);
Cs_Rs=1+0.0168*cos(H-Ps)+0.0003*cos(2*H-2*Ps);
Lambdas=H+0.0335*sin(H-Ps)+0.0004*sin(2*H-2*Ps);
Theta =((t-8)*15*pi/180)+H+longtitude-pi;
sinDeltam=sin(sigma)*sin(Lambdam)*cos(Beltam)+cos(sigma)*sin(Beltam);
cosDeltamcosTaum=cos(Beltam)*cos(Lambdam)*cos(Theta)...
+sin(Theta)*(cos(sigma)*cos(Beltam)*sin(Lambdam)-sin(sigma)*sin(Beltam));
sinDeltas=sin(sigma)*sin(Lambdas);
cosDeltascosTaus=cos(Lambdas)*cos(Theta)+sin(Theta)*cos(sigma)*sin(Lambdas);
cosZm=sin(Phip)*sinDeltam+cos(Phip)*cosDeltamcosTaum;
cosZs=sin(Phip)*sinDeltas+cos(Phip)*cosDeltascosTaus;
F_Phi=0.998327+0.00167*cos(2*Phi);
Gg=-165.17*F_Phi* power(Cm_Rm, 3) *(power(cosZm, 2)-1.0/3.0)...
- 1.3708 * F_Phi * F_Phi * power(Cm_Rm, 4) *(5*power(cosZm, 3)-3*cosZm)...
-76.08*F_Phi*power(Cs_Rs, 3)*(power(cosZs, 2)-1.0/3.0);
end
3 结语通过上述过程,可自动计算井水位潮汐因子、气压因子。通过剔除井水位潮汐干扰与气压干扰,可清晰地观测到隐藏在井水位原始观测数据中由汤加火山爆发引发的气压扰动事件。
从图 4最终产品可知,井水位动态中仍然可清晰地看到潮汐成分,这与井水位潮汐和气压响应原理有关,两者之间并非简单的线性关系,存在时间滞后,且响应不是一个时间点,而是一个作用过程。另外,气压动态自身包含潮汐作用力,因此将潮汐与气压分两步进行剔除会引入气压分量中的潮汐作用力,这在上述计算过程中无法避免。要解决该问题,需采用多元线性、偏最小二乘法、卷积等其他回归算法,在此不过多讨论,详细过程可参考文献[2]。
| [1] |
刘阳, 何案华, 赵刚, 等. 地下水位中潮汐与气压效应分析[J]. 大地测量与地球动力学, 2016, 36(12): 1 112-1 116 (Liu Yang, He Anhua, Zhao Gang, et al. Analysis of Tidal and Atmospheric Pressure Effects in the Water Level[J]. Journal of Geodesy and Geodynamics, 2016, 36(12): 1 112-1 116)
(  0) 0) |
| [2] |
He A H, Singh R P, Sun Z H, et al. Comparison of Regression Methods to Compute Atmospheric Pressure and Earth Tidal Coefficients in Water Level Associated with Wenchuan Earthquake of 12 May 2008[J]. Pure and Applied Geophysics, 2016, 173(7): 2 277-2 294 DOI:10.1007/s00024-016-1310-3
(  0) 0) |
| [3] |
何案华, 王言章. MATLAB在地下流体数据分析中的基础应用[J]. 大地测量与地球动力学, 2019, 39(9): 966-970 (He Anhua, Wang Yanzhang. The Basic Application of MATLAB in Analyzing the Observational Data of Underground Fluid[J]. Journal of Geodesy and Geodynamics, 2019, 39(9): 966-970)
(  0) 0) |
| [4] |
董良, 彭芳苹, 杨涛, 等. 利用新参数和软件改进重力固体潮计算程序[J]. 地球物理学进展, 2015, 30(1): 421-424 (Dong Liang, Peng Fangping, Yang Tao, et al. To Improve the Earthtide Calculating Program by New Parameters within Software[J]. Progress in Geophysics, 2015, 30(1): 421-424)
(  0) 0) |
| [5] |
闫如玉, 万永革, 解朝娣, 等. 基于MATLAB GUI的全球重力固体潮可视化实现[J]. 地震地磁观测与研究, 2019, 40(3): 160-167 (Yan Ruyu, Wan Yongge, Xie Chaodi, et al. Visualization of Gravity Earth Tides Based on MATLAB GUI[J]. Seismological and Geomagnetic Observation and Research, 2019, 40(3): 160-167)
(  0) 0) |
2. College of Instrumentation and Electrical Engineering, Jilin University, 938 Minzhu Street, Changchun 130026, China;
3. National Institute of Natural Hazards, MEM, 1 Anningzhuang Road, Beijing 100085, China
 2023, Vol. 43


