地壳垂直形变是三维形变监测的重要内容,对研究区域沉降、地壳演化和断裂活动等具有重要意义。近年来随着GPS技术的不断发展,除利用水准方法研究地壳垂直形变外,基于GPS观测资料研究地壳垂直形变也越来越多[1-4]。GPS信号在传播过程中受各种因素影响,其垂直形变误差是水平方向的2~5倍。研究结果表明[5-8],虽然GPS在垂直方向的定位误差较大,但连续观测5~10 a可使精度优于1 mm/a。由于连续GPS观测站点的建设和维护成本较高,站点稀疏,区域地壳垂直形变监测的空间分辨率有限,近年来许多学者将GPS流动站观测资料用于地壳垂直形变监测[2, 9-11]。但流动GPS观测资料能否准确反映地壳垂直形变特征以及观测精度都尚不明确,因此对流动GPS观测资料获取的垂直形变速率的精度进行定量分析具有重要意义。
中国大陆受到印度洋板块严重碰撞和持续挤压,同时中国断裂带错综复杂且板内地壳构造活动较多,使得中国成为全球板块及板内地壳构造运动最强烈的地区之一[12-15]。板块和板内运动会使地壳发生沉降和隆升,同时依靠中国地壳运动观测网络和中国大陆构造环境监测网络(简称陆态网络)已陆续建立260个连续站和2 000个流动站,并已观测近10~20 a,上述条件可为定量评定流动GPS观测垂直形变的精度提供可能。以往大多采用坐标时间序列的重复性精度(WRMS)和GPS速度场误差来评定流动GPS观测资料的定位精度[2-3, 10],但该方法只能评定内符合精度,无法判断数据的准确性。如垂直形变的重复性精度和速率误差都较小而形变方向出现错误时,无法采用上述方法进行评定,因此需要一个外部基准来作对比。
本文对中国大陆260个基准站和2 000个流动站1999~2019年的观测数据进行高精度处理,并从260个基准站中挑选站点稳定、观测资料完整的连续站作为垂直形变速率精度评定的基准。然后选取距离各连续站最近的流动站作为本次评定的对象,通过对挑选的流动站与连续站的垂直形变速率结果进行对比,讨论分析流动GPS观测资料能否用于地壳垂直形变监测。
1 数据和方法 1.1 GPS资料和数据处理本文GPS数据主要包括陆态网络中260个基准站和2 000个流动站的观测数据(图 1),其中25个基准站和1 000个流动站的观测时间为1999~2019年,其他站点的观测时间为2010~2019年。260个基准站为连续观测,而流动站则存在差异,部分站点每年观测1次(如南北地震带、天山、青藏高原等地区),部分站点为每隔1 a观测1次(如华北、华南、东北等地区),每次至少观测4 d。

|
图 1 陆态网络GPS站点分布 Fig. 1 Distribution of GPS stations of CMONOC |
GPS数据处理采用GAMIT/GLOBK 10.7软件[16]。数据处理主要步骤为: 1)利用GAMIT获得测站和卫星轨道的单日区域松弛解,单日解包含测站、极移、天顶对流层延迟、卫星相位中心偏差以及卫星参数的松弛解和方差-协方差矩阵; 2)利用GLOBK将区域松弛解与SOPAC(scripps orbital and permanent array center)产出的全球IGS站的单日松弛解进行合并,得到包含全球IGS站和陆态网络站的单日松弛解; 3)在全球范围内选择用于实现参考框架转换的参考站,将全球单日松弛解作为准观测值,利用GLOBK通过7参数(3个平移参数、3个旋转参数和1个尺度因子)相似变换得到ITRF2014参考框架下的单日坐标解(结果见www.cgps.ac.cn); 4)对时间序列中出现的同震形变及阶跃进行估计改正,利用最小二乘法对坐标时间序列进行估计,得到站点的三维速度场。
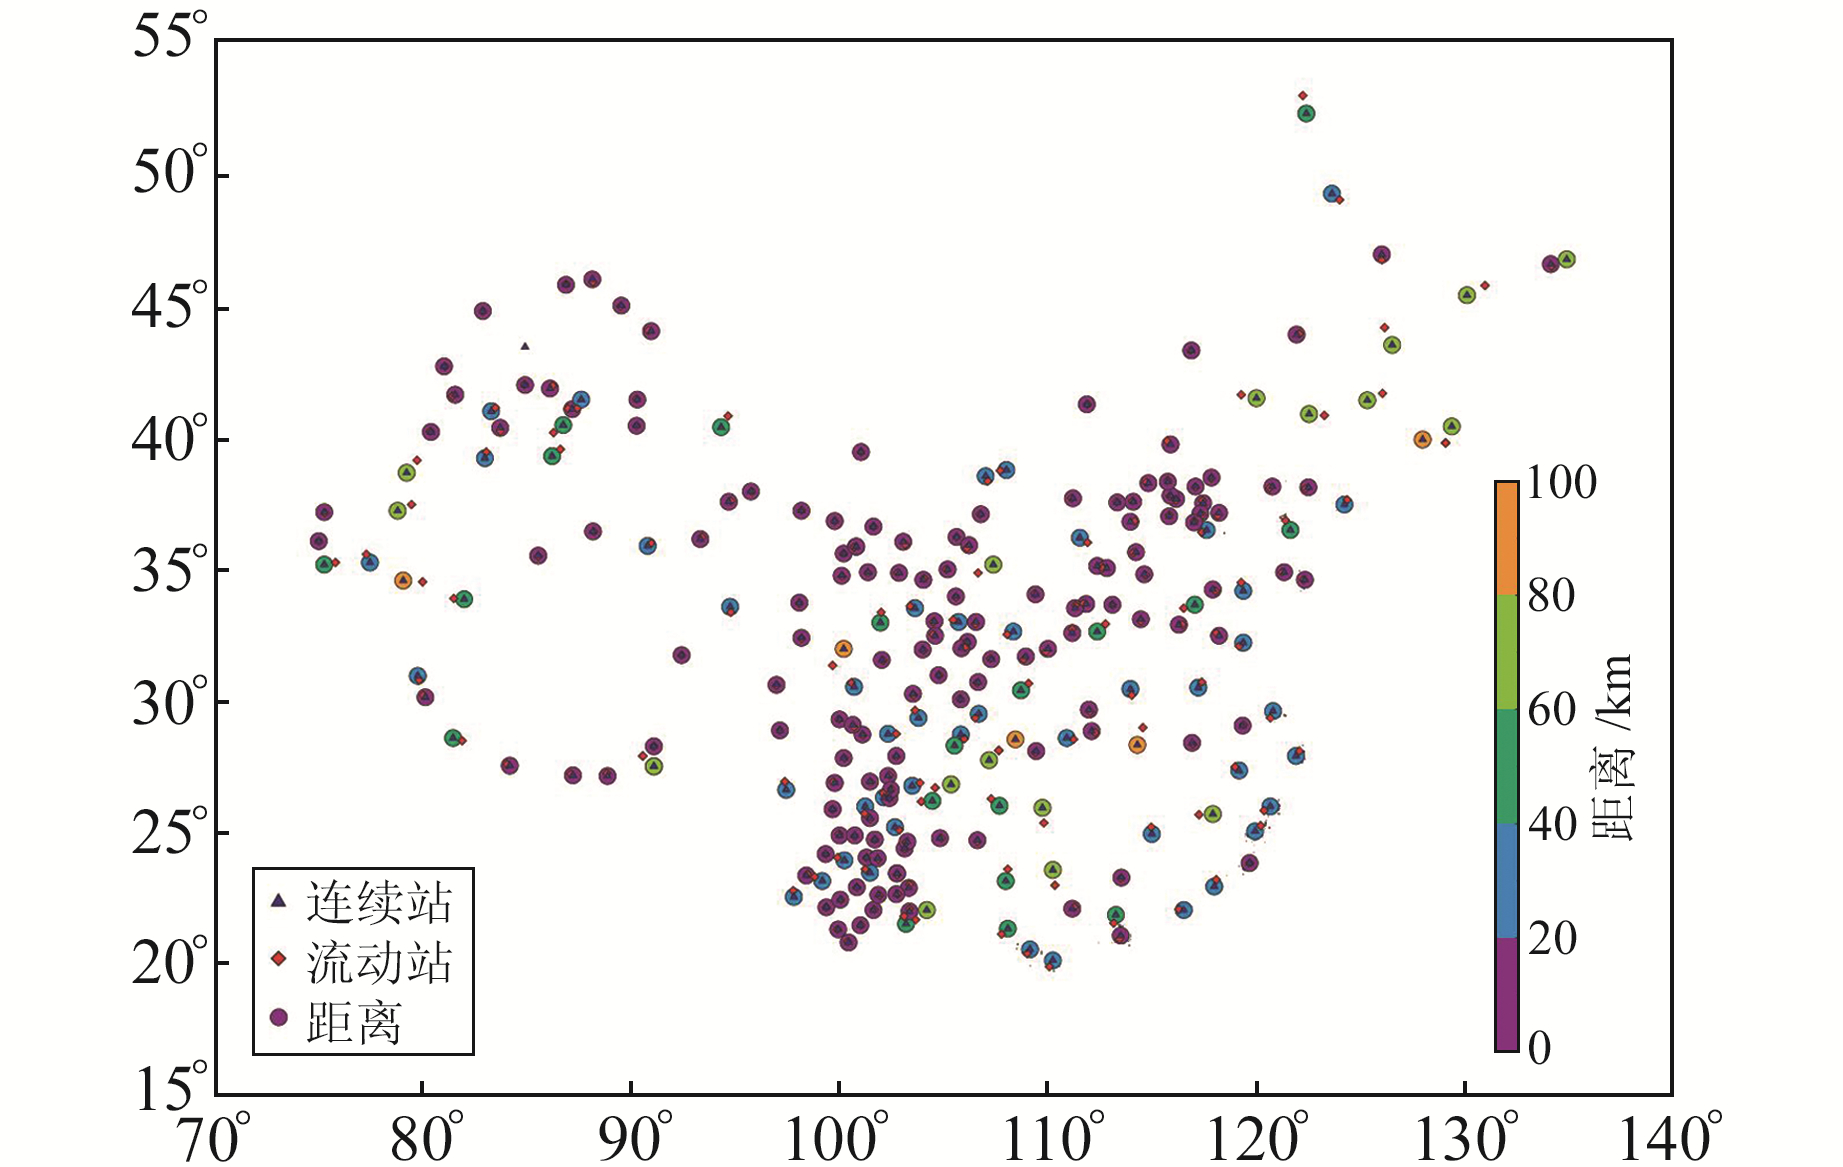
1.2 GPS站点筛选中国大陆GPS水平形变速率较大,因此N、E向坐标时间序列的阶跃或起伏对速度场的结果影响较小。而垂直形变速率与水平形变速率不同,垂直形变速率较小,小幅阶跃或波动都会对其产生一定影响。因此本文对全国260个基准站的GPS时间序列进行筛选,剔除不稳定和观测质量差的站点,并对所有的阶跃进行估计,最终确定226个陆态网络基准站作为本文垂直形变的基准(图 2)。由于基准站密度较低,利用插值法估计GPS流动站的垂直形变并不准确。而垂直形变一般具有区域一致性[17-18],因此本文认为在流动站与基准站距离较近时,其垂直形变的方向和大小具有一致性和可比性。根据基准站和流动站的经纬度坐标,计算得到距离各基准站最近的GPS流动站(图 2)。为验证筛选出的GPS流动站的稳定性较好,除对其时间序列进行筛选外,也对基准站和流动站的水平速度场结果进行比较。从图 3可以看出,上述站点的水平速度场结果一致性较好,说明流动GPS观测站水平方向的稳定性较好,未发生观测墩破坏等。因此本文选取上述226个基准站和226个流动站用于定量分析垂直形变速率精度。

|
图 2 筛选出的226个GPS基准站和距离各基准站最近的226个流动站的位置和距离 Fig. 2 Distribution and distance of 226 selected GPS reference stations and 226 campaign stations closest to each reference station |

|
图 3 GPS站点的水平速度场(相对于欧亚板块) Fig. 3 Horizontal velocity field of selected GPS stations(relative to Eurasian plate) |
本文选取的226个GPS基准站获得的垂直形变速度场可很好地展示中国大陆现今隆升和沉降特征(图 4)。从图中可以看出,中国大陆沉降区主要分布于华南、云南、青海和塔里木盆地等区域,隆升区主要分布于新疆天山、山西裂谷带和甘肃等地区。连续站垂直形变速率的统计结果显示,95%的连续站的垂直形变速率误差小于0.5 mm/a,93%的垂直形变速率在-2.0~2.0 mm/a之间。中国大陆隆升地区的平均隆升速率为0.4 mm/a,沉降地区的平均下沉速率为0.5 mm/a。

|
图 4 226个基准站的垂直形变场与误差统计 Fig. 4 The statistics of vertical deformation field and error of 226 reference stations |
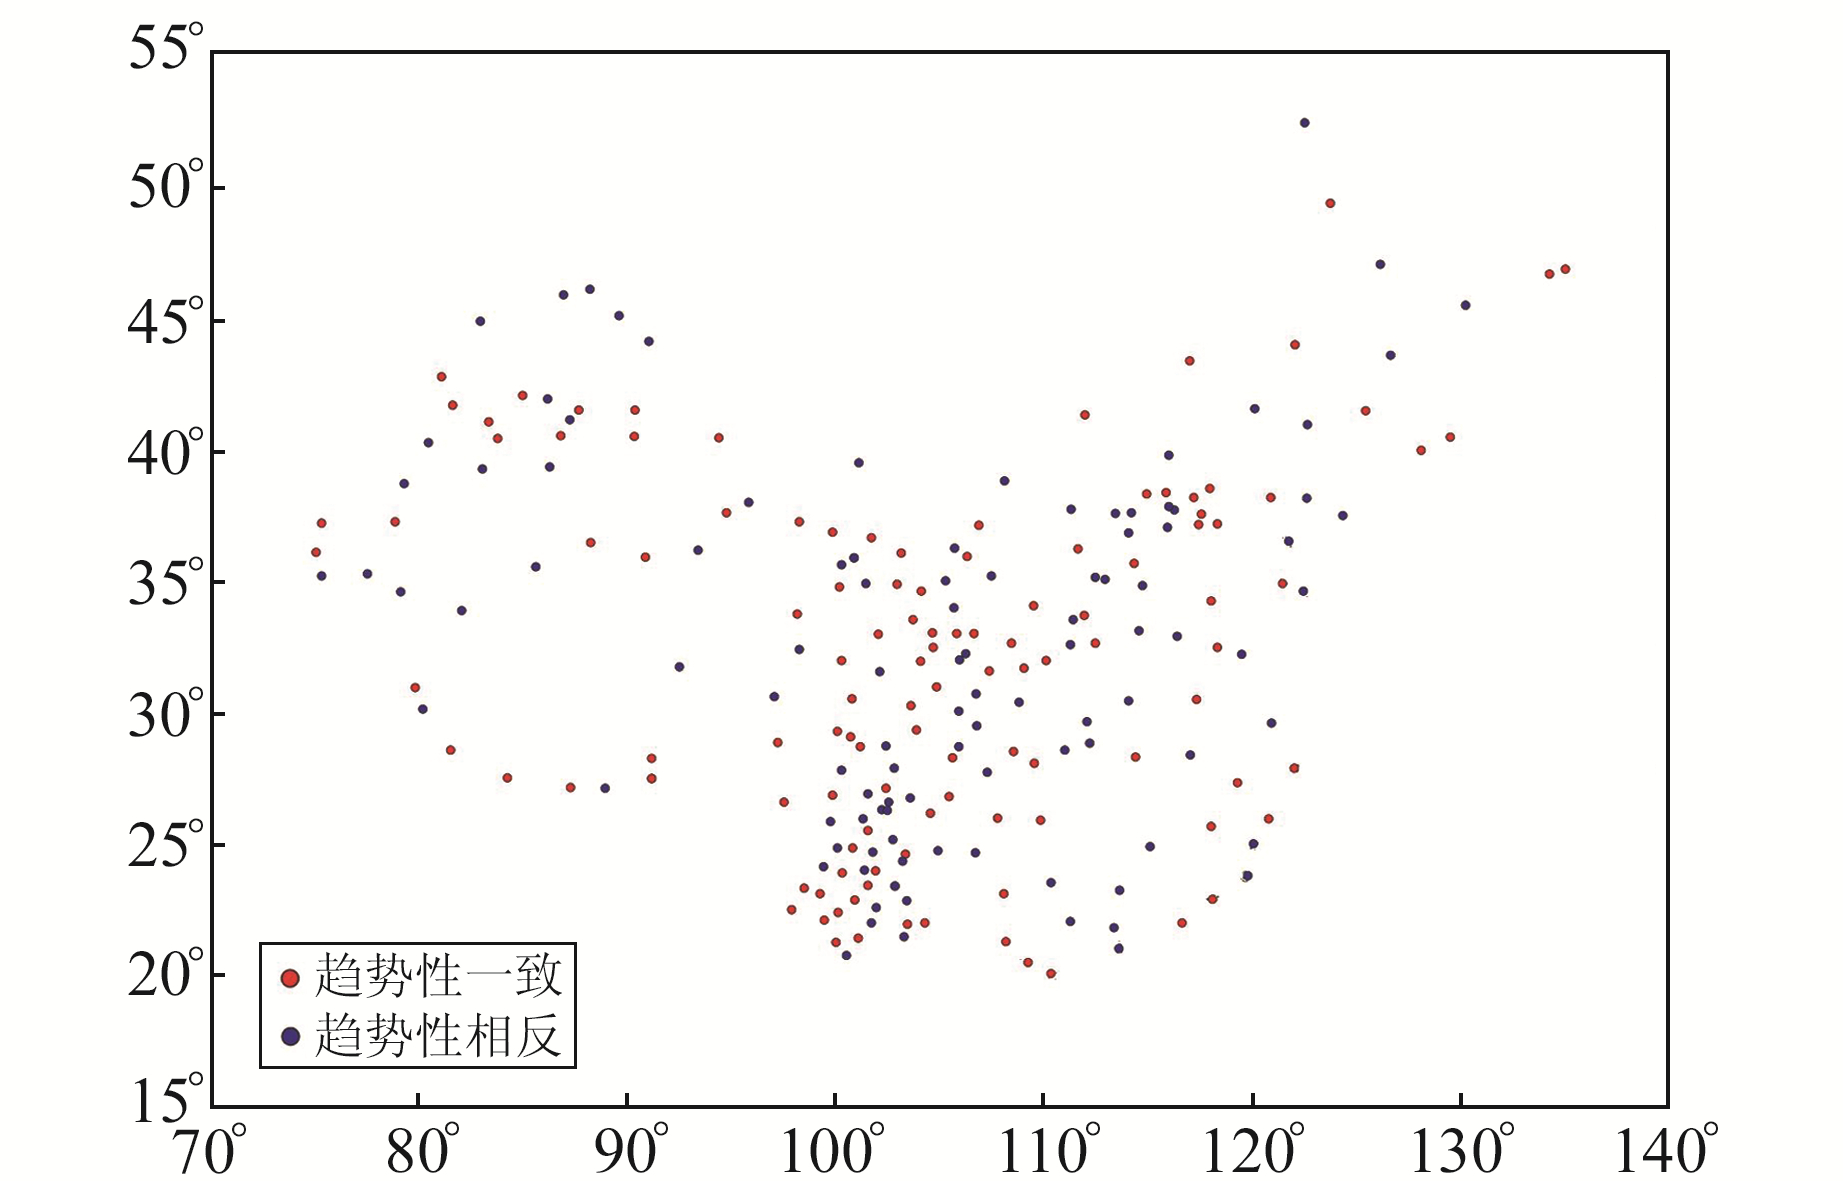
筛选出的226个GPS流动站监测的垂直形变速度场与基准站结果存在差异。从图 5可以看出,中国大陆沉降和隆升交错分布,不具有明显的区域特征,如华南块体内部既有隆升也有沉降。由速度场误差可以看出,GPS流动观测站的垂直形变速率误差大部分约为1 mm/a。为更加清晰地显示流动站与连续站在中国大陆垂直形变监测中的差异,图 6为基准站与流动站的垂直形变速率残差结果。从图中可以看出,残差较大的区域主要为华南、华北和川滇地区。对流动站和连续站的垂直形变速率残差进行统计分析发现,残差在-1.0~1.0 mm/a的站点约占40%,-2.0~2.0 mm/a约占62%。趋势性统计结果表明,仅51%的流动站的垂直形变趋势与连续站相同(图 7)。

|
图 5 226个流动站的垂直形变场与误差统计 Fig. 5 The statistics of vertical deformation field and error of 226 campaign stations |

|
图 6 基准站与流动站的垂直形变速度场残差及其占比 Fig. 6 The residual of vertical deformation velocity field between reference station and campaign station and its proportion |

|
图 7 基准站与流动站的垂直形变趋势性分析 Fig. 7 Trend analysis of vertical deformation between reference station and campaign station |
根据GPS流动站的建站和观测情况分析认为,影响上述流动观测站点垂直形变速率精度的因素可能包括流动GPS观测时间跨度、流动站与基准站的距离以及地区复杂程度。由上文可知,仅51%的流动站的垂直形变趋势与基准站相同,而流动站的观测时间跨度为10 a或20 a,与基准站的距离大部分在0~40 km范围内,最大距离约100 km; 中国跨经度约70°,且内部地形复杂多变,包含高原、盆地、平原、山岭、河谷等,因此本文将残差结果与GPS观测时间跨度、流动站与基准站的距离和分布区域分别进行统计(图 8)。由图 8(a)可以看出,观测时间跨度与残差并无明显相关性,即使观测时间跨度为20 a也存在较大残差。由图 8(b)可以看出,大部分流动站与连续站的距离小于40 km,距离大小与残差值无明显相关性。由图 8(c)可以看出,以经度100°为界,西部地区残差值普遍小于东部。由图 7也可以看出,西部基准站与流动站垂直形变趋势一致的比例高于东部。

|
图 8 速度场残差与流动站观测时间跨度、流动站与基准站距离、地区分布的关系 Fig. 8 The relationship between velocity field residuals and observation time span of campaign station, distance between campaign station and reference station, area distribution |
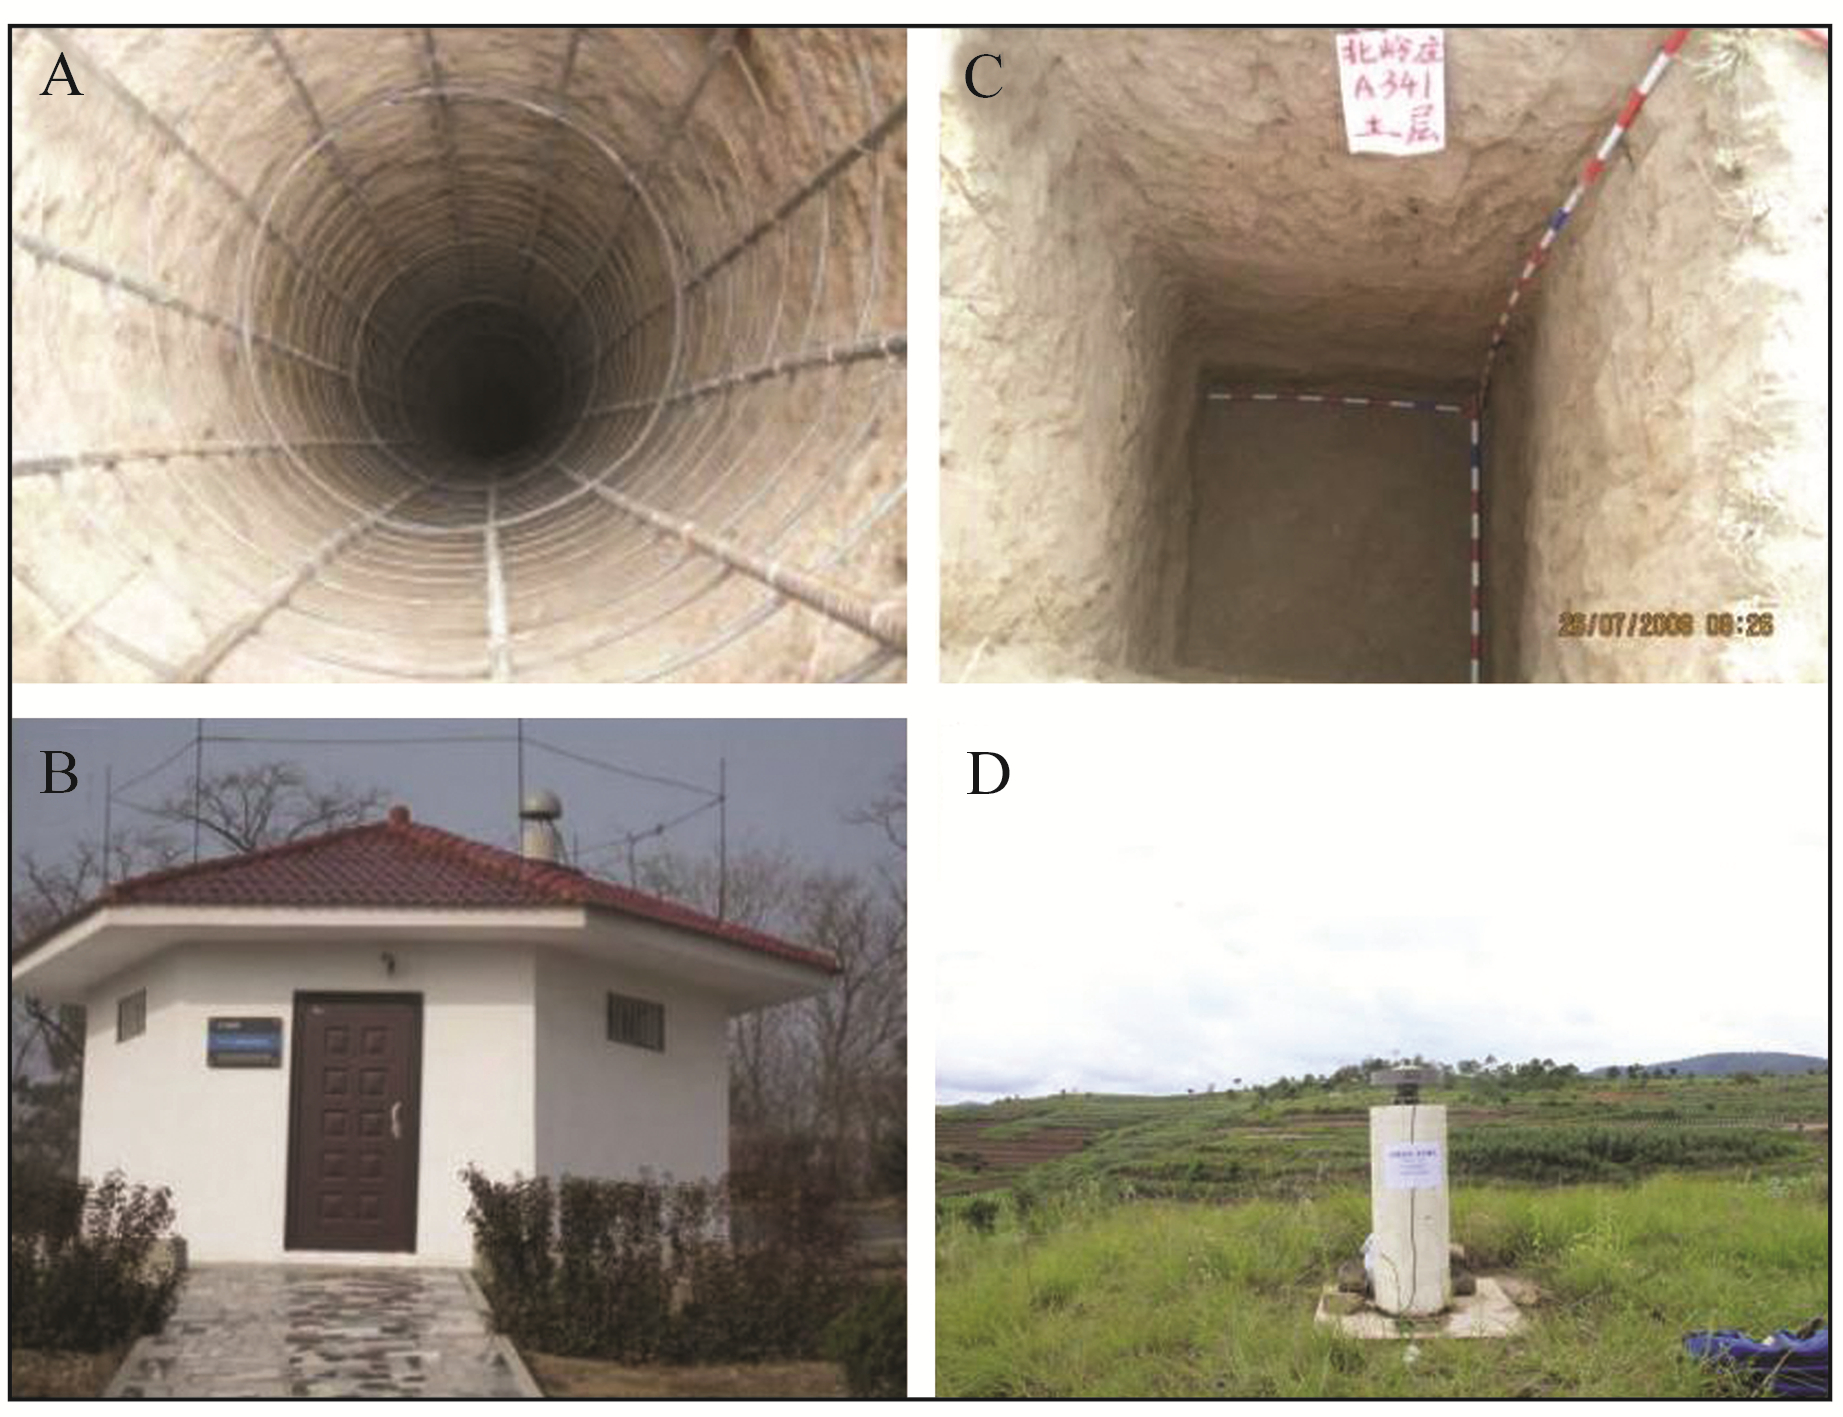
为分析导致GPS流动观测东西部差异较大的原因,本文对基准站和流动站的站点建设情况进行调查发现,基准站基本都建立在基岩之上,且观测环境较好; 而流动站基坑较浅,大部分站点未建在基岩之上,尤其在东部地区(图 9)。同时,西部地区植被较稀疏、低矮,东部地区植被高大、密集,在GPS流动观测时东部站点的信号遮挡较严重,这也可能导致残差较大。

|
图 9 基准站与流动站的观测墩建设情况 Fig. 9 The construction of observation pier of referencestation and campaign station |
中国大陆大部分区域的垂直形变速率小于2 mm/a,而40%的GPS流动站的垂直形变速率精度在2 mm/a以上,约50%的流动站的垂直形变趋势与连续站不同,表明GPS流动观测资料获取的垂直形变特征在中国大陆大部分地区不准确,因此本文不建议利用GPS流动观测资料监测中国大陆垂直形变小于2 mm/a的地区。
4 结语本文对比分析筛选出的中国大陆226个陆态网络连续站和距离各连续站最近的226个GPS流动站的垂直形变速率认为: 1)GPS连续站的垂直形变速度场精度远高于GPS流动站; 2)GPS连续站与流动站的垂直形变速率残差值约40%大于2 mm/a,且约50%的GPS流动站的垂直形变趋势与连续站相反; 3)以100°E为界,西部地区GPS流动站的垂直形变速度场精度比东部地区高,可能与西部地区的观测环境和站点稳定性较好有关; 4)由GPS流动站的垂直形变速度场精度、流动站与连续站残差和趋势性分析结果认为,中国大陆GPS流动观测资料不适合监测垂直形变小于2 mm/a的地区。
| [1] |
Fu Y N, Freymueller J T. Seasonal and Long-Term Vertical Deformation in the Nepal Himalaya Constrained by GPS and GRACE Measurements[J]. Journal of Geophysical Research: Solid Earth, 2012, 117(B3)
(  0) 0) |
| [2] |
赵斌, 聂兆生, 黄勇, 等. 大规模GPS揭示的华北地区现今垂直运动[J]. 大地测量与地球动力学, 2014, 34(5): 35-39 (Zhao Bin, Nie Zhaosheng, Huang Yong, et al. Vertical Motion of North China Inferred from Dense GPS Measurements[J]. Journal of Geodesy and Geodynamics, 2014, 34(5): 35-39)
(  0) 0) |
| [3] |
Bruton A M, Glennie C L, Schwarz K P. Differentiation for High-Precision GPS Velocity and Acceleration Determination[J]. GPS Solutions, 1999, 2(4): 7-21 DOI:10.1007/PL00012771
(  0) 0) |
| [4] |
Qin S L, Wang W P, Song S W. Comparative Study on Vertical Deformation Based on GPS and Leveling Data[J]. Geodesy and Geodynamics, 2018, 9(2): 115-120 DOI:10.1016/j.geog.2017.07.005
(  0) 0) |
| [5] |
Milne G A, Davis J L, Mitrovica J X, et al. Space-Geodetic Constraints on Glacial Isostatic Adjustment in Fennoscandia[J]. Science, 2001, 291(5 512): 2 381-2 385
(  0) 0) |
| [6] |
Bennett R A, Hreinsdóttir S. Constraints on Vertical Crustal Motion for Long Baselines in the Central Mediterranean Region Using Continuous GPS[J]. Earth and Planetary Science Letters, 2007, 257(3-4): 419-434 DOI:10.1016/j.epsl.2007.03.008
(  0) 0) |
| [7] |
Beavan J, Denys P, Denham M, et al. Distribution of Present-Day Vertical Deformation across the Southern Alps, New Zealand, from 10 Years of GPS Data[J]. Geophysical Research Letters, 2010, 37(16)
(  0) 0) |
| [8] |
Wu P, Steffen H, Wang H S. Optimal Locations for GPS Measurements in North America and Northern Europe for Constraining Glacial Isostatic Adjustment[J]. Geophysical Journal International, 2010, 181(2): 653-664
(  0) 0) |
| [9] |
Grenerczy G, Kenyeres A, Fejes I. Present Crustal Movement and Strain Distribution in Central Europe Inferred from GPS Measurements[J]. Journal of Geophysical Research: Solid Earth, 2000, 105(B9): 21 835-21 846 DOI:10.1029/2000JB900127
(  0) 0) |
| [10] |
Davis J L, Bennett R A, Wernicke B P. Assessment of GPS Velocity Accuracy for the Basin and Range Geodetic Network(BARGEN)[J]. Geophysical Research Letters, 2003, 30(7): 1 411
(  0) 0) |
| [11] |
Zhao Q, Wu W W, Wu Y L. Using Combined GRACE and GPS Data to Investigate the Vertical Crustal Deformation at the Northeastern Margin of the Tibetan Plateau[J]. Journal of Asian Earth Sciences, 2017, 134: 122-129 DOI:10.1016/j.jseaes.2016.11.010
(  0) 0) |
| [12] |
Zhang Z J, Chen Q F, Bai Z M, et al. Crustal Structure and Extensional Deformation of Thinned Lithosphere in Northern China[J]. Tectonophysics, 2011, 508(1-4): 62-72 DOI:10.1016/j.tecto.2010.06.021
(  0) 0) |
| [13] |
黄立人, 王敏. 中国大陆构造块体的现今活动和变形[J]. 地震地质, 2003, 25(1): 23-32 (Huang Liren, Wang Min. Present-Day Activity and Deformation of Tectonic Blocks in China's Continent[J]. Seismology and Geology, 2003, 25(1): 23-32)
(  0) 0) |
| [14] |
李延兴, 杨国华, 李智, 等. 中国大陆活动地块的运动与应变状态[J]. 中国科学: 地球科学, 2003, 33(增1): 65-81 (Li Yanxing, Yang Guohua, Li Zhi, et al. Movement and Strain State of Active Blocks in China Mainland[J]. Science China: Earth Science, 2003, 33(S1): 65-81)
(  0) 0) |
| [15] |
Wang J, Ye Z R, He J K. Three-Dimensional Mechanical Modeling of Large-Scale Crustal Deformation in China Constrained by the GPS Velocity Field[J]. Tectonophysics, 2008, 446(1-4): 51-60 DOI:10.1016/j.tecto.2007.11.006
(  0) 0) |
| [16] |
Herring T A, King R W, McClusky S C. GLOBK Reference Mannual: Global Kalman Filter VLBI and GPS Analysis Program, Release 10.7[Z]. Cambridge: Massachusetts Institute of Technology, 2018
(  0) 0) |
| [17] |
陈超, 邹蓉, 刘任莉. 联合GPS和GRACE研究青藏高原南部地区垂直形变的季节性波动[J]. 武汉大学学报: 信息科学版, 2018, 43(5): 669-675 (Chen Chao, Zou Rong, Liu Renli. Vertical Deformation of Seasonal Hydrological Loading in Southern Tibet Detected by Joint Analysis of GPS and GRACE[J]. Geomatics and Information Science of Wuhan University, 2018, 43(5): 669-675)
(  0) 0) |
| [18] |
Ching K E, Hsieh M L, Johnson K M, et al. Modern Vertical Deformation Rates and Mountain Building in Taiwan from Precise Leveling and Continuous GPS Observations, 2000-2008[J]. Journal of Geophysical Research: Solid Earth, 2011, 116(B8)
(  0) 0) |
 2021, Vol. 41

