2. 资源环境与灾害监测山西省重点实验室,山西省晋中市迎宾西街380号,030600;
3. 钱学森空间技术实验室,北京市友谊路104号,100094
在重力场的各元素中,重力梯度是重力位的2阶导数,能够反映重力场在空间内的变化率,具有比重力更好的分辨率[1-2],在探测浅层物体方面更具有优势。目前已经有不少学者利用重力梯度探测物体的轮廓、位置和质量[3-7]。也有学者研究了将物体视为点源,从而利用重力异常和重力梯度反演物体的位置及质量[8-11]。
本文以潜艇为例,正演出潜艇上方的重力梯度,分析各梯度极值点的分布,用最小二乘法拟合各重力梯度分量极值与潜艇到观测点垂直距离间的函数关系,并根据上述关系反演潜艇深度,最后通过在极值点坐标中加入误差验证算法的稳健性。
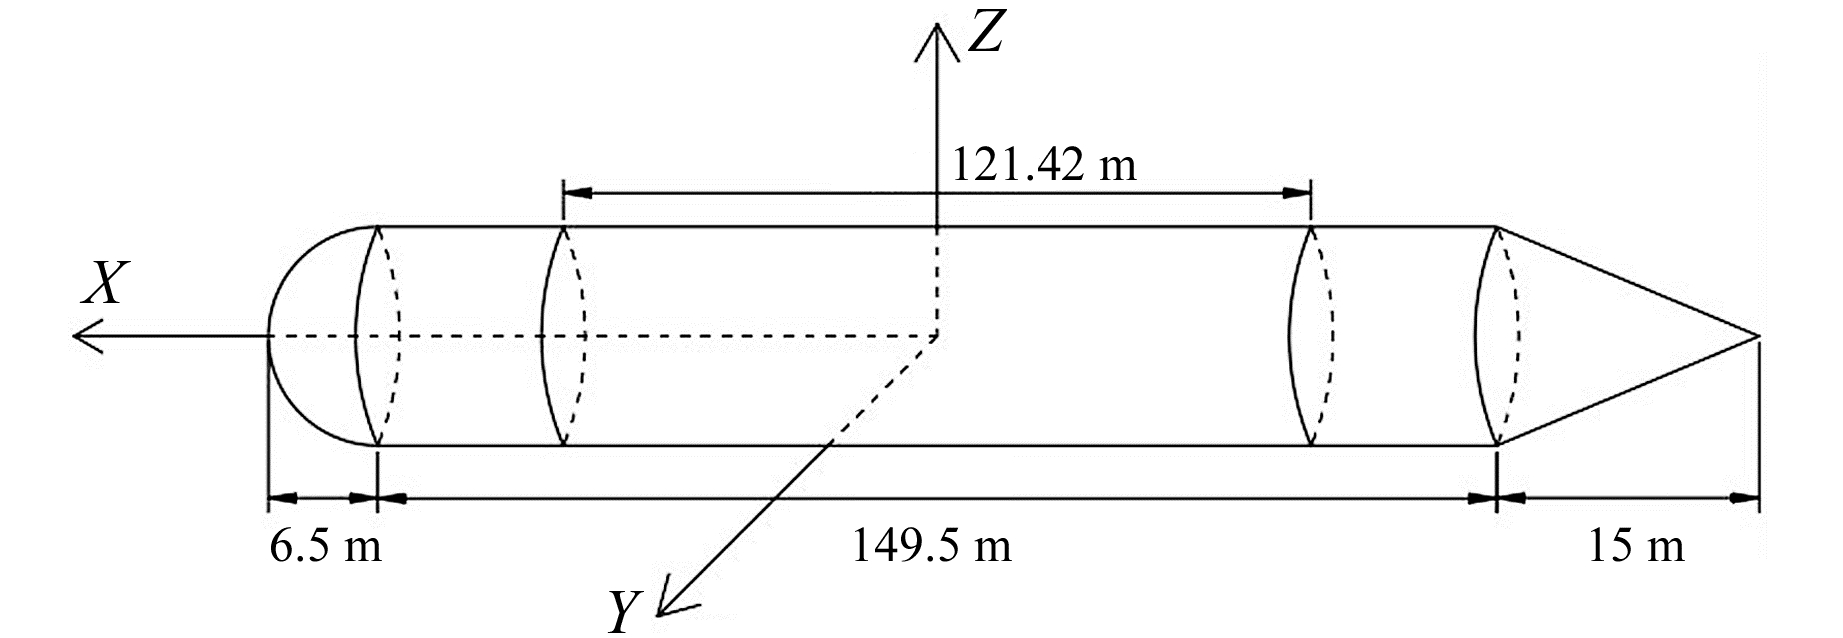
1 理论模型 1.1 潜艇模型的建立本文以美国俄亥俄级弹道导弹核潜艇为例进行研究。为简化计算,假设该潜艇由半球形头部、圆柱形中部、圆锥形尾部和内部的圆柱形耐压舱构成(图 1)[4]。其中,半球形头部的半径为6.5 m,圆柱形中部的长度为149.5 m,圆锥形尾部的长度为15 m,耐压舱长121.42 m,半径为6.5 m,外壳的面密度为247.58 g/cm2 [4]。以潜艇圆柱形中部的形心为坐标原点,指向艇艏方向为X轴正向,左舷为Y轴正向,竖直向上为Z轴正向,建立空间直角坐标系。

|
图 1 潜艇模型示意图 Fig. 1 Diagram of submarine model |
潜艇产生的重力梯度可分为2个部分:潜艇外壳产生的重力梯度和潜艇耐压舱引起的质量亏损而产生的重力梯度。
1.2.1 外壳产生的重力梯度位于(x, y, z)处的外壳面元ds在空间一点(X, Y, Z)处产生的引力位V1为[4]:
| $ {V_1} = G\sigma \iint {\frac{{{\text{d}}s}}{{\sqrt {{{\left( {X - x} \right)}^2} + {{\left( {Y - y} \right)}^2} + {{\left( {Z - z} \right)}^2}} }}} $ | (1) |
式中,G为万有引力常数,σ为潜艇外壳面密度。
V1对x、y、z求2阶导数就可以得到外壳产生的6个重力梯度分量:
| $ \left\{ \begin{gathered} {V_{1xx}} = G\sigma \iint {\frac{{2{{\left( {X - x} \right)}^2} - {{\left( {Y - y} \right)}^2} - {{\left( {Z - z} \right)}^2}}}{{{{\left[ {{{\left( {X - x} \right)}^2} + {{\left( {Y - y} \right)}^2} + {{\left( {Z - z} \right)}^2}} \right]}^{\frac{5}{2}}}}}}{\text{d}}s \hfill \\ {V_{1yy}} = G\sigma \iint {\frac{{2{{\left( {Y - y} \right)}^2} - {{\left( {X - x} \right)}^2} - {{\left( {Z - z} \right)}^2}}}{{{{\left[ {{{\left( {X - x} \right)}^2} + {{\left( {Y - y} \right)}^2} + {{\left( {Z - z} \right)}^2}} \right]}^{\frac{5}{2}}}}}}{\text{d}}s \hfill \\ {V_{1zz}} = G\sigma \iint {\frac{{2{{\left( {Z - z} \right)}^2} - {{\left( {X - x} \right)}^2} - {{\left( {Y - y} \right)}^2}}}{{{{\left[ {{{\left( {X - x} \right)}^2} + {{\left( {Y - y} \right)}^2} + {{\left( {Z - z} \right)}^2}} \right]}^{\frac{5}{2}}}}}}{\text{d}}s \hfill \\ {V_{1xy}} = G\sigma \iint {\frac{{3\left( {X - x} \right)\left( {Y - y} \right)}}{{{{\left[ {{{\left( {X - x} \right)}^2} + {{\left( {Y - y} \right)}^2} + {{\left( {Z - z} \right)}^2}} \right]}^{\frac{5}{2}}}}}}{\text{d}}s \hfill \\ {V_{1xz}} = G\sigma \iint {\frac{{3\left( {X - x} \right)\left( {Z - z} \right)}}{{{{\left[ {{{\left( {X - x} \right)}^2} + {{\left( {Y - y} \right)}^2} + {{\left( {Z - z} \right)}^2}} \right]}^{\frac{5}{2}}}}}}{\text{d}}s \hfill \\ {V_{1yz}} = G\sigma \iint {\frac{{3\left( {Y - y} \right)\left( {Z - z} \right)}}{{{{\left[ {{{\left( {X - x} \right)}^2} + {{\left( {Y - y} \right)}^2} + {{\left( {Z - z} \right)}^2}} \right]}^{\frac{5}{2}}}}}}{\text{d}}s \hfill \\ \end{gathered} \right. $ | (2) |
因耐压舱质量亏损产生的引力位为[4]:
| $ {V_2} = - G\rho \iiint {\frac{{{\text{d}}v}}{{\sqrt {{{\left( {X - x} \right)}^2} + {{\left( {Y - y} \right)}^2} + {{\left( {Z - z} \right)}^2}} }}} $ | (3) |
V2对x、y、z求2阶导数就可以得到耐压舱产生的6个重力梯度分量:
| $ \left\{ \begin{gathered} {V_{2xx}} = - G\rho \iiint {\frac{{2{{\left( {X - x} \right)}^2} - {{\left( {Y - y} \right)}^2} - {{\left( {Z - z} \right)}^2}}}{{{{\left[ {{{\left( {X - x} \right)}^2} + {{\left( {Y - y} \right)}^2} + {{\left( {Z - z} \right)}^2}} \right]}^{\frac{5}{2}}}}}}{\text{d}}x{\text{d}}y{\text{d}}z \hfill \\ {V_{2yy}} = - G\rho \iiint {\frac{{2{{\left( {Y - y} \right)}^2} - {{\left( {X - x} \right)}^2} - {{\left( {Z - z} \right)}^2}}}{{{{\left[ {{{\left( {X - x} \right)}^2} + {{\left( {Y - y} \right)}^2} + {{\left( {Z - z} \right)}^2}} \right]}^{\frac{5}{2}}}}}}{\text{d}}x{\text{d}}y{\text{d}}z \hfill \\ {V_{2zz}} = - G\rho \iiint {\frac{{2{{\left( {Z - z} \right)}^2} - {{\left( {X - x} \right)}^2} - {{\left( {Y - y} \right)}^2}}}{{{{\left[ {{{\left( {X - x} \right)}^2} + {{\left( {Y - y} \right)}^2} + {{\left( {Z - z} \right)}^2}} \right]}^{\frac{5}{2}}}}}}{\text{d}}x{\text{d}}y{\text{d}}z \hfill \\ {V_{2xy}} = - G\rho \iiint {\frac{{3\left( {X - x} \right)\left( {Y - y} \right)}}{{{{\left[ {{{\left( {X - x} \right)}^2} + {{\left( {Y - y} \right)}^2} + {{\left( {Z - z} \right)}^2}} \right]}^{\frac{5}{2}}}}}}{\text{d}}x{\text{d}}y{\text{d}}z \hfill \\ {V_{2xz}} = - G\rho \iiint {\frac{{3\left( {X - x} \right)\left( {Z - z} \right)}}{{{{\left[ {{{\left( {X - x} \right)}^2} + {{\left( {Y - y} \right)}^2} + {{\left( {Z - z} \right)}^2}} \right]}^{\frac{5}{2}}}}}}{\text{d}}x{\text{d}}y{\text{d}}z \hfill \\ {V_{2yz}} = - G\rho \iiint {\frac{{3\left( {Y - y} \right)\left( {Z - z} \right)}}{{{{\left[ {{{\left( {X - x} \right)}^2} + {{\left( {Y - y} \right)}^2} + {{\left( {Z - z} \right)}^2}} \right]}^{\frac{5}{2}}}}}}{\text{d}}x{\text{d}}y{\text{d}}z \hfill \\ \end{gathered} \right. $ | (4) |
式中,ρ为海水密度,取1.03 g/cm3。
1.2.3 潜艇产生的重力梯度潜艇产生的重力梯度为潜艇外壳产生的重力梯度和潜艇耐压舱质量亏损产生的重力梯度之和,即
| $ {V_{ij}} = {V_{1ij}} + {V_{2ij}}, i = x, y;j = x, y $ | (5) |
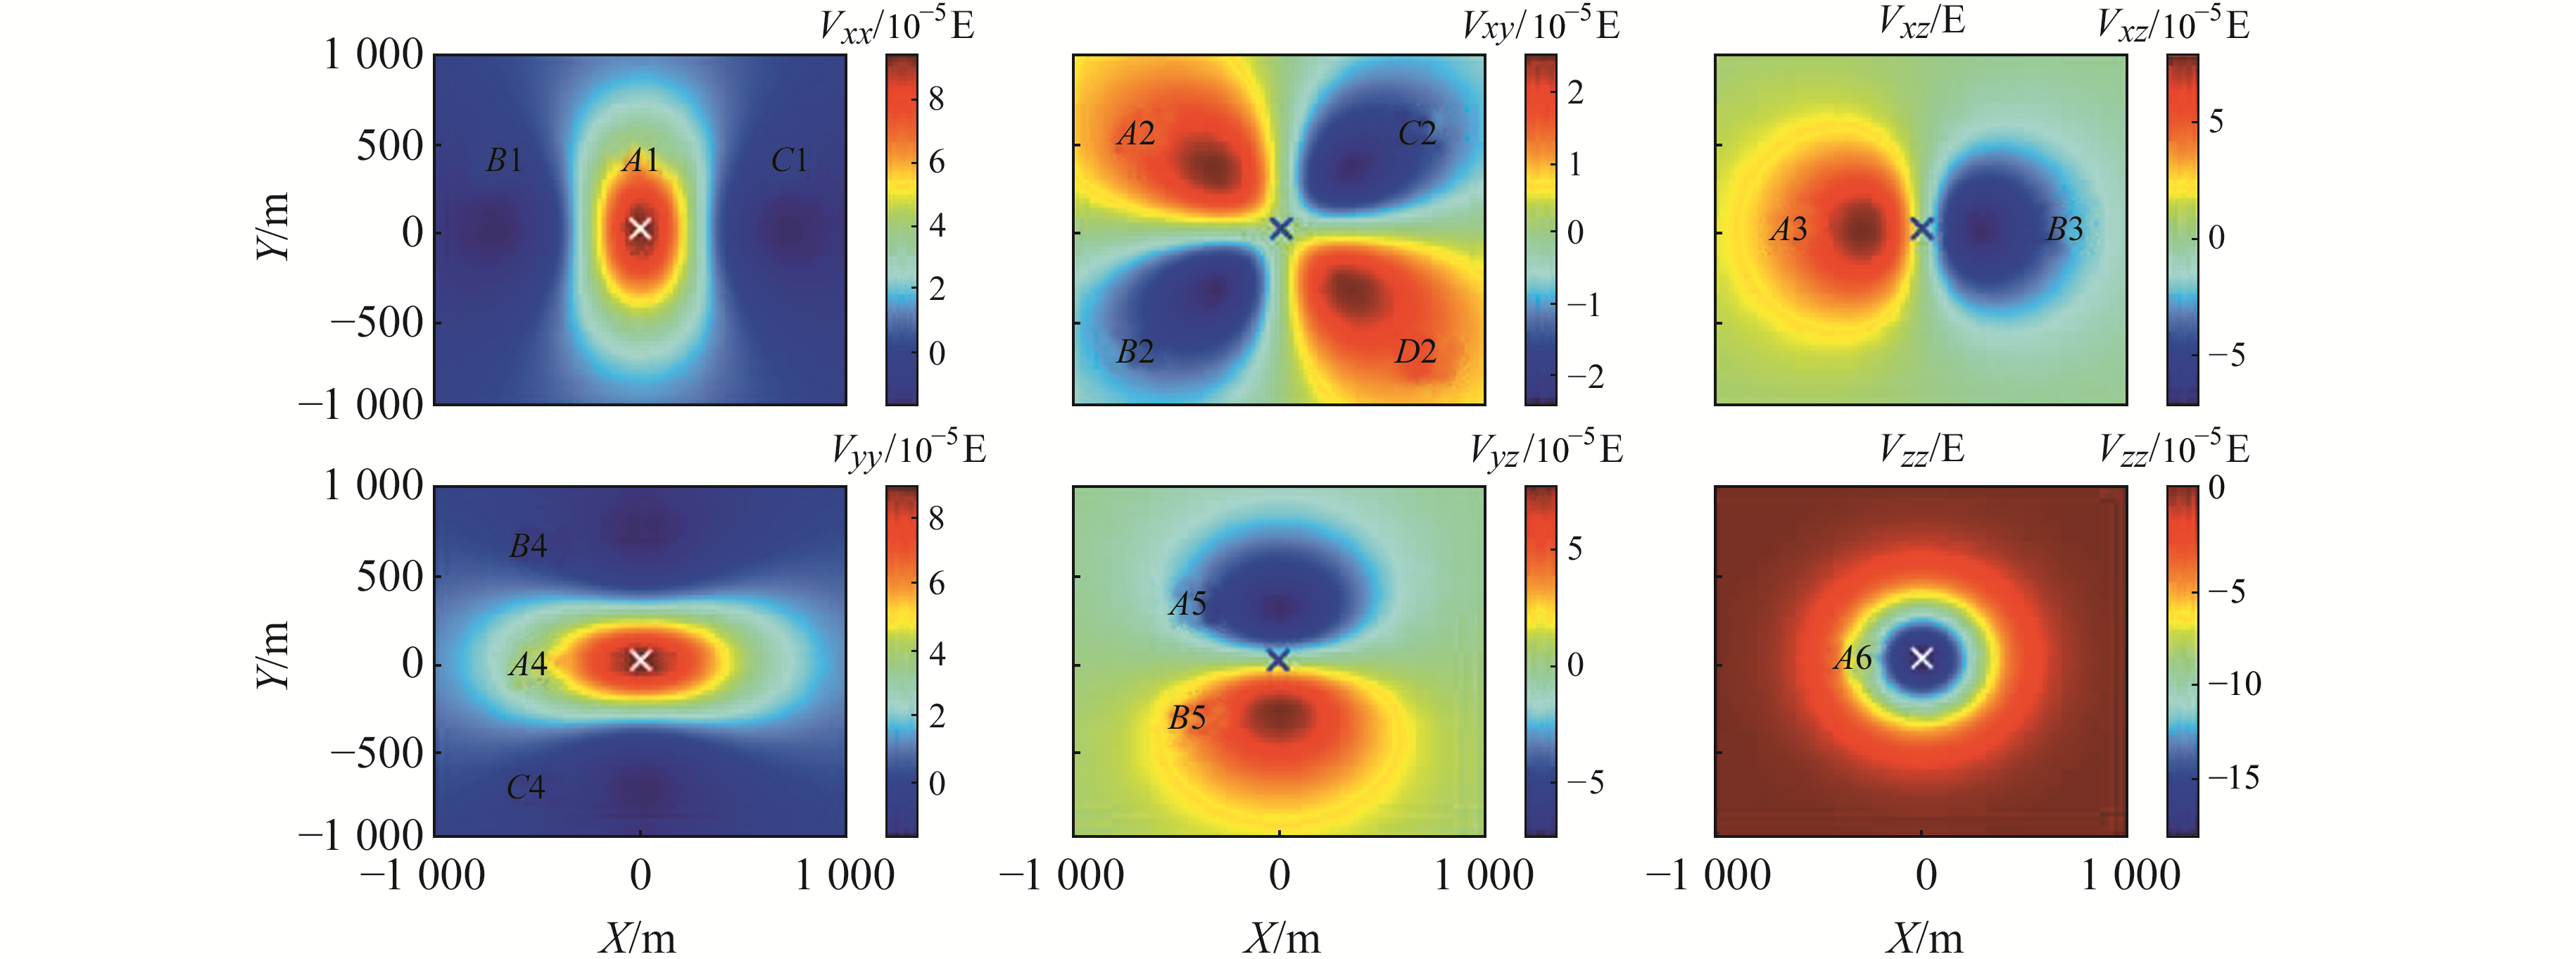
利用式(2)、(4)、(5)即可计算出潜艇上方产生的重力梯度。以潜艇上方600 m处为例,观测到的重力梯度如图 2所示,重力梯度各分量绝对值的数值统计结果如表 1所示,该结果与孙岚等[12]的研究基本吻合。由表 1可知,Vzz绝对值的最大值在各分量中最大,信号最强,理论上最适合进行潜艇探测。
|
|
表 1 潜艇产生的重力梯度各分量绝对值的数值特征 Tab. 1 Numerical characteristics of the absolute values of the components of the gravity gradient generated by the submarine |
如图 2所示,不同的梯度分量均有极值点,且除Vzz外,其余分量均有多个极值点。这些极值点的分布与潜艇的位置必然相关,如根据Vxx、Vyy、Vzz中心极值点的位置以及梯度张量非对角分量极值点之间的中心位置,即可确定潜艇的水平位置,如图 2中“×”所示。要确定潜艇的准确位置,还需知道其深度,但从图形中难以直接得出。本文尝试通过研究极值点位置与深度的关系来解决此问题。

|
图 2 潜艇上方600 m处产生的重力梯度 Fig. 2 The gravity gradients generated by submarine while z=600m |
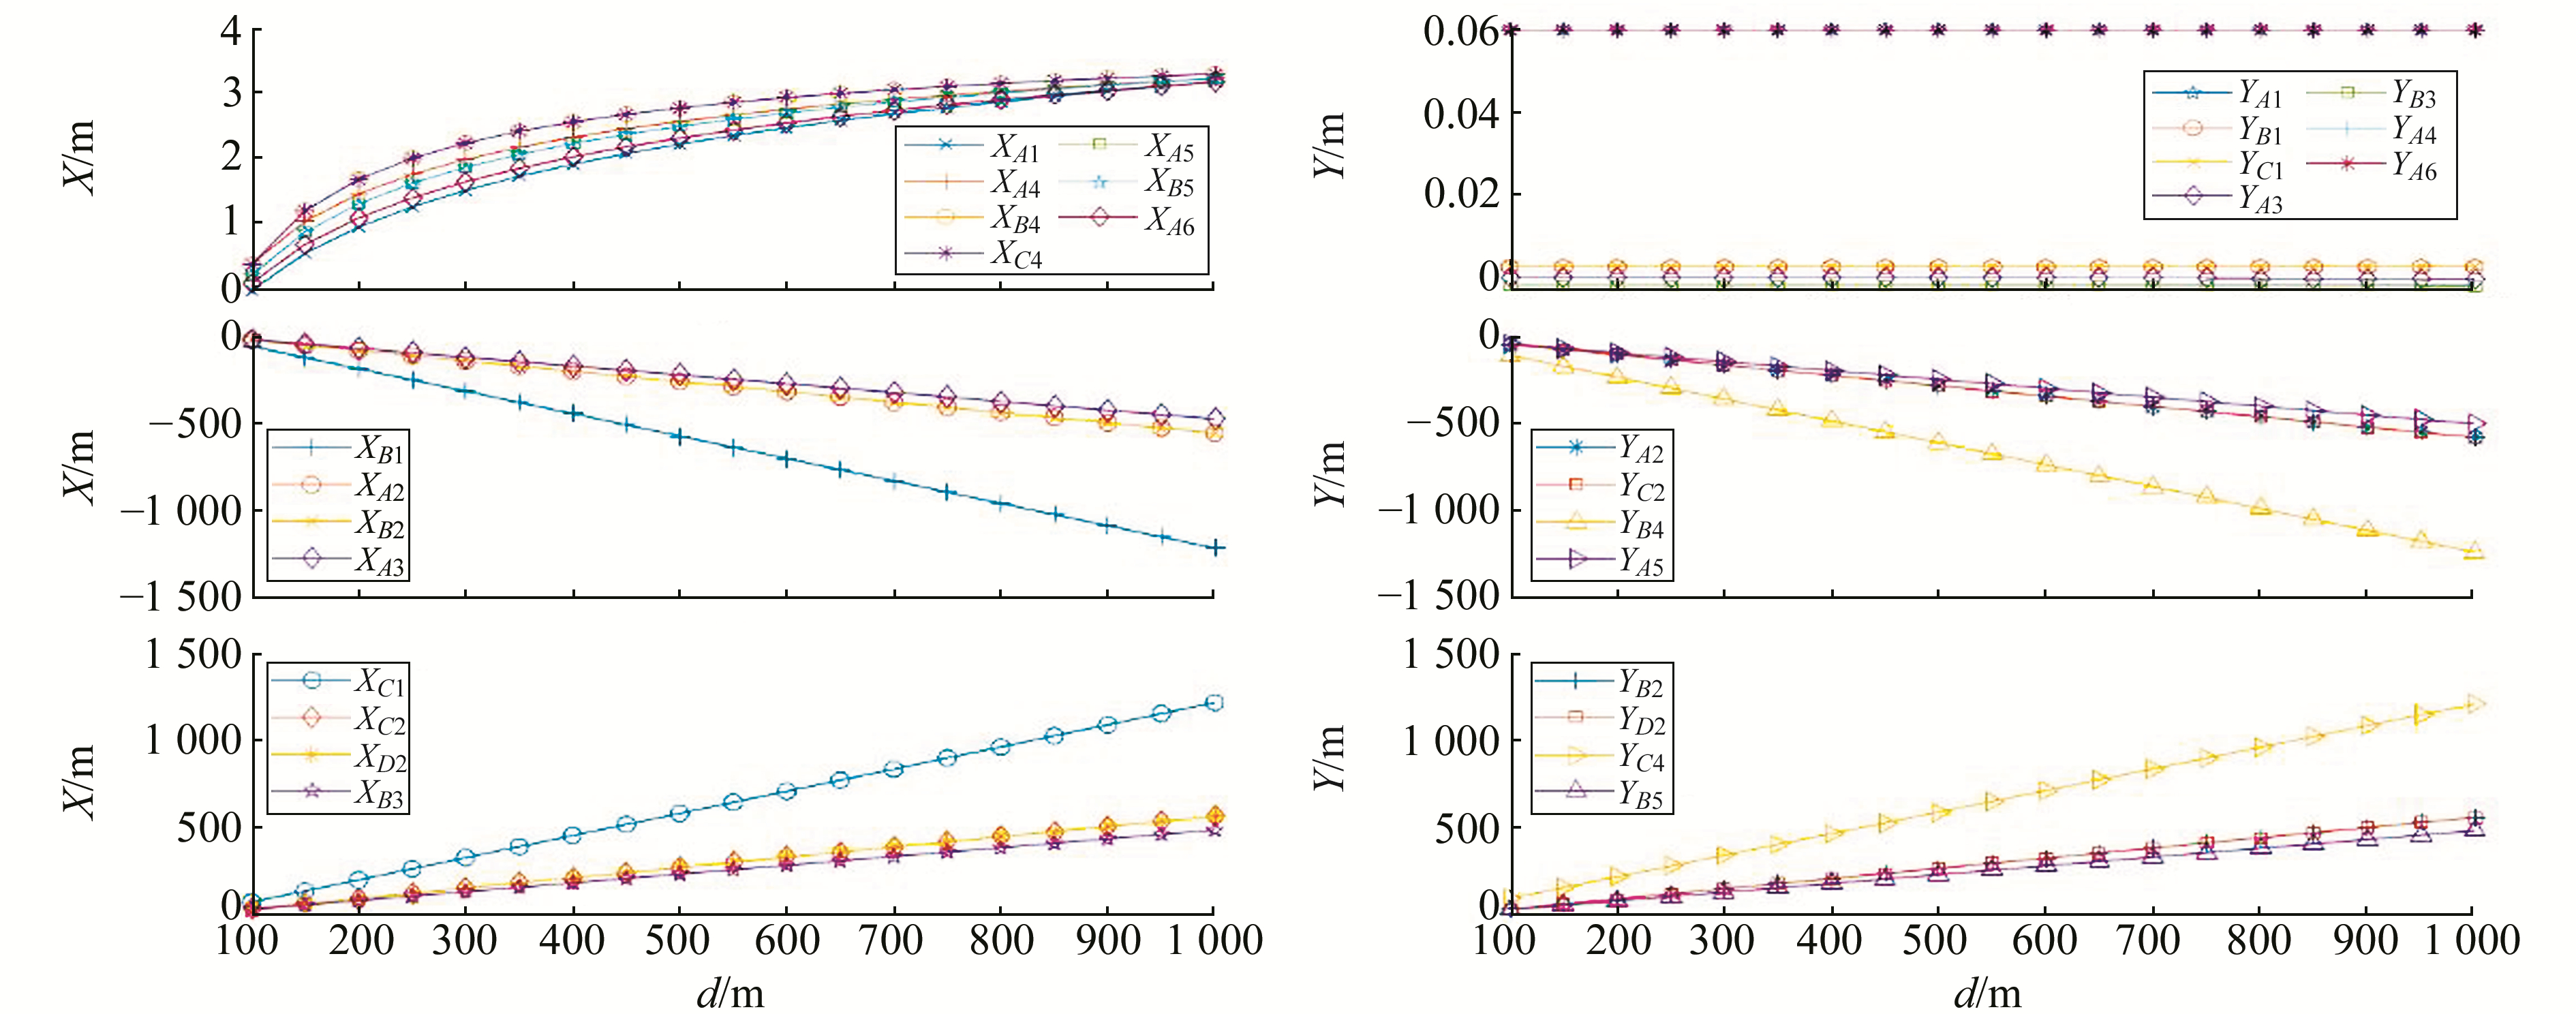
理论上,随着潜艇深度的变化,特定高度处重力梯度各分量极值点的水平坐标亦会发生变化。现通过1组实验数值进行分析。由于重力梯度仪精度的限制,潜艇探测的有效高度范围大约为1 000 m左右[13],故本文计算潜艇到观测点垂直距离100~1 000 m(间隔50 m)的极值点坐标。潜艇到观测点垂直距离(用d表示)与极值点坐标的关系如图 3所示。

|
图 3 潜艇极值点坐标与潜艇到观测点的垂直距离的关系 Fig. 3 The relationship between the submarine extreme point coordinates and the vertical distance from the submarine to the observation point |
由图 3可知,YA1、YB1、YC1、YA3、YB3、YA4和YA6不随d的变化而变化; XA1、XA4、XB4、XC4、XA5、XB5和XA6随d的变化为非线性,且随d的变化幅度较小,故以上量不适合用来反演潜艇深度。XB1、XC1、XA2、YA2、XB2、YB2、XC2、YC2、XD2、YD2、XA3、XB3、YB4、YC4、YA5和YB5随d的变化为线性,且随高度的变化较大,故适合反演潜艇深度。利用这些量,本文进一步通过最小二乘算法确定了各坐标与d之间的相互关系,结果如式(6)~(11)所示:
| $ \left\{ \begin{array}{l} {X_{A1}} = \frac{{ - 172.9297}}{{{d^{0.0085}}}} + 166.2401 \hfill \\ {Y_{A1}} = 0.0603 \hfill \\ {X_{B1}} = - 1.2639d + 53.5005 \hfill \\ {Y_{B1}} = 0.0020 \hfill \\ {X_{C1}} = 1.2664d - 47.7261 \hfill \\ {Y_{C1}} = 0.0020 \hfill \\ \end{array} \right. $ | (6) |
| $ \left\{ \begin{array}{l} {X_{A2}} = - 0.5816d + 19.7724 \hfill \\ {Y_{A2}} = - 0.5830d + 8.3924 \hfill \\ {X_{B2}} = - 0.5815d + 19.7240 \hfill \\ {Y_{B2}} = 0.5831d - 8.4583 \hfill \\ {X_{C2}} = 0.5869d - 17.3083 \hfill \\ {Y_{C2}} = - 0.5829d + 8.0917 \hfill \\ {X_{D2}} = 0.5870d - 17.3614 \hfill \\ {Y_{D2}} = 0.5828 - 8.0516 \hfill \\ \end{array} \right. $ | (7) |
| $ \left\{ \begin{array}{l} {X_{A3}} = - 0.4978d + 15.2091 \hfill \\ {Y_{A3}} = - 1.140{\text{ }}5 \times {10^{ - 7}}d - 7 \times {10^{ - 4}} \hfill \\ {X_{B3}} = 0.5038d - 13.4695 \hfill \\ {Y_{B3}} = - 1.9008 \times {10^{ - 7}}d - 0.0024 \hfill \\ \end{array} \right. $ | (8) |
| $ \left\{ \begin{array}{l} {X_{A4}} = \frac{{ - 23.1460}}{{{d^{0.3052}}}} + 6.0236 \hfill \\ {Y_{A4}} = 0.0603 \hfill \\ {X_{B4}} = \frac{{ - 55.9930}}{{{d^{0.5720}}}} + 4.3604 \hfill \\ {Y_{B4}} = - 1.2343d + 12.3085 \hfill \\ {X_{C4}} = \frac{{- 55.9548}}{{{d^{0.5718}}}} + 4.3616 \hfill \\ {Y_{C4}} = 1.2343d - 12.3100 \hfill \\ \end{array} \right. $ | (9) |
| $ \left\{ \begin{array}{l} {X_{A5}} = \frac{{ - 22.0907}}{{{d^{0.2530}}}} + 7.0582 \hfill \\ {Y_{A5}} = - 0.5019d + 3.4077 \hfill \\ {X_{B5}} = \frac{{ - 21.8708}}{{{d^{0.2476}}}} + 7.1683 \hfill \\ {Y_{B5}} = 0.5018d - 3.3806 \hfill \\ \end{array} \right. $ | (10) |
| $ {X_{A6}} = \frac{{- 24.6826}}{{{d^{0.0933}}}} + 16.1134, {Y_{A6}} = 0.0603 $ | (11) |
由式(6)~(11)可知,XB1、XC1、XA2、YA2、XB2、YB2、XC2、YC2、XD2、YD2、XA3、XB3、YB4、YC4、YA5和YB5这些用于计算d的关系式均可写成形如式(12)的表达式,利用式(12)可以推导出坐标的方差和d的方差之间的关系,如式(13)所示。因为各坐标均可独立地计算d,因此本文取计算得到的d的加权平均值为最终估计的潜艇深度,权的确定如式(14)所示。根据式(12)~(14),即可精确确定潜艇的深度:
| $ {X_i} = {a_i}d + {b_i} $ | (12) |
| $ \sigma _d^2 = \frac{1}{{a_i^2}}\sigma _{{X_i}}^2 $ | (13) |
| $ {P_i} = \frac{1}{{\sigma _{{d_i}}^2}} $ | (14) |
随机选取6个高度(459 m、573 m、610 m、780 m、846 m和927 m),计算潜艇到观测点的垂直距离,结果如表 2所示。为验证该算法的稳健性,在极值点坐标中随机加入±5 m和±50 m的误差,结果如表 3、4所示。
|
|
表 2 无误差时反算出的潜艇到观测点之间的垂直距离 Tab. 2 The vertical distance between the submarine and the observation point calculated without error |
|
|
表 3 加入±5m误差后反算出的潜艇到观测点之间的垂直距离 Tab. 3 The vertical distance between the submarine and the observation point calculated after adding an error of ±5 m |
|
|
表 4 加入±50 m的误差后反算出的潜艇到观测点之间的垂直距离 Tab. 4 The vertical distance between the submarine and the observation point calculated after adding an error of ±50 m |
由表 2可知,计算出的距离最大误差不超过1 m,平均相对误差为0.7%,表明利用水平极值点坐标计算潜艇到观测点垂直距离是可行的。由表 3可知,在极值点坐标中加入±5 m的误差后,计算出的距离误差最大不超过1.6 m,平均相对误差为1.3%。由表 4可知,在极值点坐标中加入±50 m的误差后,计算出的距离误差最大不超过13.1 m,平均相对误差为11.1%,说明该方法的稳健性较好,能运用于较为复杂的环境。
3 结语本文提出一种利用梯度极值点坐标反演潜艇深度的方法,推导了潜艇产生的重力梯度的计算公式,实现了各重力梯度分量的计算,并分析了极值点坐标与潜艇深度的关系。结果表明,Vzz有1个位于潜艇正上方的极值点; Vxz、Vyz有2个位于潜艇两侧的极值点; Vxx、Vyy有1个位于潜艇正上方的极值点和2个位于潜艇两侧的极值点; Vxy有4个位于潜艇正上方周围的极值点。Vxx和Vxz所有极值点的Y坐标、Vyy和Vzz中心极值点的Y坐标不随高度的变化而变化,不适合用来计算潜艇深度; Vyy、Vyz和Vzz所有极值点的X坐标、Vxx中心极值点的X坐标随高度的变化为非线性关系且变化较小,也不适合用来计算潜艇深度; Vxx两侧极值点的X坐标、Vxz所有极值点的X坐标、Vxy所有极值点的X和Y坐标、Vyy两侧极值点的Y坐标和Vyz所有极值点的Y坐标随高度线性变化且变化程度较大,适合用来计算潜艇深度。模拟实验也证明了该方法的可行性和稳健性。
| [1] |
Wan X Y, Yu J H. Derivation of the Radial Gradient of the Gravity Based on Non-Full Tensor Satellite Gravity Gradients[J]. Journal of Geodynamics, 2013, 66: 59-64 DOI:10.1016/j.jog.2013.02.005
(  0) 0) |
| [2] |
孟祥超, 万晓云, 于锦海, 等. 利用引力梯度数据计算径向梯度的优化方法[J]. 测绘学报, 2016, 45(7): 775-781 (Meng Xiangchao, Wan Xiaoyun, Yu Jinhai, et al. Optimization Method for Computing Radial Gravity Gradient Using Gravity Gradient Observations[J]. Acta Geodaetica et Cartographica Sinica, 2016, 45(7): 775-781)
(  0) 0) |
| [3] |
纪兵, 刘敏, 吕良, 等. 重力梯度仪在水下安全航行中的应用[J]. 海洋测绘, 2010, 30(4): 23-25 (Ji Bing, Liu Min, Lü Liang, et al. Application of Gradiometer to Underwater Safe Navigation[J]. Hydroaphic Surveying and Charting, 2010, 30(4): 23-25)
(  0) 0) |
| [4] |
Zhang Z Q, Shi J, Yu Z, et al. Feasibility Analysis of Submarine Detection Method Based on the Airborne Gravity Gradient[C].Chinese Control Conference, Wuhan, 2018
(  0) 0) |
| [5] |
Zhou W N. Depth Estimation Method Based on the Ratio of Gravity and Full Tensor Gradient Invariant[J]. Pure and Applied Geophysics, 2016, 173(2): 499-508 DOI:10.1007/s00024-015-1117-7
(  0) 0) |
| [6] |
Beiki M. Analytic Signals of Gravity Gradient Tensor and Their Application to Estimate Source Location[J]. Geophysics, 2010, 75(6): I59-I74 DOI:10.1190/1.3493639
(  0) 0) |
| [7] |
Beiki M, Pedersen L B. Eigenvector Analysis of Gravity Gradient Tensor to Locate Geologic Bodies[J]. Geophysics, 2010, 75(6): I37-I49
(  0) 0) |
| [8] |
Wu L, Ke X P, Hsu H, et al. Joint Gravity and Gravity Gradient Inversion for Subsurface Object Detection[J]. IEEE Geoscience and Remote Sensing Letters, 2013, 10(4): 865-869 DOI:10.1109/LGRS.2012.2226427
(  0) 0) |
| [9] |
Yan Z, Ma J, Tian J W, et al. A Gravity Gradient Differential Ratio Method for Underwater Object Detection[J]. IEEE Geoscience and Remote Sensing Letters, 2014, 11(4): 833-837 DOI:10.1109/LGRS.2013.2279485
(  0) 0) |
| [10] |
Yan Z, Ma J, Tian J W. Accurate Aerial Object Localization Using Gravity and Gravity Gradient Anomaly[J]. IEEE Geoscience and Remote Sensing Letters, 2015, 12(6): 1214-1217 DOI:10.1109/LGRS.2015.2388772
(  0) 0) |
| [11] |
Tang J T, Hu S G, Ren Z Y, et al. Analytical Formulas for Underwater and Aerial Object Localization by Gravitational Field and Gravitational Gradient Tensor[J]. IEEE Geoscience and Remote Sensing Letters, 2017, 14(9): 1557-1560 DOI:10.1109/LGRS.2017.2722475
(  0) 0) |
| [12] |
孙岚, 李厚朴, 边少锋, 等. 基于重力梯度的潜艇探测方法研究[J]. 海洋测绘, 2010, 30(2): 24-27 (Sun Lan, Li Houpu, Bian Shaofeng, et al. Study on the Submarine Detection Method Based on the Gravity Gradient[J]. Hydrographic Surveying and Charting, 2010, 30(2): 24-27)
(  0) 0) |
| [13] |
宁津生. 卫星重力探测技术与地球重力场研究[J]. 大地测量与地球动力学, 2002, 22(1): 1-5 (Ning Jinsheng. The Satellite Gravity Surveying Technology and Research of Earth's Gravity[J]. Journal of Geodesy and Geodynamics, 2002, 22(1): 1-5)
(  0) 0) |
2. Shanxi Key Laboratory of Resources, Environment and Disaster Monitoring, 380 West-Yingbin Street, Jinzhong 030600, China;
3. Qian Xuesen Laboratory of Space Technology, 104 Youyi Road, Beijing 100094, China
 2020, Vol. 40


