研究大气中可降水量(precipitable water vapor,PWV)的空间分布及其随时间的变化可为调查和评估天气系统提供有价值的数据。
目前用于获取大气可降水量的仪器有无线电探空仪、微波辐射计、太阳辐射计以及地基GPS设备[1]。Bevis等[2]在1992年首次提出GPS气象学的概念。与传统的遥感探测方法相比,GPS探测大气可降水量具有全天候、高时空分辨率、低成本等优势[3]。因此,GPS气象学提供的大气可降水量信息已被应用于多个领域,例如数值天气预报(numerical weather forecasting,NWP)、区域或全球大气研究等[4]。许多学者分析了中国局部地区的大气可降水量的分布及变化特征[5-7],但针对新疆地区的详细研究非常少。新疆位于我国西北部干旱、半干旱地区,水资源短缺,掌握该地区大气中可降水量的时空分布非常重要。该地区分布有较多的GPS测站,本文基于中国大陆构造环境监测网络(简称为陆态网)新疆地区的GPS观测资料,结合ERA-Interim模型的气压和温度数据获取该地区大气可降水量,探讨其大气中可降水量的空间分布特征和季节性变化。
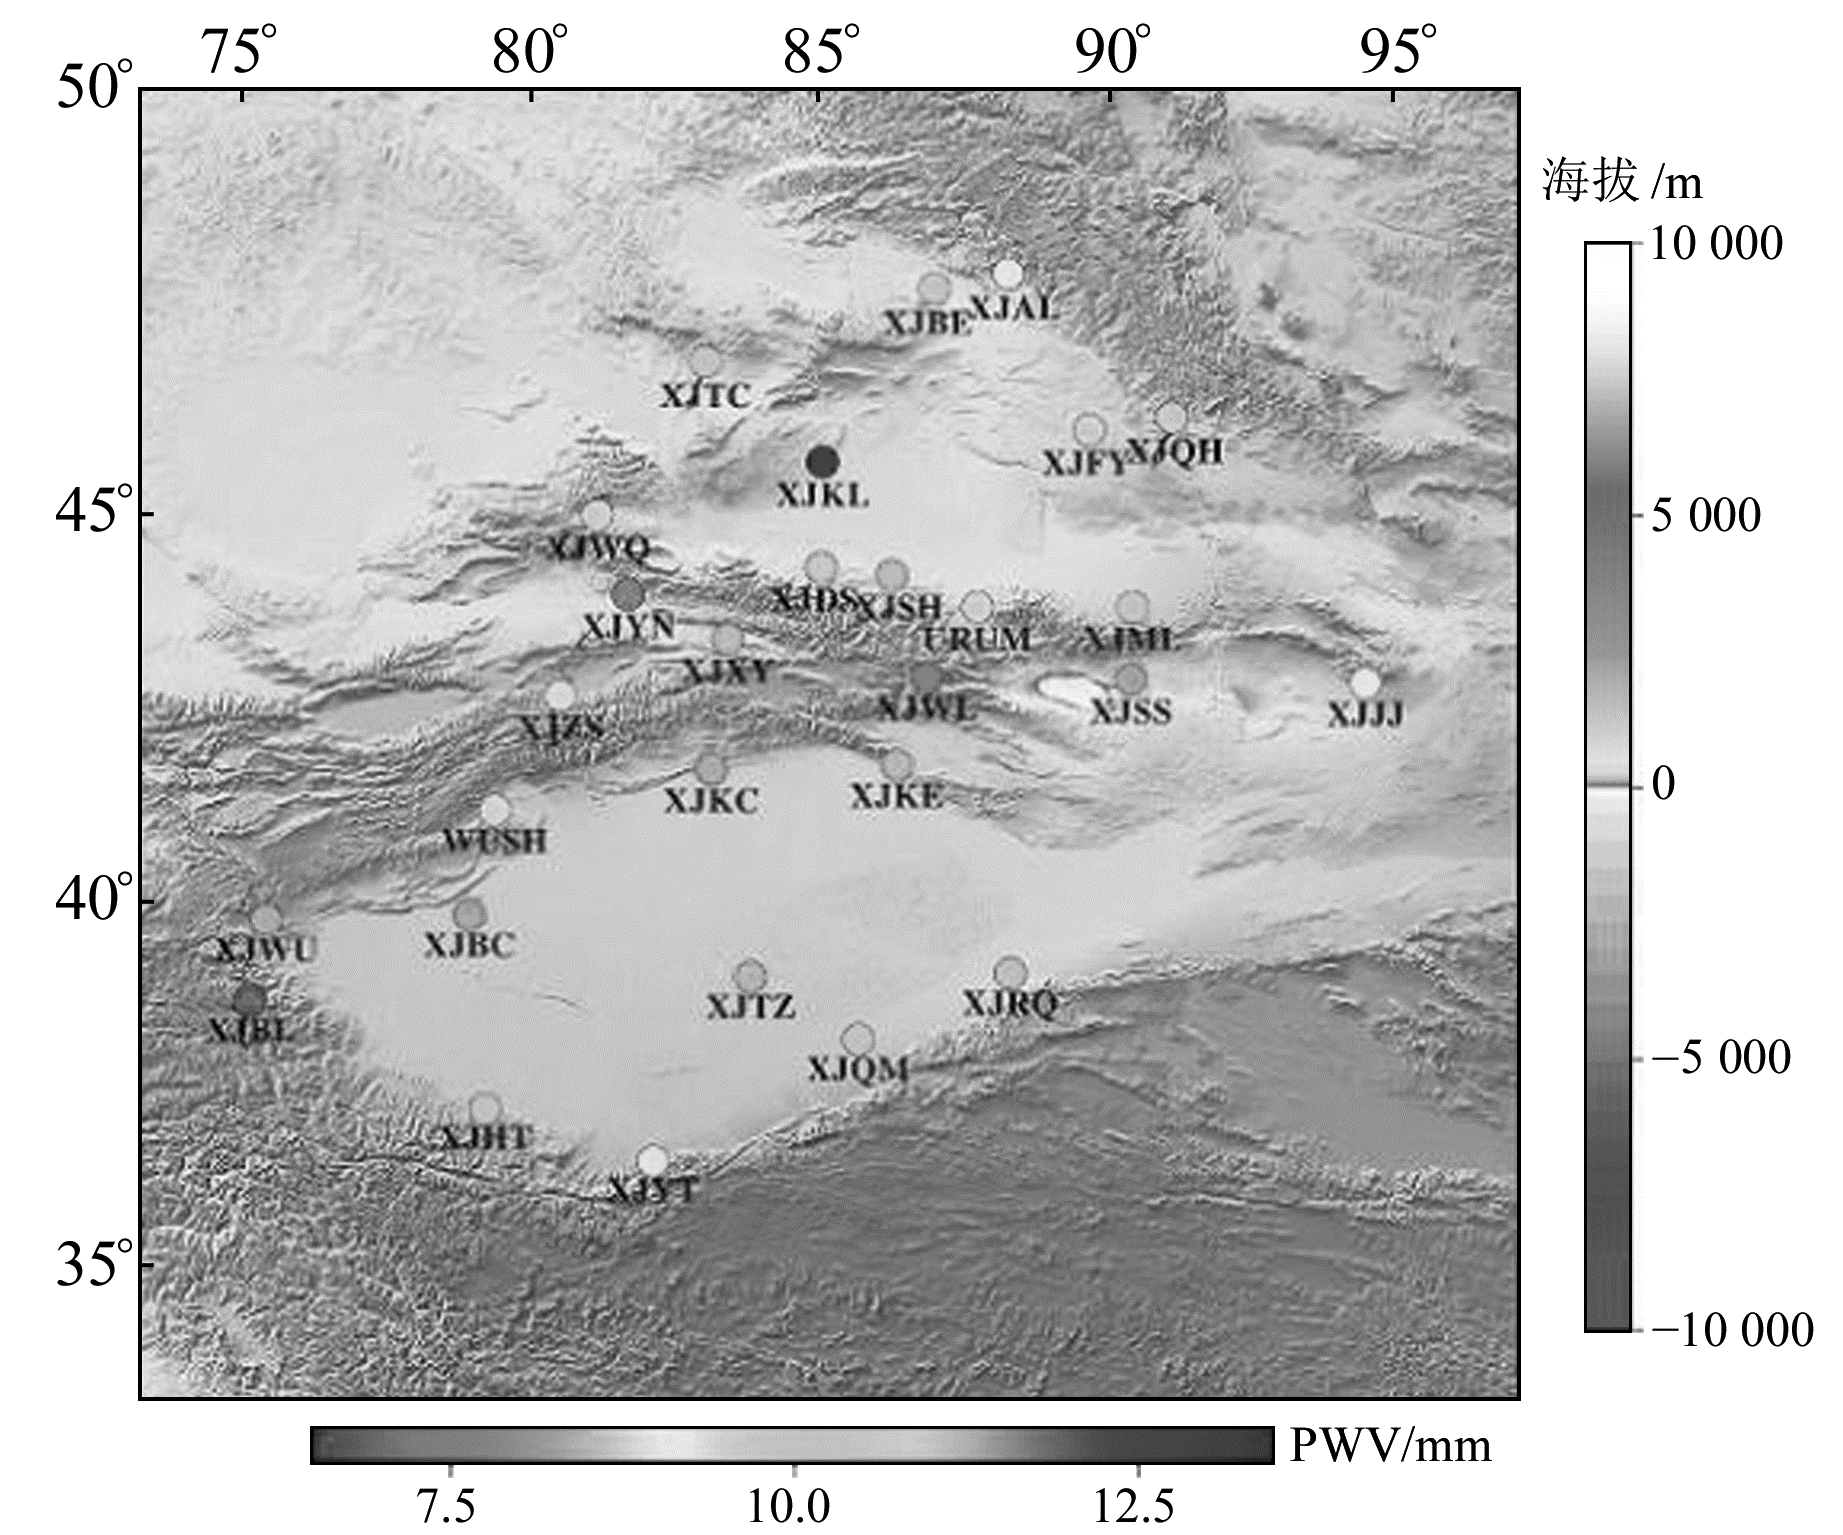
1 数据和方法采用位于新疆地区陆态网的GPS数据,其区域地形及测站分布如图 1所示。采用GAMIT/GLOBK软件进行数据处理,数据时段为2016-01-01~12-31,采样间隔为30 s,估计结果为每站每小时的天顶对流层延迟(zenith total delay,ZTD)。估计的ZTD数据可从网上下载(ftp://ftp.cgps.ac.cn/products/troposphere/2016/)。

|
图 1 研究区域地形和新疆GPS测站分布 Fig. 1 Topography of the study area and distribution of the GPS stations in Xinjiang |
由于缺少与GPS测站并址的气象传感器的气压和温度数据,本文采用欧洲中期天气预报中心(European Center for Medium-Range Weather Forecasts,ECMWF)第3代再分析资料ERA-Interim模型中水平分辨率为0.125°×0.125°及时间分辨率为6 h(UTC 00:00,06:00,12:00,18:00)的海平面气压和2 m温度数据。
利用Saastamoinen模型[8]可计算出信号的天顶静力学延迟(zenith hydrostatic delay,ZHD), 用软件解算的天顶对流层延迟减去天顶静力学延迟,可获得信号的天顶湿延迟(zenith wet delay,ZWD)。根据Bevis等[9]的研究,湿延迟与大气可降水量之间存在一个转换系数,本文中的转换系数由测站所处的气候区域决定[10]。
计算过程中需要地面气压Ps和地面温度Ts,这2个参数可根据ERA-Interim模型提供的海平面气压和2 m温度进行水平和垂直内插得到。因模型的水平分辨率为0.125°×0.125°,水平距离较小,可忽略水平插值[11]。通常使用Berg[12]的标准气压模型进行气压的垂直插值:
| $ {P_s} = {\rm{SLP}}{\left[ {1 - 0.000\;022\;6{h_s}} \right]^{5.225}} $ | (1) |
式中,SLP为海平面气压,hs为测站的海拔高。
ERA-Interim模型提供的仅是2 m位势高处的温度,首先要将2 m位势高通过高差改正转换为相应海拔高,然后根据温度的垂直递减率对温度进行垂直插值,公式如下:
| $ {T_s}{\rm{ = }}{T_{2T}} - 0.006\;5\left( {{h_s} - {h_{2T}}} \right) $ | (2) |
式中,T2T和h2T分别为位势高为2 m处的温度和对应的海拔高。
2 结果分析 2.1 与探空数据对比为了检验GPS获取大气可降水量的准确性,本文以URUM站为例,对2016年GPS获取的大气可降水量(GPS-PWV)和无线电探空站探测的大气可降水量(RS-PWV)进行比较。无线电探空站位于GPS站东南方向约3.70 km处,海拔比GPS站高约2.81 m。无线电探空站每天只进行2次观测,分别在UTC 00:00和12:00。图 2为RS-PWV与GPS-PWV的时间序列图。可以看出,2种探测手段获得的大气可降水量具有较好的一致性,相关系数可达0.976,通过了0.01的显著性水平检验,均方根误差(root mean square error,RMSE)约为2.7 mm。通过GPS-PWV与RS-PWV的对比可以看出,利用GPS数据获取大气可降水量在精度上是可行的[13]。

|
图 2 2016年URUM站RS-PWV和GPS-PWV的时间序列 Fig. 2 Time series of RS-PWV and GPS-PWV at URUM station in 2016 |
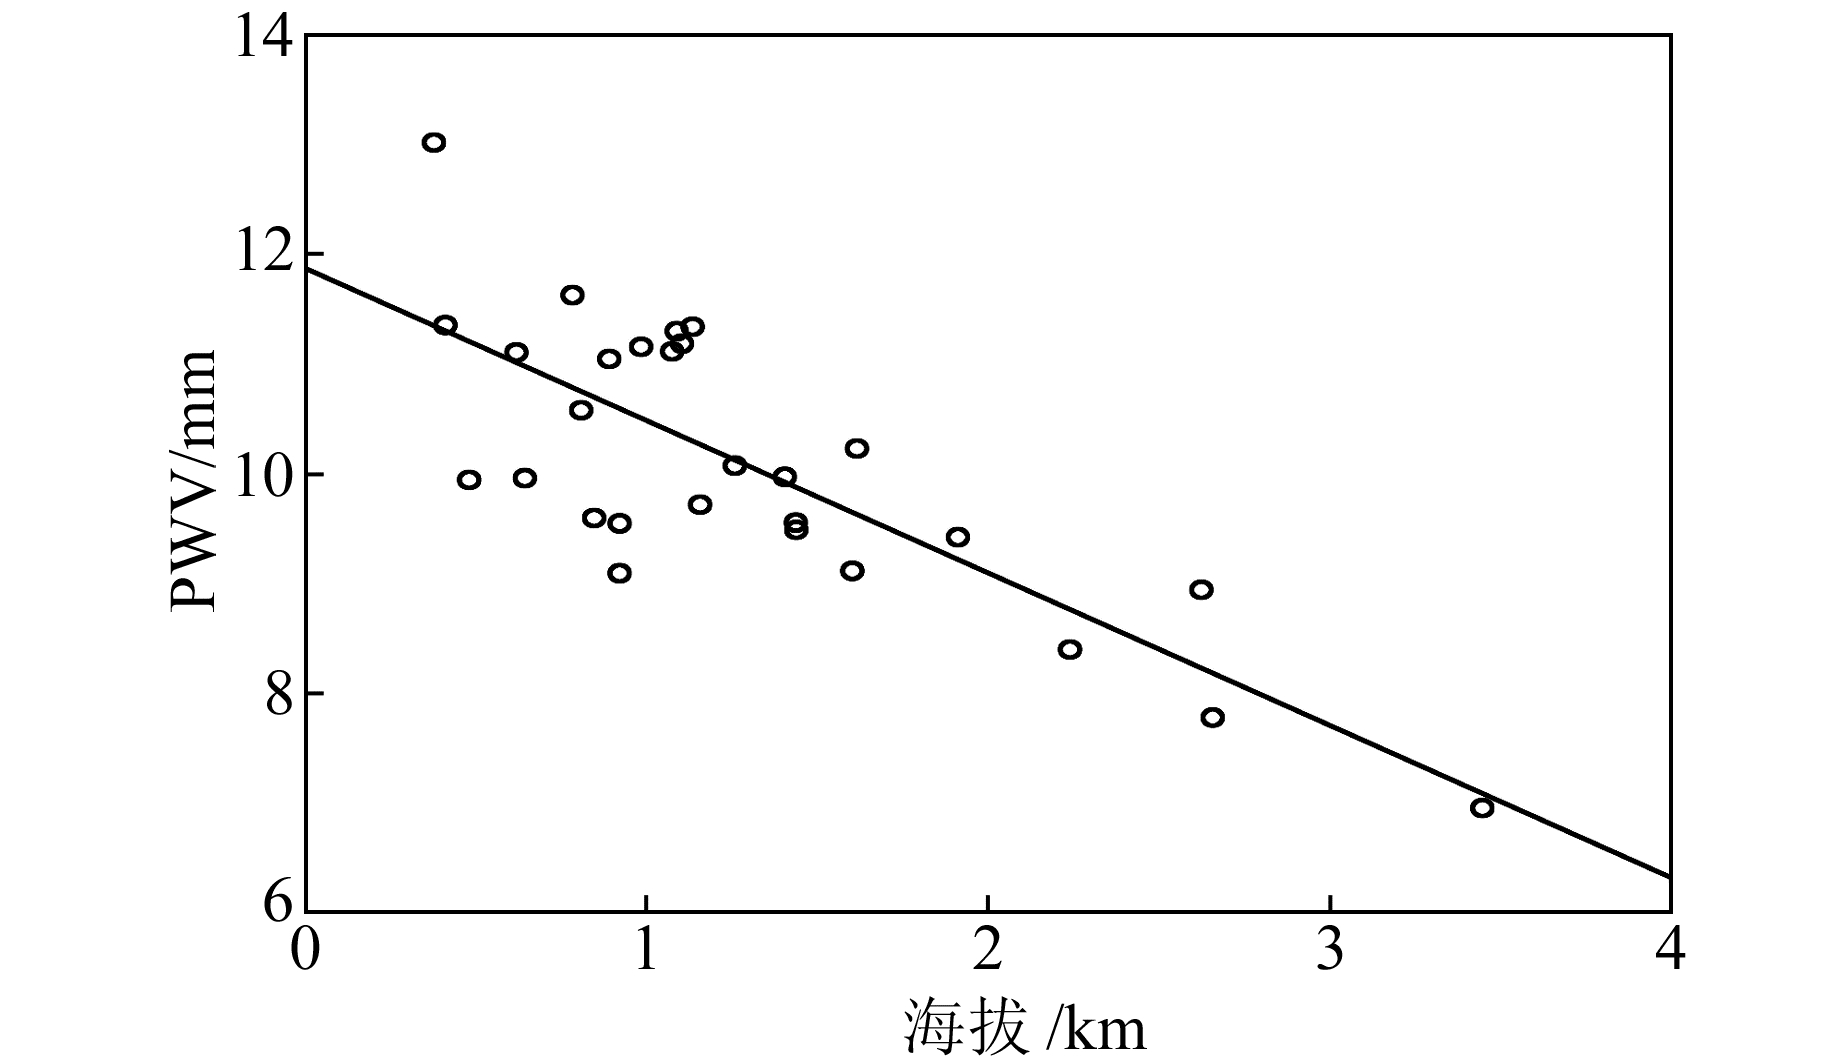
图 3为2016年GPS测站全年平均大气可降水量的分布情况。新疆四周被群山环绕,外部大气可降水量很难进入,且深居内陆属于干旱、半干旱气候,因此大气可降水量总体较少,在7.0~13.0 mm之间。图中,位于山区及其附近高海拔处的测站的大气可降水量明显低于低海拔处的测站。从图 4可以清楚地看出,测站的大气可降水量与海拔高度呈负相关,其相关系数达-0.79,海拔每升高1 km,大气可降水量减少约1.4 mm。但当海拔高度相近时,大气可降水量随着纬度的升高而减少。如XJHT、XJJJ站的海拔高度分别为1.57 km、1.55 km,但两者的大气可降水量分别约为10.2 mm和9.1 mm,显然XJHT站的含量高于XJJJ站,这是由于XJHT站的纬度低于XJJJ站的纬度。XJQM和XJQH站、XJKE和XJAL站、XJRQ和XJFY站、XJYN和XJTC站、XJSH和XJBE站都是由于相同原因导致测站大气可降水量的分布存在差异。

|
图 3 2016年新疆GPS测站全年平均大气可降水量分布 Fig. 3 Annual average precipitable water vapor distribution at GPS stations in Xinjiang in 2016 |

|
图 4 2016年全年平均大气可降水量为测站海拔高的函数 Fig. 4 Annual average precipitable water vapor in 2016 as a function of the station altitude |
大气可降水量不仅受到海拔高度和地理纬度的影响,同时也受到季节变化的影响。图 5为大气可降水量分别在4个季节(春季:3~5月;夏季:6~8月;秋季:9~11月;冬季:12~2月)中的空间变化情况。可以看出,新疆地区大气可降水量具有明显的季节性变化。春季大气可降水量在6.0~11.3 mm之间,天山西部伊犁河谷地区XJYN、XJXY站以及准格尔盆地西部XJKL站大气可降水量相对较高,分别约为11.1 mm、10.7 mm和11.5 mm。天山中部XJWL站大气可降水量相对较低,约为6.0 mm。夏季是大气可降水量最多的季节,大约在12.0~23.2 mm之间,所有测站大气可降水量至少为春季的1.5倍。春、秋季是夏、冬季之间过渡的季节,因此秋季大气可降水量(5.9~11.4 mm)及分布特征与春季十分相似。大气可降水量最少的季节为冬季,大约在1.4~5.5 mm之间。阿尔泰山处的XJQH站含量最低,约为1.4 mm,天山中东部的XJWL、XJJJ、XJML站含量也不足2 mm。

|
图 5 大气可降水量在4个季节中的空间变化 Fig. 5 Spatial variations of precipitable water vapor of four seasons |
本文主要利用新疆地区陆态网GPS观测资料,结合ECMWF再分析资料中ERA-Interim模型的海平面气压和2 m温度数据,来获取各测站大气可降水量。利用探空资料获取的大气可降水量验证GPS所得结果的准确性,并分析大气可降水量在该地区的空间分布特征和季节性变化,得到结论如下:
1) 利用GPS数据获得的大气可降水量与通过探空资料积分获得的大气可降水量较为接近,相关系数可达0.976,RMSE约为2.7 mm,说明GPS-PWV资料可以反映大气中可降水量的变化特征。
2) 新疆地区大气可降水量相对较少,全年平均含量在7.0~13.0 mm之间。其空间分布大致随海拔升高呈递减趋势,海拔每升高1 km,大气可降水量减少约1.4 mm。当海拔高度大致相同时,大气可降水量随纬度的升高而减少。
3) 新疆地区大气可降水量的季节性变化明显,夏季达到最大值,含量在12.0~23.2 mm之间;冬季降至最小值,含量在1.4~5.5 mm之间;春季和秋季大气可降水量差别不大,介于夏季和冬季之间。
| [1] |
Cadeddu M P, Liljegren J C, Turner D D. The Atmospheric Radiation Measurement (ARM) Program Network of Microwave Radiometers: Instrumentation, Data, and Retrievals[J]. Atmospheric Measurement Techniques, 2013, 6(9): 2359-2372 DOI:10.5194/amt-6-2359-2013
(  0) 0) |
| [2] |
Bevis M, Businger S, Herring T A, et al. GPS Meteorology: Remote Sensing of Atmospheric Water Vapor Using the Global Positioning System[J]. Journal of Geophysical Research Atmospheres, 1992, 97(D14): 15787-15801 DOI:10.1029/92JD01517
(  0) 0) |
| [3] |
Basili P, Bonafoni S, Mattioli V, et al. Mapping the Atmospheric Water Vapor by Integrating Microwave Radiometer and GPS Measurements[J]. IEEE Transactions on Geoscience & Remote Sensing, 2004, 42(8): 1657-1665
(  0) 0) |
| [4] |
Jiang P, Ye S R, Chen D Z, et al. Retrieving Precipitable Water Vapor Data Using GPS Zenith Delays and Global Reanalysis Data in China[J]. Remote Sensing, 2016, 8(5): 389 DOI:10.3390/rs8050389
(  0) 0) |
| [5] |
杨露华, 叶其欣, 邬锐, 等. 基于GPS/PWV资料的上海地区2004年一次夏末暴雨的水汽输送分析[J]. 气象科学, 2006, 26(5): 502-508 (Yang Luhua, Ye Qixin, Wu Rui, et al. Analyses of Water Vapor Transport in a Heavy Rain in the Late Summer of 2004 in Shanghai Based on GPS/PWV Data[J]. Journal of the Meteorological Sciences, 2006, 26(5): 502-508 DOI:10.3969/j.issn.1009-0827.2006.05.005)
(  0) 0) |
| [6] |
Wang H, Wei M, Li G P, et al. Analysis of Precipitable Water Vapor from GPS Measurements in Chengdu Region: Distribution and Evolution Characteristics in Autumn[J]. Advances in Space Research, 2013, 52(4): 656-667 DOI:10.1016/j.asr.2013.04.005
(  0) 0) |
| [7] |
石小龙, 尚伦宇, 尹远渊, 等. 大连地区GPS反演大气可降水量的变化特征[J]. 高原气象, 2014, 33(6): 1648-1653 (Shi Xiaolong, Shang Lunyu, Yin Yuanyuan, et al. Variation Characteristics of Precipitable Water Vapor Inversed by GPS in Dalian[J]. Plateau Meteorology, 2014, 33(6): 1648-1653)
(  0) 0) |
| [8] |
Saastamoinen J. Atmospheric Correction for the Troposphere and Stratosphere in Radio Ranging of Satellites[J]. Use of Artificial Satellites for Geodesy, 1972, 15(6): 247-251
(  0) 0) |
| [9] |
Bevis M, Businger S, Chiswell S, et al. GPS Meteorology: Mapping Zenith Wet Delays onto Precipitable Water[J]. Journal of Applied Meteorology, 1994, 33(3): 379-386 DOI:10.1175/1520-0450(1994)033<0379:GMMZWD>2.0.CO;2
(  0) 0) |
| [10] |
王晓英, 戴仔强, 曹云昌, 等. 中国地区地基GPS加权平均温度Tm统计分析[J]. 武汉大学学报:信息科学版, 2011, 36(4): 412-416 (Wang Xiaoying, Dai Ziqiang, Cao Yunchang, et al. Weighted Mean Temperature Tm Statistical Analysis in Ground-Based GPS in China[J]. Geomatics and Information Science of Wuhan University, 2011, 36(4): 412-416)
(  0) 0) |
| [11] |
Sharifi M A, Khaniani A S, Joghataei M. Comparison of GPS Precipitable Water Vapor and Meteorological Parameters during Rainfalls in Tehran[J]. Meteorology & Atmospheric Physics, 2015, 127(6): 701-710
(  0) 0) |
| [12] |
Berg H. Allgemeine Meteorologie[M]. Bonn: Dümmler's Verlag, 1948
(  0) 0) |
| [13] |
王勇, 柳林涛, 许厚泽, 等. 利用GPS技术反演中国大陆水汽变化[J]. 武汉大学学报:信息科学版, 2007, 32(2): 152-155 (Wang Yong, Liu Lintao, Xu Houze, et al. Retrieving Change of Precipitable Water Vapor in Chinese Mainland by GPS Technique[J]. Geomatics and Information Science of Wuhan University, 2007, 32(2): 152-155)
(  0) 0) |
 2019, Vol. 39


