2. 中国气象科学研究院灾害天气国家重点实验室, 北京 100081;
3. 南京信息工程大学气象灾害预报预警与评估协同创新中心, 南京 210044
2. State Key Laboratory of Severe Weather, Chinese Academy of Meteorological Sciences, Beijing 100081;
3. Collaborative Innovation Center on Forecast and Evaluation of Meteorological Disasters, Nanjing University of Information Science & Technology, Nanjing 210044
中国是典型的季风气候国家,每年春夏季深受东亚夏季风的影响,活跃的季风加上复杂的地形特征,使我国经常出现暴雨天气过程,这与美国以龙卷等局地强对流天气为主的情况有明显的差异(陶诗言等,1979)。在全球气候变暖的背景下(IPCC,2013),我国气象灾害更加严重,防灾减灾形势越发严峻。据统计,2001—2013年,中国暴雨洪涝灾害造成年均1 312人死亡(秦大河等,2015);我国暴雨洪涝灾害在东部平原和沿海低洼地区频发,该地区人口及耕地分别占全国的40%和35%左右;随着我国高速城市化发展,城市内涝问题也日益突出,2008—2013年,全国62%的城市发生过不同程度的洪涝,其中137个城市发生3次以上洪涝灾害,城市洪涝灾害导致的直接经济损失为年均794.6亿元(秦大河等,2015)。因此,对中国暴雨的研究长期受到气象学家和社会各界人士的关注,随着探测仪器的迅速发展和极端天气不利影响的加剧,近年来气象学家开始关注极端降水的研究。
自1870年第二次工业革命以来,由人类活动导致的全球变暖现象已经成为一个不争的事实(IPCC,2013)。根据克劳修斯—克拉伯龙方程(Clausius-Clap-eyron equation),大气的含水能力随气温上升而增强,大气饱和水汽压增长速率约为7 %·K-1。如果增加的水汽能够全部降落到地面,降水量也会随气温上升而增多。相比于一般降水,强降水对大气中水汽含量的变化似乎更加敏感(Trenberth,1999)。大量的观测资料统计和数值模拟研究表明,过去半个多世纪,在气候变暖的背景下,全球日极端降水在更多(少)的地区呈现增加(减少)的趋势(Min et al., 2011;Seneviratne et al., 2012;Westra et al., 2013;Donat et al., 2016;Seneviratne et al., 2016);温度上升使得极端降水倾向于发生在更短的时间内(最多几个小时内),次日尺度极端降水的增长速率高于日尺度极端降水(Lenderink and Meijaard, 2008;Haerter and Berg, 2009;Haerter et al., 2010;Westra et al., 2014)。相比于通过长时间累积造成的强降水事件,造成短时强降水的中小尺度对流系统具有空间尺度小、发展迅速、预报难度大的特点,因此对气象业务预报、城市建设以及社会应急管理提出了更大的挑战。开展次日尺度极端降水研究是提高精细化气象服务质量、提高气象防灾减灾和应对气候变化能力的主要环节之一,具有重要的理论和应用价值。
我国次日尺度极端降水研究还处于起步阶段。其原因主要有两方面,一是过去(尤其在2010年以前)缺乏长时间序列的相关观测资料,研究只能采用日及日以上尺度的降水观测数据,这也是一直以来国际上该研究领域存在的主要困难(Zhang et al., 2017);二是传统的全球或区域气候模式对于产生次日尺度极端降水的物理过程的模拟能力有限(Hanel and Buishand, 2010;Ban et al., 2014),由于模式分辨率不够高,模拟结果受限于具有较大不确定性的物理过程参数化方案(Scinocca and McFarlane, 2004)。近年来随着我国气象业务的发展,通过2011—2012年中国气象局开展的“地面基础气象资料建设”项目,国家气象信息中心整理出了一套高质量的国家级地面观测台站(共2 420个站,覆盖全国基准、基本、一般站)从建站(最早追溯到1951年)至今的小时降水数据集,这为中国次日尺度极端降水的研究提供了重要的观测资料。利用该数据集,国内近年来开展了关于我国极端小时降水的一系列研究,本文旨在梳理这些研究进展,包括极端小时降水阈值的定义、天气背景分型、气候态特征、长期变化趋势及其与城市化的关系等,以期有助于将来继续深入研究中国次日尺度极端降水的科学问题。
1 极端小时降水的阈值定义我国目前气象业务上常用大于等于20 mm·h-1和大于等于50 mm·d-1来分别定义小时强降水和暴雨日。采用这两个阈值标准发现,我国小时强降水和暴雨日的发生频次空间分布大致相似,总体上都呈现从南向北递减的特征(Zhang and Zhai, 2011)。Chen等(2013)分析中国大陆1991—2009年4—9月小时强降水时也发现,小时降水超过10~40 mm的频次空间分布均与暴雨日(日降水≥50 mm·d-1)频次空间分布相似。
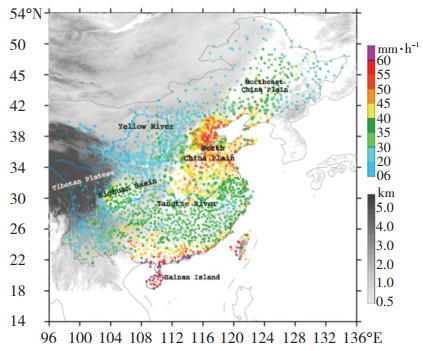
相比于业务应用,国内外学术界更多采用相对阈值法来定义极端降水。定义方式通常有两种:一是百分位法,如第95百分位(Zhai et al., 2005;Zhang and Zhai, 2011;Xiao et al., 2016;Wu et al., 2019)、第97.5百分位(Wang and Zhou, 2005)及第99.9百分位(Luo et al., 2016);二是拟合经验曲线函数,如拟合广义极值分布(李建等,2013;Li et al., 2013;Zheng et al., 2016;Wu et al., 2017)、e指数衰减曲线分布(Yu and Li, 2012)等。前一种方法更多地应用于极端小时降水长期变化趋势的研究中,以便得到有统计意义的极端小时降水样本数;后一种方法通常用来探讨5 a、10 a乃至50 a一遇的极端降水情况。李建等(2013)利用中国大陆地区1961—2010年465个气象站的逐小时降水资料,比较了采用这两种方法得到的阈值强弱差异,发现各站上第99.9百分位降水阈值在长江流域及其以南地区重现期最短(低于2 a),中部(35°N一带)次之(长于4 a),北方和西北最长(长于8 a)。但总体而言,采用相对阈值法得到的中国大陆极端小时降水阈值的空间分布特征定性一致,呈现“南强北弱、东强西弱”的总体特点,最强阈值位于华南沿海、海南岛和华北平原,次大值分别位于四川盆地和长江中下游地区(图 1)。另外,通过对比发现,台湾岛的极端小时降水阈值强度与华南沿海及海南岛的阈值强度相当。
|
图 1 中国第99.9百分位极端小时降水阈值强度的空间分布 图(单位:mm·h-1)。基于中国大陆1981—2015年和台湾地区1998—2012年的小时降水资料。用圆点表示站点有全年观测记录;星号表示站点从3月或4月开始有记录,到10月或11月停止观测;三角形表示站点有效观测时间为5月至9月,灰色阴影代表地形高度(单位:km)。 Fig. 1 Spatial distribution of extreme hourly rainfall thresholds defined as the 99.9 percentile over China (unit: mm·h-1). The hourly rainfall dataset over China mainland is from 1981—2015 and over the Taiwan area from 1998—2012. The dots denote stations having records throughout the year; stars denote stations having records from March/April to October/ November; triangles denote stations having records from May to September. Shadings represent surface elevation (unit: km). |
Zheng等(2016)采用拟合广义极值分布,通过滚动累加方式研究了中国大陆1 h、3 h、6 h、12 h和24 h累计的50年一遇极端降水的空间分布。结果表明,相比于12 h和24 h累积的极端降水,1 h、3 h、6 h累积的极端降水的空间分布更为相似,发生全国最强小时降水(其文中以等级Ⅲ定义)的站点数在30oN以南和以北大致相等,但随着研究的降水累计时长增加,30°N以南(以北)发生最强降水站点数的比例明显增加(减少),发生24 h极端降水的站点数在南部占到了全国总数的约70%,这种差异很可能与中国南方水汽更充足和降水维持时间更长有关。
2 中国极端小时降水发生的天气背景分型Luo等(2016)把中国大陆(96°E以东)和海南岛2011—2015年间发生的极端小时降水分类,根据其发生时的天气背景特征,分为四个类型:热带气旋型(TC型),地面锋面型,低涡或切变线型和弱天气尺度强迫型。分类时,首先采用客观天气分析技术判断极端小时降水是否为TC型(Ren et al., 2001, 2007, 2011),然后利用天气图和雷达组网拼图资料人工鉴别,先后判断其他三种类型,判断的顺序依次是地面锋面型、低涡或切变线型、弱天气尺度强迫型。锋面型有两条判断标准:(1)极端小时降水发生时,在地面天气图上有一条锋面,且极端小时降水发生的位置距离锋面不超过50 km;(2)在雷达回波图上,极端小时降水所在的雨带尺度超过500 km。低涡或切变线型与锋面型的判断方法类似:(1)在低层(东部平原为850 hPa,西部高原地区为700 hPa)天气图上有气旋性低涡或切变线,极端小时降水发生在低涡气旋性环流中,或发生在距离切变线200 km的距离内;(2)在雷达回波图上,极端小时降水所在的雨带尺度超过500 km。没有被判断为以上三类的则归入弱天气尺度强迫型。
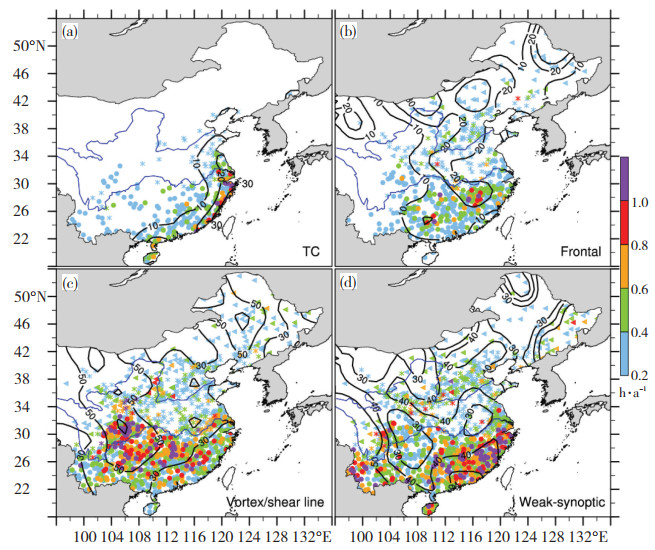
2011—2015年这四种类型极端小时降水在分析区域内的平均占比分别是:TC型占8%(1981—2015年占比10.6%),地面锋面型占13.9%,低涡或切变线型占39.1%,弱天气尺度强迫型占39%。它们显示出不同的区域分布特征(图 2):TC型主要发生在中国东南和华南沿海,占到了当地极端小时降水总发生频次的30%左右。地面锋面型在104°E以东分布较为均匀,大约占到当地总频次的10%~20%。低涡或切变线型在四川盆地有一个显著的高频中心,占当地的70%左右;从该中心向外沿偏东南方向延伸至中国东南部为次大值带,占当地的30%~50%;东北地区中部占比也高达60%左右。弱天气尺度强迫型在中国东南部、西南部、华北平原和东北地区东部均有相对高频中心,占当地总频次的40%—50%左右。
|
图 2 四种天气背景下2011—2015年极端小时降水发生频次(单位:h·a-1)的空间分布图:(a)热带气旋型,(b)地面锋面型,(c)低涡或切变线型和(d)弱天气尺度强迫型。彩色点表示该类型极端小时降水发生的频次(单位:h·a-1),黑色等值线表示该类型发生频次占所有类型发生频次的百分比(%)。不同形状的点(圆点、星号和三角)分别代表三组观测起止月份不同的站点:1—12月,4—10月和5—9月(Luo et al., 2016) Fig. 2 Spatial distributions of the occurrence frequency of the four extreme rainfall types (unit: h·a-1) during 2011—2015: (a) TC, (b) frontal, (c) vortex or shear line, and (d) weak-synoptic. The colored symbols denote the numbers of annual occurrence (unit: h·a-1) while the black lines represent the fractional contribution (%) to the annual total occurrence of all the types. The different shapes (dot, star, and triangle) represent the three groups of stations with data in different months: January-December, April-October, and May-September, respectively (Luo et al., 2016) |
李争辉(2019)基于华南(主要包括广东和广西)稠密的自动气象站资料,对2011—2017年华南前汛期(4—6月)南海季风爆发前后两个阶段的极端小时降水天气背景进行对比分析,并建立了相应的概念模型(图 3)。结果表明,南海季风爆发后极端小时降水的日平均频次升高40%,但是前后两个阶段最主要的类型均为弱天气尺度强迫型(又称为“弱梯度型”;占比43%、35%)和地面锋面型(占比39%、34%),前者的高频中心位于广东中部和沿海以及广西南部,后者的高频中心位于广西;低涡或切变线型极端小时降水的比例在季风爆发后从18%上升到31%,且广西的频次高于广东。

|
图 3 华南前汛期四类极端小时降水天气背景的概念模型:(a)地面锋面型,(b)低涡型,(c)切变线型,(d)弱梯度型。蓝色实线代表850 hPa位势高度,绿色实线代表850 hPa相当位温,字母“L”代表850 hPa天气尺度低压中心,蓝色箭头代表850 hPa水平风矢量。(a)中带三角型的粗蓝色线表示地面锋面,(b)和(c)中棕色线代表850 hPa切变线,紫色阴影区域代表700 hPa垂直上升速度大值区,绿色、黄色和红色阴影分别代表雷达反射率为20、40和50 dBZ, 黑色实线代表海岸线,浅蓝色阴影代表海洋(李争辉,2019) Fig. 3 Schematic diagrams of synoptic conditions at the time of the four EXHR types over South China during the pre-summer rainy season (Apr-Jun): (a) surface front, (b) low-level vortex, (c) shear line, and (d) weak gradient. Blue and green contours represent geopotential height and equivalent potential temperature at 850 hPa. The letter"L"denotes synoptic-scale low pressure center. Blue arrows denote 850 hPa horizontal winds. Thick blue line with double triangles in (a) represents surface front. Thick brown lines in (b) and (c) denote shear lines at 850 hPa. The area of purple shading indicates where 700 hPa ascent is maximized. Shadings in green, orange, and red represent radar reflectivity values of roughly 20, 40, and 50 dBZ, respectively. The area of light blue shading to the south of the coastline (denoted by thick black line) indicates the water surface(Li Zhenghui, 2019) |
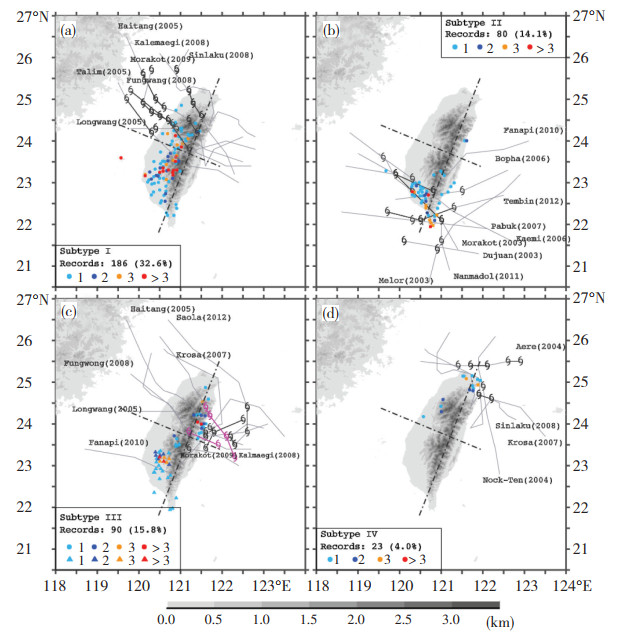
Wu等(2017)采用5 a、10 a和20 a回归阈值定义极端小时降水,统计分析了台湾岛2003—2012年间发生的极端小时降水,结果表明,TC型是台湾极端小时降水的主要类型(频次占比高达75—77%),锋面型和弱天气尺度强迫型发生比例相当(分别占9—13%),而切变线和低涡型仅占大约1%。台湾极端小时降水在5月至6月中旬主要由梅雨锋造成,在7月至10月主要由热带气旋造成。针对TC型进一步分析发现,当TC中心登陆或靠近台湾岛(< 100 km)时,TC环流与台湾岛地形的直接相互作用对岛上极端降水分布起到了主导性的作用(Chang et al., 2013),TC中心相对于台湾岛的四个方位角(即西北、南、东和东北)基本决定了岛上最强降水发生的不同位置(图 4)。而当TC中心远离台湾岛(> 100 km),产生岛上极端小时降水时,TC中心主要位于台湾岛的西北/北和西南/南方向。当TC中心在台湾的西北或北方向时,TC环流与西南夏季风的共同影响容易在台湾西部造成极端小时降水;当TC中心位于台湾的西南或南方向时分为两种情况,分别受到地形和东北冬季风两个不同因素的主要影响,极端小时降水分别集中在台湾东部沿海地区和东北部“V”字口地形处。
|
图 4 台湾岛热带气旋(TC)型极端降水的四种子类型Ⅰ—Ⅳ的空间分布图。彩色圆点表示站点上该类型累计的总发生频次,灰色曲线为TC中心移动路径,极端小时降水发生时的台风中心用其标志标注出,TC名字和发生年份在路径边写出。每种类型下发生记录数以及其占TC型的百分比(单位:%)在每个小图框中标出。在图(c)中,2008年台风海鸥(Kalmaegi)和2009年台风莫拉克(Morakot)用玫红色特别标注,其产生的极端小时降水记录用三角形标注(Wu et al., 2017) Fig. 4 Spatial distribution of subtypes Ⅰ-Ⅳ in the TC-type extreme precipitation (colored dots), and the corresponding TC tracks. The colors of the dots denote the number of records occurring at each station. The location of the TC center, when extreme hourly rainfall occurs, is highlighted by typhoon symbols in black. The name and year of each TC are labeled. The number of records in each subtype and their fractional contribution (unit:%)to the total number of the TC type are labeled in the box inside each panel. In (c) the typhoon symbols in rose red represent the centers of Typhoon Kalmaegi(2008) and Typhoon Morakot (2009), and triangles denote the extreme precipitation records they produced (Wu et al., 2017) |
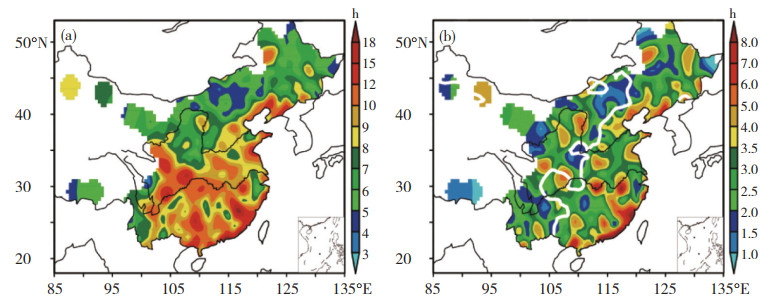
Li等(2013)定义“极端小时降水事件”为:站点连续观测到发生降水(≥0.1 mm·h-1)的一段时间,其中最多只有1 h的降水间断,并且至少发生一次极端小时降水。采用此定义,分析中国中东部地区降水事件的特征,包括事件维持时间(即降水事件开始到结束的总小时数)和降水演变特征。结果表明,东南沿海和长江中下游一带的降水事件一般要维持12 h以上,而在华北则较短(< 6 h);相比于平原地带,在地势起伏较大的地区更容易快速发展出强降水(图 5)。Yu等(2013)提出降水过程的演变具有不对称性,即从降水开始至到达雨量峰值较为迅速,而从出现峰值至降水结束则变化较为缓慢;通过对比分析发现,这种不对称性在小时降水峰值越强、地形复杂的中国西部(如青藏高原东侧、横断山脉及云贵高原)、降水峰值出现于1400—0200 LST(“当地太阳时”简称LST)的降水事件中更为明显。Wu等(2017)采用相似的定义,研究台湾岛极端小时降水事件,发现由热带气旋造成的极端小时降水事件的时间演变较为对称,但锋面型和弱天气尺度强迫型则较为不对称。热带气旋造成的台湾岛上极端小时降水事件的维持时间通常较长(约75%的事件维持时间>12 h),而锋面型和弱天气尺度强迫型的维持时间则较短(约90%的事件维持时间 < 6 h)。
|
图 5 5 a回归阈值的极端小时降水事件的平均维持时间(单位:h)的空间分布图(a); (b)与(a)类似,但是为降水事件开始到降水峰值的时间(单位:h),白色等值线为1 200 m地形高度处(Li et al., 2013) Fig. 5 Distribution of average rainfall duration (unit: h) for precipitation events of 5 a return period; (b) as in (a), but for duration from precipitation occurrence to precipitation peak (unit: h). White thick curve denotes the topographic height contour of 1 200 m. (Li et al., 2013) |
Li等(2013)分析中国大陆各地区极端小时降水开始和结束的时间,结果表明,极端小时降水最早于4月发生在华南,纬度越高出现的时间越晚,华北要到6月下旬才开始出现;9月以后全国大部分地区不再有极端小时降水发生,只有在华南沿海、中国西南地区的南部可以持续到10月甚至更晚。Luo等(2016)进一步分析中国大陆八个地区和海南岛极端小时降水的季节变化,发现各地区极端小时降水发生频次的峰值月份和影响天气系统各有特点:海南岛和华南沿海地区极端小时降水发生的季节跨度最大(3—11月),华南沿海地区在5月有显著的峰值,占全年总发生频次的31%,且主要是发生在弱天气尺度强迫背景下,而海南岛的峰值则出现在7月,且弱天气尺度强迫型为其整个暖季(4—9月)的主要类型;处于相似纬度带的四川盆地、华中地区和中东部沿海地区的频次峰值分别出现在7月、6月和8月,且主要的天气系统各不相同;云南地区6— 9月的逐月频次差别不大(16.4~23.7%),且主要为弱天气尺度强迫型;在长江以北的淮河中游、华北平原和东北平原三个地区,极端小时降水均集中发生在7—8月,占到了当地总发生频次的76~88%,主要发生在低涡或切变线和弱天气尺度强迫的天气背景下。
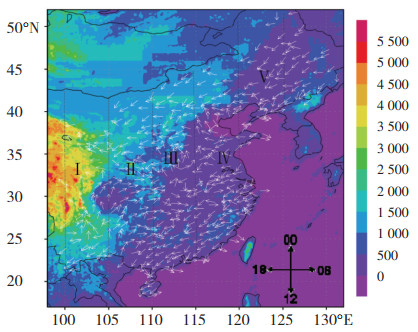
3.3 极端小时降水发生频次的日变化极端小时降水的日变化特征总体上与总降水(≥ 0.1 mm·h-1)的日变化特征较为一致,由于受到不同的大尺度环流条件和下垫面特征(如地形、海陆差异和地表类型差异)等因素的影响而呈现出区域特色(Yu et al., 2007a, 2007b;Yuan et al., 2012;宇如聪等,2014)。极端小时降水在云南、华南、华北和东北地区发生频次的高峰出现在傍晚(1700 LST前后),在贵州和四川盆地频次高峰出现在清晨(0400 LST前后),青藏高原东部的频次峰值出现在2100 LST前后(Zhang and Zhai 2011)(图 6)。Luo等(2016)进一步揭示我国一些地区还存在极端小时降水发生频次日变化的次峰:在华北平原和东北平原次峰值出现在0000—0300 LST,华中和华南地区出现在0600—0900 LST,云南地区则出现在0300—0600 LST。
|
图 6 极端小时降水发生频次的日变化分布图。箭头指向表示极端小时降水发生频次最多的当地时间(相位时钟)。彩色阴影表示地形高度(单位:m)(Zhang and Zhai, 2011) Fig. 6 Diurnal cycle of the hourly extreme precipitation frequency. Vectors denote the local solar time (LST) when the frequency occur (phase clock). The colors indicate altitude (unit: m) (Zhang and Zhai, 2011) |
关于造成极端小时降水日变化的物理机制,午后的极端小时降水事件维持时间通常较短(< 3 h),此降水峰值在我国大多数地区都被观测到,普遍认为是太阳辐射日变化导致的低层大气不稳定增强所致(Dai et al., 1999)。海南岛和台湾岛午后的峰值相比于大陆地区要更加显著,且主要发生在弱天气尺度强迫下(Luo et al., 2016;Lin et al., 2011;Wu et al., 2017),这可能是由于海岛所在位置纬度较低,地形复杂,加之四面环海,这种独特的地理条件所产生的山地-平原环流和海陆环流的叠加效应大大增强了局地热力环流,午后通过海风输送的高相当位温空气被山地抬升,使得局地热对流更容易在迎风坡发生(Wang and Kirshbaum, 2015;Liang and Wang, 2017)。而夜间和清晨发生的极端小时降水事件的维持时间一般更长(>6 h),此峰值的形成与夜间加速的低空急流(Yu et al., 2009;Chen et al., 2010;Du and Chen, 2018)、边界层内非地转风的惯性振荡(Xue et al., 2018;Zhang et al., 2019)、山地-平原热力环流(He and Zhang, 2010;Sun and Zhang, 2011)、云顶的长波辐射冷却(Yin et al., 2009)等因素有关。
4 中国极端小时降水的变化趋势及其与城市化的关系Zhang和Zhai(2011)分析1961—2000年地面小时雨量资料发现,极端小时降水(大于第95百分位)发生频次在中国东部大部分地区呈现增长的趋势,尤其是东北、长江中下游地区,但在华北地区呈现减少的趋势;在云贵高原和长江中下游一带,极端小时降水在夜间的增长速率相比白天的显著。Xiao等(2016)利用1971—2013年小时雨量资料研究发现,中国夏季极端小时降水量(大于极端小时降水阈值的小时降水总量)和最大小时降水量在大部分地区均呈现增长趋势,出现增长趋势的站点数目分别占到了总站点数的81%和72%;在中国北方和西南地区,夏季极端小时降水量和最大小时降水量大致呈增长趋势(图 7b和7c),但是夏季总降水量呈减少趋势(图 7a),这说明这些地区的干旱和极端短时降水这两种灾害性天气都有增多的趋势。在华南,Fu等(2016)研究表明小时降水有显著增长的趋势,其中占到总降水量约57.1%的极端小时降水(大于第90百分位)增长趋势最为明显,极端小时降水的增加约有10%是由降水强度增强导致的,90%是降水发生频次升高的贡献,这可能会进一步增加华南洪涝灾害的风险性。从物理机制分析上看,该研究认为,通过改变西太平洋副高的活动,全球变暖可能是华南极端小时降水显著增长的根本原因,而其直接的触发机制是华南低层涡度的增强。于淑婷等(2019)分析云南省极端小时降水(大于第95百分位)在1982—2016年的变化时发现,夏秋两季的增强趋势显著(通过显著水平α=0.05的M-K检验),极端小时降水强度增强趋势在全省都有分布,减弱趋势仅出现在云南中部个别站点。

|
图 7 1971—2013年间(a)夏季总降水量,(b)超过小时降水(>0.1 mm·h-1)第95百分位的降水总量,(c)年最大小时降水量的线性变化趋势(单位: mm·(10 yr)-1)。实心圆表示通过90%的信度检验,圆圈大小表示变化的大小,蓝色表示正趋势(Xiao et al., 2016) Fig. 7 Linear trends (unit: mm·(10 yr)-1) of (a) summer total precipitation, (b) integral precipitation amount above the 95th percentile of hourly rainfall intensity for wet hours (> 0.1 mm·h-1), and (c) maximum hourly precipitation rate over the period 1971—2013, where solid bullets show that the trends are above the 90% confidence level and the size of the symbol shows the value of the trends with blue being positive (Xiao et al., 2016) |
中国近三十年来城市化发展迅速,以北京、上海、广州为中心形成了中国三大城市群(京津冀、长三角和珠三角)。在城市地区,影响次日尺度极端降水变化的因子更为复杂,各个因子之间有时会相互抵消。城市热岛效应、人为气溶胶排放、城市下垫面摩擦以及建筑物的阻挡作用,都会影响降水在城市所在地原本的分布形态,并且不同于对温度的影响,降水变化大值区可能不集中在城市中心,而是根据不同的地理特征和天气背景而变(Wang et al., 2012;Han et al., 2014;Zhang et al., 2014;Song et al., 2014)。
对北京地区多年暖区降水事件统计发现,在北京平原地区和东北部的山区,超过一半的暴雨日(≥50 mm·d-1)伴随有小时强降水(≥20 mm·h-1)发生(Li et al., 2017a);短时(1—6 h)强降水(>25 mm·h-1)事件对北京城区夏季降水量和降水发生频次的贡献最大(Yang et al., 2012);北京快速城市化过程与夏季总降水量减少、降水日数减少、日降水强度增加有统计显著正相关(Lu,2003;Wei et al., 2008;Zhang et al., 2009;Zhang et al., 2014)。但是,极端小时降水的频次变化似乎并无统计显著性(图 7b, c),这可能与站点空间密度较稀疏有关。利用北京稠密的自动站资料研究表明,当北京城市处于弱热岛效应时,夏季对流系统主要受到城市建筑物阻挡作用而发生绕流;而在强热岛效应期间,城市的热力作用起到了激发或加强对流系统的作用,因而降水最大值落于城市化最明显的地区(Dou et al., 2015;Li et al., 2017b)。Miao等(2011)通过个例的数值模拟研究表明,随着北京城市化的发展,城市热岛效应和大气垂直混合变强、边界层变厚、逆温层减弱,从而有利于在城市中发展对流、增强最大雨强和累计雨量。
对于长三角地区,Liang和Ding(2017)利用上海长达百年的小时降水数据,分析发现极端小时降水的发生频次和降水量呈现增加的趋势,尤其是在1980年以后城市化发展迅速的30多年间,且增加的极端小时降水事件具有短时(1—6 h)、突发的特征;从空间分布上看,上海城市呈现出明显的“雨岛”特征,相比郊区,极端小时降水在市中心的增加幅度更大(图 8);城市化对极端小时降水发生频次增多和强度增强都有较大的贡献,从而导致了对极端小时降水量增大的显著贡献。对长三角地区5年(2006—2010年)三组数值模拟试验对比发现,城市化对下午(1200—2000 LST)极端小时降水(5年大于格点第95百分位)发生频次的影响最为明显,并且在天气尺度强迫较弱的情况下更明显(Zhong et al., 2017):一方面,城市下垫面加强午后的热岛效应和地表粗糙度,从而增强了城市上空大气低层辐合与高层辐散,下午上升气流的加强,中低层云水含量增加,从而有利于极端小时降水发生;另一方面,城市气溶胶排放的增多使得白天更多的太阳辐射被气溶胶吸收和散射,下午的对流不稳定能量减少,从而不利于极端小时降水的发生。

|
图 8 1981—2014年暖季(4—9月)极端小时降水(a)发生频次(单位:(10 a)-1)和(b)降水量(单位:mm·(10 a)-1)变化趋势的空间分布图(Liang and Ding, 2017) Fig. 8 Spatial distribution of the trend of (a) the occurrence frequency (units: (10 a)-1) and (b) total precipitation amount (units: mm·(10 yr)-1) of extreme hourly precipitation in April-September during 1981—2014 (Liang and Ding, 2017) |
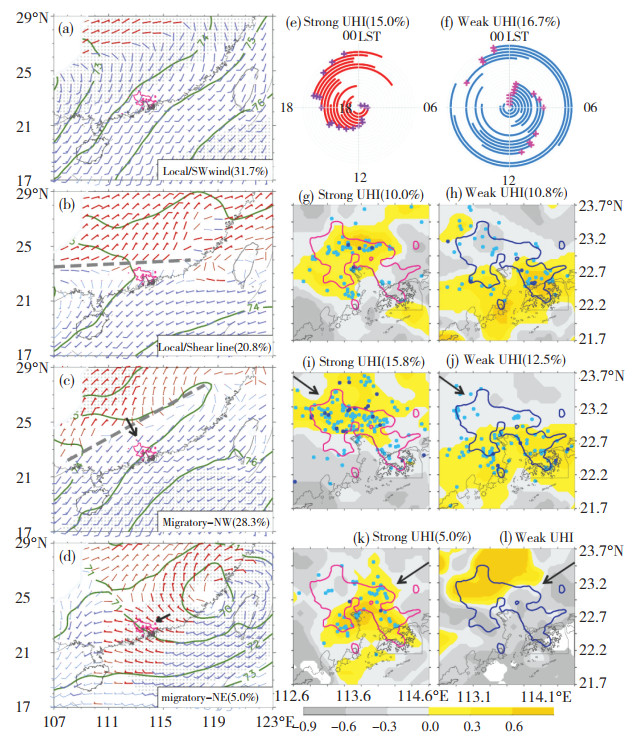
对珠三角地区的研究发现,城市群地区相比周围其它地区的暴雨日有所增加而弱降水有所减少(Kaufmann et al., 2007;Seto and Kaufmann, 2009;Li et al., 2011)。Wu等(2019)最近发现珠三角城市群地区极端小时降水发生频次和降水量在1971—2016年显著增长,显著增加的极端小时降水主要发生在短时(≤6 h)、突发的降水事件中,且这种增长趋势在快速城市化期间(90年代初以来)比之前二十多年的幅度更大。Wu等(2019)统计分析2011—2016年珠三角地区共120起极端小时降水事件(含至少一次小时降水记录大于60 mm·h-1),结果表明,尽管它们发生在不同的月份(4—9月)和天气背景下,强城市热岛效应对小时降水都有明显的增强作用,尤其是在热岛效应最为显著的城市群内陆地区。对于珠三角地区局地发生发展的对流系统:当其受到边界层偏西南气流影响时(图 9a),强城市热岛和海风共同作用很可能是城区及其下风方对流在午后强烈发展产生极端小时降水的主要原因,而弱热岛效应下,对流系统倾向在夜间触发,且维持时间普遍长于强热岛事件(图 9e vs. 9f);当局地对流系统受到边界层内一条东西向浅薄切变线影响时(图 9b),强热岛背景下极端小时降水和累积降水大值区都位于热岛效应最显著的珠三角城市群北部,而弱热岛背景下则集中在南部海岸线一带(图 9g vs. 9h)。对于从外部移入珠三角地区的对流系统(图 9c和图 9d),当城市热岛的强度较强时,极端小时降水和累积降水大值区均落于降水系统移来方向的城市群地区,而在弱热岛背景下并未发现这一特征(图 9i vs. 9j和图 9k vs. 9l)。
|
图 9 2011—2016年珠三角地区极端小时降水事件的四种不同类型925 hPa环流合成图:(a)局地/西南气流型,(b)局地/切变线型,(c)西北移入型,(d)东北移入型。绿色等值线为位势高度场(gpm),风向标表示水平风场(m·s-1)。灰色圆点和粗的风向标分别表示该位势高度和风速通过了90%的学生t检验。黑色箭头表示对流系统移动的方向。每种类型发生的数目占到2011—2016年总事件数(120起)的比例也写于图中括号内。图中灰色阴影表示地形高于925 hPa的地区。(e)—(f)为(a)局地/西南气流型中强、弱热岛情况下的时间分布情况。十字星表示事件开始的时间。(g)—(h)为(b)局地/切变线型下强、弱热岛情况下降水的合成空间分布图,阴影表示标准化处理后平均小时降水强度,圆点表示超过60 mm·h-1记录的总次数,浅蓝色(深蓝色)表示该类型下该站总共发生一次(超过一次)。(i)—(j)和(k)—(l)类似(g)—(h),但分别表示(c)西北移入型和(d)东北移入型(根据Wu et al., 2019重新绘制) Fig. 9 Composite geopotential height (gpm; green lines) and wind barbs at 925 hPa for the four types of the 2011—2016 extreme rainfall events: (a) local/ SW wind, (b) local/shear line, (c) migratory-NW and (d) migratory-NE types. A full barb is 5 m·s-1. The grey dots and bold wind barbs denote the values that are over the 90% confidence level using the Student t test. A black arrow denotes the movement direction of the associated rainy system. The contribution of each type to the total number of the 2011-2016 extremes (120) is labeled in parentheses. The gray-shaded regions denote the portions of isobaric surfaces underneath the ground. (e)-(f) are the timing of the (a) local/SW wind type events with a strong/weak UHI. The beginning time of each event is marked with a cross. (g)-(h) are the composite spatial distribution of region—normalized rainfall amount (shading) for the (b) local/shear line type. Blue (dark blue) dots denote hourly rainfall records exceeding 60 mm·h-1 occur once (more than once) in total among this type. (i)-(j) and (k)-(l) are similar to (g)-(h) but for the (c) migratory-NW type and (d) migratory-NE type (Redrawn based on Wu et al., 2019) |
本文总结有关中国极端小时降水近十来年的研究成果,首先介绍了极端小时降水的定义方法,给出了中国极端小时降水发生的主要天气背景类型,气候态特征,长期变化趋势及其与城市化的关系,可为科研和业务人员及时掌握中国极端小时降水的研究现状、为今后深入开展次日尺度极端降水的研究提供一些参考依据。现将主要结果总结如下:
(1) 极端小时降水的定义主要采用固定阈值、百分位阈值和拟合经验函数三种方法,三种方法在业务预报和学术研究中都有较为广泛的应用,具体采用哪种方法应根据研究问题的需求而定。
(2) 根据中国极端小时降水发生的天气背景特征主要将其分为四大类型:热带气旋型、锋面型、低涡或切变线型、弱天气尺度强迫型。针对中国不同地区,已有统计分析揭示了每种类型极端小时降水的空间分布、季节变化和日变化的具体特征,这些研究结果可以为业务上强降水的预报预测以及对天气和气候模式评估提供参考。
(3) 中国极端小时降水发生的季节变化和日变化特征具有较大的区域差异。纬度越低极端小时降水发生的季节跨度越大,在中国北方则基本集中在夏季的7—8月。不同区域的日变化特征与总降水的日变化特征基本相似,主要受到大尺度环流条件和局地下垫面影响。包含极端小时降水的降水事件在中国东南沿海、长江中下游一带一般要维持12 h以上,而在华北则较短(< 6 h)。在地形复杂的西部地区,降水事件具有时间演变不对称性,即从降水开始至出现雨量峰值较为快速,而从峰值至事件结束则较为缓慢。
(4) 过去50多年,中国极端小时降水的变化趋势呈现正负相间的空间分布特征。京津冀城市强热岛效应有助于激发或加强对流系统,从而有利于短时强降水的发生;上海呈现出明显的“雨岛”特征,年极端小时降水频次和降水量在1980年以后三十多年间呈现显著增加的趋势,市中心相比郊区增加的幅度更大;在珠三角城市群地区,极端小时降水发生频次显著升高,城市强热岛效应对局地发展和从外移入的对流系统产生的小时降水都有明显的增强作用,尤其是在热岛最为显著的城市群内陆地区。
次日尺度极端降水的产生和变化受到多尺度天气系统、局地下垫面强迫(地形、大城市群和海陆分布等)、全球变暖、气溶胶排放等多种复杂因子的综合影响。在目前已经获得的研究成果基础上,利用不断改善的观测条件和持续提升的数值模拟能力,开展更加深入和系统的研究,有望进一步深化对其形成机理和变化趋势的认识。一方面,能够观测到大气尤其是边界层精细结构和云降水微物理过程的先进设备在北京、广东等局部地区开始涌现,具备观测云和气溶胶特性能力的飞机开始被应用于针对强降水的外场观测试验中,风云四号等新一代气象卫星全面提高了对地球表面、大气和云物理参数的多光谱、高频次、定量探测能力,这些将提供新的、更综合性的观测资料,用于研究中小尺度对流系统的触发和发展过程以及降水系统内部动力和云降水微物理结构,并可用于模式物理过程参数化方案的深度检验和优化;另一方面,在描述降水日变化、中尺度对流系统结构等方面,对流可分辨模拟表现出比传统气候模拟更加优越的性能(Prein et al., 2015),目前对中国地区的多季或多年对流可分辨模拟已经开始出现(Li et al., 2018),可以利用模拟输出资料针对极端小时降水开展更深入的分析。
随着现代化观测技术和数值模拟技术的不断发展,未来关于我国次日尺度极端降水的研究可重点关注以下几个方面:
(1) 开展3 h、6 h等不同累计时长的次日尺度极端降水的系统性研究,更全面地了解中国次日尺度极端降水的时空分布和演变特征。
(2) 深入研究产生我国次日尺度极端降水的多尺度作用机理,包括地形、大城市群、海陆分布的协同影响机制,以及低空急流(Du and Chen, 2018)等天气系统的结构和作用,完善现有物理机制认识和概念模型。如最近研究发现,华南沿海次日尺度极端降水的产生是局地地形、城市强热岛、边界层急流、西南低空急流、对流系统反馈等复杂相互作用的结果(Wang et al., 2014; Wu and Luo, 2016; Liu et al., 2018; Du and Chen, 2019)。
(3) 利用不断涌现的新型雷达、卫星和闪电观测资料,分析我国各地区极端降水的云微物理过程特征,揭示不同天气背景下,暖雨过程、混合相和冰相云微物理过程的相对重要性,并用于模式云物理参数化方案的优化和改进。例如,利用广州双偏振雷达观测资料分析表明,活跃的暖雨过程可以造成珠三角极强的暖区降水(Luo et al., 2019),而TRMM卫星测雨雷达观测资料则显示在华南和江淮地区最强10%的中尺度对流系统内部存在由活跃的淞附过程产生的霰或者冰雹(Luo et al., 2013);华南季风降水试验(Luo et al., 2017)获取的观测资料被用于深度评估和改进云微物理参数化方案(Qian et al., 2018; Furtado et al., 2018)。
(4) 深入研究我国次日尺度极端降水发生了什么变化?未来将如何改变?其原因是什么?借助对流可分辨区域模拟和更加完备的观测资料,重点研究全球变暖、大尺度环流演变、城市下垫面改变、人为气溶胶排放的影响。
李建, 宇如聪, 孙溦. 2013. 中国大陆地区小时极端降水阈值的计算与分析[J]. 暴雨灾害, 32(1): 11-16. |
李争辉.2019.华南前汛期降水及其天气背景的统计特征[D].北京: 中国气象科学研究院
|
秦大河, 张建云, 闪淳昌, 等. 2015. 中国极端天气气候事件和灾害风险管理与适应国家评估报告[M]. 北京: 科学出版社, 2-3.
|
陶诗言, 丁一汇, 周晓平. 1797. 暴雨和强对流天气的研究[J]. 大气科学, 3(3): 227-238. |
宇如聪, 李建, 陈昊明, 等. 2014. 中国大陆降水日变化研究进展[J]. 气象学报, 72(5): 948-968. |
于淑婷, 罗亚丽, 李建.2019.1982—2016年云南省不同强度降水气候态及其变化[J].暴雨灾害.待发表.
|
Ban N, Schmidli J, Schaer C. 2014. Evaluation of the convection-resolving regional climate modeling approach in decade-long simulations[J]. Journal of Geophysical Research: Atmospheres, 119(13): 7889-7907. DOI:10.1002/2014JD021478 |
Chang C P, Yang Y T, Kuo H C. 2013. Large increasing trend of tropical cyclone rainfall in Taiwan and the roles of terrain[J]. Journal of Climate, 26(12): 4138-4147. DOI:10.1175/JCLI-D-12-00463.1 |
Chen H, Yu R, Li J, et al. 2010. Why nocturnal long-duration rainfall presents an eastward-delayed diurnal phase of rainfall down the Yangtze River Valley[J]. Journal of Climate, 23(4): 905-917. DOI:10.1175/2009JCLI3187.1 |
Chen J, Zheng Y G, Zhang X L, et al. 2013. Distribution and diurnal variation of warm-season short-duration heavy rainfall in relation to the MCSs in China[J]. Acta Meteorologica Sinica, 27(6): 868-888. DOI:10.1007/s13351-013-0605-x |
Dai A, Giorgi F, Trenberth K E. 1999. Observed and model-simulated diurnal cycles of precipitation over the contiguous United States[J]. Journal of Geophysical Research: Atmospheres, 104(D6): 6377-6402. DOI:10.1029/98JD02720 |
Donat M G, Lowry A L, Alexander L V, et al. 2016. More extreme precipitation in the world's dry and wet regions[J]. Nature Climate Change, 6(5): 508-513. DOI:10.1038/nclimate2941 |
Dou J, Wang Y, Bornstein R, et al. 2015. Observed spatial characteristics of Beijing urban climate impacts on summer thunderstorms[J]. Journal of Applied Meteorology and Climatology, 54(1): 94-105. DOI:10.1175/JAMC-D-13-0355.1 |
Du Y, Chen G. 2018. Heavy rainfall associated with double low-level jets over southern China.Part Ⅰ: Ensemble-based analysis[J]. Monthly Weather Review, 146(11): 3827-3844. DOI:10.1175/MWR-D-18-0101.1 |
Du Y, Chen G. 2019. Heavy rainfalls associated with double low-level jets over Southern China.Part Ⅱ: Convection initiation[J]. Monthly Weather Review, 147(2): 543-565. DOI:10.1175/MWR-D-18-0102.1 |
Fu S, Li D, Sun J, et al. 2016. A 31-year trend of the hourly precipitation over South China and the underlying mechanisms[J]. Atmospheric Science Letters, 17(3): 216-222. DOI:10.1002/asl.645 |
Furtado, K, Field P R, et al. 2018. Cloud Microphysical Factors Affecting Simulations of Deep Convection During the Presummer Rainy Season in Southern China[J]. Journal of Geophysical Research: Atmospheres, 123(18): 10477-10505. DOI:10.1029/2017JD028192 |
Haerter J O, Berg P. 2009. Unexpected rise in extreme precipitation caused by a shift in rain type?[J]. Nature Geoscience, 2(6): 372-373. DOI:10.1038/ngeo523 |
Haerter J O, Berg P, Hagemann S. 2010. Heavy rain intensity distributions on varying time scales and at different temperatures[J]. Journal of Geophysical Research: Atmospheres, 115: D17102. DOI:10.1029/2009JD013384 |
Han Z, Yan Z, Li Z, et al. 2014. Impact of urbanization on low temperature precipitation in Beijing during 1960-2008[J]. Advances in Atmospheric Sciences, 31(1): 48-56. DOI:10.1007/s00376-013-2211-3 |
Hanel M, Buishand T A. 2010. On the value of hourly precipitation extremes in regional climate model simulations[J]. Journal of Hydrology, 393(3-4): 265-273. DOI:10.1016/j.jhydrol.2010.08.024 |
He H, Zhang F. 2010. Diurnal variations of warm-season precipitation over northern China[J]. Monthly Weather Review, 138(4): 1017-1025. DOI:10.1175/2010MWR3356.1 |
IPCC.2013.Climate Change 2013: The Physical Science Basis[M].Contribution of Working Group I to the Fifth Assessment Report of the Intergovernmental Panel on Climate Change, Stocker et al., Eds., Cambridge University Press: 1535 pp, doi: 10.1017/CBO9781107415324.
|
Kaufmann R K, Seto K C, Schneider A, et al. 2007. Climate response to rapid urban growth: evidence of a human-induced precipitation deficit[J]. Journal of Climate, 20(10): 2299-2306. DOI:10.1175/JCLI4109.1 |
Lenderink G, Meijgaard E. 2008. Increase in hourly precipitation extremes beyond expectations from temperature changes[J]. Nature Geoscience, 1(8): 511-514. DOI:10.1038/ngeo262 |
Li H, Cui X, Zhang D L. 2017a. A statistical analysis of hourly heavy rainfall events over the Beijing metropolitan region during the warm seasons of 2007-2014[J]. International Journal of Climatology, 37(11): 4027-4042. DOI:10.1002/joc.4983 |
Li H, Cui X, Zhang D L. 2017b. On the initiation of an isolated heavy-rain-producing storm near the central urban area of Beijing metropolitan region[J]. Monthly Weather Review, 145(1): 181-197. DOI:10.1175/MWR-D-16-0115.1 |
Li J, Yu R, Sun W. 2013. Duration and seasonality of hourly extreme rainfall in the central eastern China[J]. Acta Meteorologica Sinica, 27(6): 799-807. DOI:10.1007/s13351-013-0604-y |
Li W, Chen S, Chen G, et al. 2011. Urbanization signatures in strong versus weak precipitation over the Pearl River Delta metropolitan regions of China[J]. Environmental Research Letters, 6(3): 034020. DOI:10.1088/1748-9326/6/3/034020 |
Li P, Furtado K, Zhou T, et al. 2018. The diurnal cycle of East Asian summer monsoon precipitation simulated by the Met Office Unified Model at convection-permitting scales[J]. Climate Dynamics: 1-21. DOI:10.1007/s00382-018-4368-z |
Liang P, Ding Y. 2017. The long-term variation of extreme heavy precipitation and its link to urbanization effects in Shanghai during 1916-2014[J]. Advances in Atmospheric Sciences, 34(3): 321-334. DOI:10.1007/s00376-016-6120-0 |
Liang Z, Wang D. 2017. Sea breeze and precipitation over Hainan Island[J]. Quarterly Journal of the Royal Meteorological Society, 143(702): 137-151. DOI:10.1002/qj.2952 |
Lin P F, Chang P L, Jou B J D, et al. 2011. Warm season afternoon thunderstorm characteristics under weak synoptic-scale forcing over Taiwan Island[J]. Weather Forecasting, 26(1): 44-60. DOI:10.1175/2010WAF2222386.1 |
Liu X, Luo Y, Guan Z, et al.2018: An extreme rainfall event in coastal South China during SCMREX-2014: Formation and roles of Rainband and Echo trainings[J].Journal of Geophysical Research: Atmospheres, 123: 9 256-9 278.https: //doi.org/10.1029/2018JD028418
|
Lu R. 2003. Linear relationship between the interdecadal and interannual variabilities of North China rainfall in rainy season[J]. Chinese Science Bulletin, 48(10): 1040-1044. DOI:10.1007/BF03184223 |
Luo Y, Wang H, Zhang R, et al. 2013. Comparison of rainfall characteristics and convective properties of monsoon precipitation systems over south China and the Yangtze and Huai river basin[J]. Journal of Climate, 26(1): 110-132. |
Luo Y, Wu M, Ren F, et al. 2016. Synoptic situations of extreme hourly precipitation over China[J]. Journal of Climate, 29(24): 8703-8719. DOI:10.1175/JCLI-D-16-0057.1 |
Luo Y, Zhang R, et al. 2017. The Southern China Monsoon Rainfall Experiment (SCMREX)[J]. Bulletin of the American Meteorological Society, 98(5): 999-1013. DOI:10.1175/BAMS-D-15-00235.1 |
Luo Y, Xia R, Chan J C L. 2019. Climatology, Physical Mechanisms, and Prediction of Pre-summer Rainfall over South China: Research Progress during 2008-2019[J]. Journal of the Meteorological Society of Japan, 98. |
Miao S, Chen F, Li Q, et al. 2011. Impacts of urban processes and urbanization on summer precipitation: a case study of heavy rainfall in Beijing on 1 August 2006[J]. Journal of Applied Meteorology and Climatology, 50(4): 806-825. DOI:10.1175/2010JAMC2513.1 |
Min S K, Zhang X, Zwiers F W, et al. 2011. Human contribution to more-intense precipitation extremes[J]. Nature, 470(7334): 378-381. DOI:10.1038/nature09763 |
Prein, A F, Langhans W, Fosser G, et al. 2015. A review on regional convection-permitting climate modeling: Demonstrations, prospects, and challenges[J]. Reviews of Geophysics, 53(2): 323-361. DOI:10.1002/2014RG000475 |
Qian Q, Lin Y, Luo Y, et al. 2018. Sensitivity of a Simulated Squall Line during SCMREX to Parameterization of Microphysics[J]. Journal of Geophysical Research, 123: 4197-4220. |
Ren F M, Gleason B, Easterling D. 2001. A numerical technique for partitioning cyclone tropical precipitation[J]. Journal of Tropical Meteorology, 17: 308-313. |
Ren F M, Wang Y, Wang X, et al. 2007. Estimating tropical cyclone precipitation from station observations[J]. Advances in Atmospheric Sciences, 24: 700-711. DOI:10.1007/s00376-007-0700-y |
Ren F M, Liang J, Wu G, et al. 2011. Reliability analysis of climate change of tropical cyclone activity over the western North Pacific[J]. Journal of Climate, 24(22): 5887-5898. DOI:10.1175/2011JCLI3996.1 |
Scinocca J F, McFarlane N A. 2004. The variability of modeled tropical precipitation[J]. Journal of the Atmospheric Sciences, 61(16): 1993-2015. DOI:10.1175/1520-0469(2004)061<1993:TVOMTP>2.0.CO;2 |
Seto K C, Kaufmann R K.2009.Urban growth in South China and impacts on local precipitation[C].In Proceedings of the 5th Urban Research Symposium, Marseille, France (pp.28-30)
|
Seneviratne S I, Nicholls N, Easterling D, et al.2012.Changes in climate extremes and their impacts on the natural physical environment.In: Managing the Risks of Extreme Events and Disasters to Advance Climate Change Adaptation[Field, C.B., V.Barros, T.F.Stocker, D.Qin, D.J.Dokken, K.L.Ebi, M.D.Mastrandrea, K.J.Mach, G.-K.Plattner, S.K.Allen, M.Tignor, and P.M.Midgley (eds.)].A Special Report of Working Groups I and II of the Intergovernmental Panel on Climate Change (IPCC).Cambridge University Press, Cambridge, UK, and New York, NY, USA, pp.109-230
|
Seneviratne S I, Donat M G, Pitman A J, et al. 2016. Allowable CO2 emissions based on regional and impact-related climate targets[J]. Nature, 529(7587): 477-483. DOI:10.1038/nature16542 |
Song X, Zhang J, AghaKouchak A, et al. 2014. Rapid urbanization and changes in spatiotemporal characteristics of precipitation in Beijing metropolitan area[J]. Journal of Geophysical Research: Atmospheres, 119(19): 11250-11271. DOI:10.1002/2014JD022084 |
Sun J, Zhang F. 2012. Impacts of mountain-plains solenoid on diurnal variations of rainfalls along the mei-yu front over the east China plains[J]. Monthly Weather Review, 140(2): 379-397. DOI:10.1175/MWR-D-11-00041.1 |
Trenberth K E. 1999. Conceptual framework for changes of extremes of the hydrological cycle with climate change[J]. Climatic Change, 42: 327-339. DOI:10.1023/A:1005488920935 |
Wang C C, Kirshbaum D J. 2015. Thermally forced convection over a mountainous tropical island[J]. Journal of the Atmospheric Sciences, 72(6): 2484-2506. DOI:10.1175/JAS-D-14-0325.1 |
Wa ng, H, Luo Y, Jou B. 2014. Initiation, maintenance, and properties of convection in an extreme rainfall event during SCMREX[J]. Journal of Geophysical Research: Atmospheres, 119(23): 13206-13232. DOI:10.1002/2014JD022339 |
Wang J, Feng J, Yan Z, et al. 2012. Nested high-resolution modeling of the impact of urbanization on regional climate in three vast urban agglomerations in China[J]. Journal of Geophysical Research: Atmospheres, 117: D21103. |
Wang Y, Zhou L. 2005. Observed trends in extreme precipitation events in China during 1961-2001 and the associated changes in large-scale circulation[J]. Geophysical Research Letters, 32(9). |
Wei F, Yu X, Mann M E. 2008. Probabilistic trend of anomalous summer rainfall in Beijing: Role of interdecadal variability[J]. Journal of Geophysical Research: Atmospheres, 113: D20106. DOI:10.1029/2008JD010111 |
Westra S, Alexander L V, Zwiers F W. 2013. Global increasing trends in annual maximum daily precipitation[J]. Journal of Climate, 26(11): 3904-3918. DOI:10.1175/JCLI-D-12-00502.1 |
Westra S, Fowler H J, Evans J P, et al. 2014. Future changes to the intensity and frequency of shortduration extreme rainfall[J]. Reviews of Geophysics, 52(3): 522-555. DOI:10.1002/2014RG000464 |
Wu M, Wu C C, Yen T H, et al. 2017. Synoptic Analysis of Extreme Hourly Precipitation in Taiwan during 2003-12[J]. Monthly Weather Review, 145(12): 5123-5140. DOI:10.1175/MWR-D-17-0230.1 |
Wu M, Luo Y. 2016. Mesoscale observational analysis of lifting mechanism of a warm-sector convective system producing the maximal daily precipitation in China mainland during the 2015 pre-rainy season[J]. Journal of Meteorological Research, 30(5): 719-736. DOI:10.1007/s13351-016-6089-8 |
Wu M, Luo Y, Chen F, et al. 2019. Observed Link of Extreme Hourly Precipitation Changes to Urbanization over Coastal South China[J]. Journal of Applied Meteorology and Climatology, 2019: 1799-1819. |
Xiao C, Wu P, Zhang L, et al. 2016. Robust increase in extreme summer rainfall intensity during the past four decades observed in China[J]. Scientific reports, 6: 38506. DOI:10.1038/srep38506 |
Xue M, Luo X, Zhu K, et al. 2018. The controlling role of boundary layer inertial oscillations in Meiyu frontal precipitation and its diurnal cycles over China[J]. Journal of Geophysical Research: Atmospheres, 123(10): 5090-5115. DOI:10.1029/2018JD028368 |
Yang P, Ren G, Hou W, Liu W. 2013. Spatial and diurnal characteristics of summer rainfall over Beijing Municipality based on a high-density AWS dataset[J]. International Journal of Climatology, 33(13): 2769-2780. DOI:10.1002/joc.3622 |
Yin S Q, Chen D, Xie Y. 2009. Diurnal variations of precipitation during the warm season over China[J]. International Journal of Climatology, 29(8): 1154-1170. DOI:10.1002/joc.1758 |
Yu R, Xu Y, Zhou T, et al. 2007a. Relation between rainfall duration and diurnal variation in the warm season precipitation over central eastern China[J]. Geophysical Research Letters, 34: L137. DOI:10.1029/2007GL030315 |
Yu R, Zhou T, Xiong A, et al. 2007b. Diurnal variations of summer precipitation over contiguous China[J]. Geophysical Research Letters, 34: L01704. DOI:10.1029/2006GL028129 |
Yu R, Li J, Chen H. 2009. Diurnal variation of surface wind over central eastern China[J]. Climate Dynamics, 33(7-8): 1089-1097. DOI:10.1007/s00382-008-0478-3 |
Yu R, Li J. 2012. Hourly rainfall changes in response to surface air temperature over eastern contiguous China[J]. Journal of Climate, 25(19): 6851-6861. DOI:10.1175/JCLI-D-11-00656.1 |
Yu R, Yuan W, Li J. 2013. The asymmetry of rainfall process[J]. Chinese Science Bulletin, 58(16): 1850-1856. DOI:10.1007/s11434-012-5653-6 |
Yuan W, Yu R, Zhang M, et al. 2012. Regimes of diurnal variation of summer rainfall over subtropical East Asia[J]. Journal of Climate, 25(9): 3307-3320. DOI:10.1175/JCLI-D-11-00288.1 |
Zhai P, Zhang X, Wan H, et al. 2005. Trends in total precipitation and frequency of daily precipitation extremes over China[J]. Journal of Climate, 18(7): 1096-1108. DOI:10.1175/JCLI-3318.1 |
Zhang C L, Chen F, Miao S G, et al. 2009. Impacts of urban expansion and future green planting on summer precipitation in the Beijing metropolitan area[J]. Journal of Geophysical Research, 114: D02116. DOI:10.1029/2008JD010328 |
Zhang H, Zhai P M. 2011. Temporal and spatial characteristics of extreme hourly precipitation over eastern China in the warm season[J]. Advance in Atmospheric Sciences, 28(5): 1177-1183. DOI:10.1007/s00376-011-0020-0 |
Zhang X, Zwiers F W, Li G, et al. 2017. Complexity in estimating past and future extreme short-duration rainfall[J]. Nature Geoscience, 10(4): 255-259. DOI:10.1038/ngeo2911 |
Zhang Y, Smith J A, Luo L, et al. 2014. Urbanization and rainfall variability in the Beijing metropolitan region[J]. Journal of Hydrometeorology, 15(6): 2219-2235. DOI:10.1175/JHM-D-13-0180.1 |
Zheng Y, Xue M, Li B, et al. 2016. Spatial characteristics of extreme rainfall over China with hourly through 24-hour accumulation periods based on national-level hourly rain gauge data[J]. Advance in Atmospheric Sciences, 33(11): 1218-1232. DOI:10.1007/s00376-016-6128-5 |
Zhang Y, Xue M, Zhu K, et al. 2019. What is the main cause of diurnal variation and nocturnal peak of summer precipitation in Sichuan Basin, China?The key role of boundary layer low-level jet inertial oscillations[J]. Journal of Geophysical Research: Atmospheres, 124(5): 2643-2664. DOI:10.1029/2018JD029834 |
Zhong S, Qian Y, Zhao C, et al. 2017. Urbanization-induced urban heat island and aerosol effects on climate extremes in the Yangtze River Delta region of China[J]. Atmospheric Chemistry and Physics, 17(8): 5439-5457. DOI:10.5194/acp-17-5439-2017 |
 2019, Vol. 38
