 2013, Vol. 1
The article information
- Ke-Sheng Wang
- Towards zero-defect manufacturing (ZDM)—a data mining
- Advances in Manufacturing, 2013, 1(1): 62-74
- http://dx.doi.org/10.1007/s40436-013-0010-9
-
Article history
- Received: 2012-07-10
- Accepted: 2012-10-12
- Published online: 2013-03-14


Modern manufacturing is driven by the rapid technological changes. High-value manufacturing processes are increasingly moving towards flexible,intelligent production systems. These systems involve the inter- play of novel technologies,advanced materials,in-line analysis and information comminution technology (ICT),dual working of people and automated systems,and precision engineered products and systems,etc. The productivity,performance and quality of products are affected by the conditions of machines,manufacturing processes and manufacturing decision making. In current competitive market,to achieve zero-defect products in manufacturing becomes a necessity to gain customers and market share. Most manufacturing companies,regardless of sizes,usually operate in data-rich environments. Powerful data acquisition systems are implemented in all enterprises worldwide. Accurate and complex datasets are stored in databases at various stages of manufacturing. These datasets are related to products, machines,materials,processes,inventories,sales,markets, etc. Valuable information and knowledge can be extracted from these datasets,including patterns,trends,associations, dependencies and rules.
In manufacturing companies,the quality of a product is characterised by the data of multiple geometric specifications of complex product’s shape (e.g.,in machines, automotive,white-goods and aerospace industries). However,the quality of a manufacturing process is associated with process datasets. Therefore,moving the attention from product data to process data allows the enterprise to extend quality monitoring and optimizing strategies. Data collection,transferring,analysis and rule generating allow continuously monitoring the different conditions of processes to handle the propagation of defects within processes and increase the robustness of processes. Figure 1shows how the quality of products is affected and controlled.
Traditional ‘‘Six-Sigma’’ approaches do not achieve zero-defect in manufacturing,given their limitation in deal with complex and dynamic datasets. This can be improved by controlling the process parameters in real time and by the use of intelligent processing diagnosis and prognosis, and proactive controls on processes,production systems and sub-systems integrated in the production lines/cells [1]. This includes the application of sensors for process monitoring,visualisation,diagnostics and prognostics. The integration of intelligent systems will enable the development of smart and self-optimising systems for zero-defect in manufacturing. It needs to develop new strategies for data-rich quality monitoring,control and optimization. From the hardware viewpoint,data-gathering devices are foreseen to integrate intelligence into the manufacturing process after appropriate integration. Thus,new cost-efficient tools for quality monitoring and optimization with multi- resolution,multivariate and auto-correlated data have to be developed.
 |
| Fig. 1 Quality of a product affected by the factors: equipment/machines and processes making the product |
The rest of the paper is arranged as the following. Section2describes what the definition of ZDM is. Section 3presents the general view of a data mining (DM) approach. The role of DM is explained in Sect.4. A general framework of ZDM: IFDAPS is introduced in Sect. 5.In order to show how to reach ZDM using the DM approach, some projects and a case study are described in Sect. 6. Section7makes a summary of this paper. 2 Zero-defect manufacturing (ZDM)
The word of zero-defect was introduced in the early 1960s in connection with the US Army Perishing Missile System [2, 3]. It is now a common manufacturing practice to reduce and minimize the number of defects and errors in a process and to do things right in the first time. The ultimate aim is to reduce the number of defected products to zero. However,zero-defect means zero failures during operation but not necessarily zero imperfections,blemishes,or nonconformities [4, 5]. During the 1990s,large automotive enterprises tried to cut costs by reducing their quality inspection processes and demanding their suppliers to dramatically improve the quality of their supplies. This eventually results in demands for the zero-defect standard and is then implemented all over the world.
The concept of zero-defect can be practically utilized in any manufacturing environment to improve quality and reduce cost. However,implementation of zero-defect requires the right conditions. There are two reasons to pursue zero-defect quality products and processes. The one is safety. The other is customer expectation. To achieve ZDM,new cost-efficient tools for quality monitoring and optimization with multi-resolution,multivariate and autocorrelated data have to be developed.
The general functional requirements of ZDM can be summarized by the system having the following capabilities:
(i) automatic capture,cleaning and formatting of relevant data using intelligent sensors system;
(ii) automatic signal processing,filtering and feature extraction;
(iii) data mining and knowledge discovery for diagnosis and prognosis;
(iv) provision of clear and consise defect information and advice supplied to the user;
(v) self-adaption and optimization control.
Before we describe a complete framework of ZDM,a general introduction of DM techniques is given in the following section. 3 Data mining methodologies
DM is about analyzing data and finding hidden patterns using automatic or semiautomatic means. Based on the nature of the problems in forestry industries,some DM tasks could be interesting: classification,clustering,association,regression,forecasting,sequence analysis and deviation analysis,etc. RFID has been used in forestry industries for some years and makes information data more conception,more precision and more timeliness as an advanced information gathering way. Thus the level of DM is more open. The main purpose of DM is to extract patterns from the data at hand,increase its intrinsic value and transfer the data to knowledge. 3.1 Definition
DM is an integration of data analysis and modeling technologies developed over the last twenty years. DM is often defined as the process of extracting valid,previous unknown,comprehensible information from large data bases in order to improve and optimize business decisionmaking process [6].
Many traditional reporting and query tools and statistical analysis systems use the term ‘‘Data Mining’’ in their product descriptions. It leads to the question: What is a DM and what is not? Because the ultimate objective of DM is knowledge discovery,DM methodology can be defined narrowly as ‘‘a technique to extract predictive information and knowledge from databases’’. With such a definition, however,an on-line analytical processing (OLAP) product or a statistical package could not be qualified as a DM tool. In my opinion,a DM method should unearth knowledge automatically. By this view,DM is data-driven,whereas by contrast,traditional statistical,OLAP,reporting and query tools are user-driven. It is best to define them as business intelligence (BI) tools rather than DM tools.
Using the narrowed definition of DM mentioned above, we would like to follow that DM techniques are at the core of DM process,and can have different functions (tasks) depending on the intended results of the process. In general,DM functions can be divided into two broad categories: discovery DM and predictive DM.
(i) Discovery DM
Discovery DM is applied to a range of techniques, which find patterns inside a dataset without any prior knowledge of what patterns exist. The following are examples of functions of discovery DM: i) clustering; ii) link analysis; and iii) frequency analysis,etc.
(ii) Predictive DM
Predictive DM is applied to a range of techniques that find relationships between a specific variable (called the target variable) and the other variables in your data. The following are examples of functions of predictive DM: i) classification; ii) value prediction; and iii) association rules,etc. 3.2 Techniques
A variety of techniques are available to enable the above functions. The most commonly used techniques can be categorized in the following groups: i) classical statistical methods (e.g.,linear,quadratic,and logistic discriminate analyses),ii) modern statistical techniques (e.g.,projection pursuit classification,density estimation,k-nearest neighbor,Bayes belief networks),iii) artificial neural networks (ANNs),iv) support vector machines (SVM),v) decision tree (DT) and rule induction (RI) algorithms,vi) association rules (ARs),vii) case based reasoning (CBS),viii) fuzzy logic systems (FLSs) and rough sets (RSs),ix) sequential patterns (SPs),x) genetic algorithms (GAs),xi) evolutionary programming (EP),xii) swarm intelligence (SW),and xiii) visualization methods (VMs),etc.
Each class contains numerous algorithms,for example, there are more than 100 different models of ANNs. With increasing system complexity,it is clear that the DM techniques should be used concurrently rather than separately [7]. A hybrid DM system in which several techniques with different functions can be integrated to achieve a desired result is often more effective and efficient than a single one. For example,in order to identify the attributes that are significant in a manufacturing process,clustering can be used first to segment the process database into a given predefined number of categorical classes and then classification can be used to determine to which group a new datum belongs. 3.3 Procedures
The generic DM procedure from IBM viewpoint [8] involves seven steps as the following: i) defining the business issue in a precise statement; ii) defining the data model and data requirements; iii) sourcing data from all available repositories and preparing the data (The data could be relational or in flat files,stored in a data warehouse,computed,created on-site or bought from another party. They should be selected and filtered from redundant information.); iv) evaluating the data quality; v) choosing the mining function and techniques; vi) interpreting the results and detecting new information,and vii) deploying the results and the new knowledge into your business. To understand how DM can overcome a variety of problems in manufacturing,we consider some activities in a manufacturing company. 4 DM for ZDM
From 1964 to 1969,the staff of the Yuzhgidromash plant (town of Berdyansk) had achieved serious advances through implementing the system of ZDM of pumps [9]. During this time,the pass rate of the pumps fabricated was considerable increasing. It concluded that best results in improving product quality are attained when requirements aimed at strengthening technological discipline and improving production planning and organization are adhered to rigorously and consistently. Alpernand his colleagues [10, 11, 12] attempted zero-defect product of plastic-encapsulated electronic power devices and concluded that the ambitious goal to reach the zero-defect frontier is achievable.
They evaluated the influence of the major components involved in the construction of an electronic power device in three processes: ‘‘metallization’’,‘‘molding compound’’ and ‘‘chip coating,passivation,and design’’. Finally,it can be derived that applying simply one improvement step will not lead to the desired goal of ‘‘zero-defects’’. The reason is the strong interaction between all components within an electronic power design. Therefore,they argued that the implementation of all improvement steps with their interdependence is the key for the perfect overall system chip and package.
Advanced failure analysis was applied in semiconductor industry,which provides a major contribution to the increased performance and functionality of car electronics to achieve ZDM [13]. The authors argued that the traditional failure analysis which concentrates on non-function chips was not enough to reach ZDM and thus,statistical bin alarm (SBA) and part average testing (PAT) were used to identify outliers of a given distribution. The conclusion is that the new methods can improve the quality of the product. Raina proposed a very comprehensive flow for achieving zero-defect semiconductor chips in a costeffective manner [14]. The focus was on designed-in quality achieved through harmonious deployment of defect prevention and defect detection methods during the chip design phases. Design for manufacturing (DFM) is the best known defect prevention methodology while design for test (DFT) is the best known cost-effective defect detection methodology in practice today. The author recommended applying both DFM and DFT in semiconductor manufacturing to achieve zero-defect production in a cost-effective manner. Linger introduced a cleanroom software engineering (CSE) for zero-defect software [15]. In the cleanroom process,correctness is built in by the development team through formal specification,design,and verification [16]. Team correctness verification takes the place of unit testing and debugging,and software enters system testing directly,with no execution by the development team. All errors are accounted for from first execution on,with no private debugging permitted. The cleanroom process is being successfully applied in IBM and other organizations. Experience shows that cleanroom software typically enters system testing near zerodefects and occasionally at zero defects.Westkamper and Warnecke realized ZDM in process chains by means of knowledge and artificial neural networks based learning system [17]. Firstly,the quality data collected were evaluated and represented in mathematical process models and then,logic patterns were derived by means of cluster analyses of statistical analyses, which provide information on the causes and the assessment of nonconformities. Finally,based on this and with the method of knowledge and artificial neural networks based learning system,the ZDM can become possible. New DFT/DFM/containment methodologies as well as supporting data for delivering ‘‘zero-defects’’ quality and new reliability methodologies and supporting data for guard banding power (Vmin) and speed (Fmax) against wear-out mechanisms are applied in the company of Freescale Semiconductor [18]. Freescale showed the method of how the company achieves zero-defect quality level and improves its product quality continuously.
With the development of modern manufacturing technology,equipment has become more and more complex and integrated. Such equipment in manufacturing is very dependent upon the trouble-free operation of all its parts [19]. When a fault occurs,it is critical to identify the reasons and causes as rapidly as possible and to take appropriate maintenance action. Typically,when a system goes down,only a small fraction of the downtime is spent repairing the machine that causes the fault. Up to 80 % of it is spent locating the source of the fault [20]. For this reason,there is great interest to study the corresponding intelligent diagnostic techniques and system for widespread applications in modern manufacturing systems and processes [21].
In order to prevent a catastrophic event,many researchers are interested in developing intelligent diagnostic and prognostic systems which integrated sensors,and signal processing units with data/information analyzing models to detect faults and predict them as early as possible. Piewak [22] presented a systematic approach to monitor and diagnose of machine tools and manufacturing processes. Fast Fourier transformation (FFT) and feature extraction were used in the study. Monostori [23] employed ANN with the multi-sensor integration approach in monitoring machining processes. He pointed out that ANN techniques were the most viable solution for the lower level of intelligent,hierarchical control and monitoring systems. Shinno and Hashizume [24] proposed a new multi-functional approach in process monitoring based on multi-phenomenon sensing. The sensor developed can detect both thermal and mechanical behaviors during a machining process.
Computational intelligence (CI) and DM including ANN,fuzzy logic system (FLS),GA hybrid CI systems,SI, DT and AR have been applied in the research of fault diagnosis and prognosis of mechanical systems at Knowledge Discovery Laboratory,Norwegian University of Science and Technology since 1993,especially a centrifugal pump system was utilized as a case to show how the CI and DT methods functions [25, 26]. Lee et al. [27] developed an intelligent prognostics and e-maintenance system named ‘‘watchdog agent’’ where statistical matching,performance signature and SVM were used.
The keys to achieve ZDM are monitoring of the states of the manufacturing equipment and processes and decisionmaking for adopting suitable maintenance policies to ensure the products manufactured non-failures. Some technologies containing data acquisition,signal processing, fault diagnosis,fault prognosis and maintenance decision should be integrated into one system.
There are several challenges in enabling the seamless integration of data/information (condition monitoring) and knowledge (decision making and feedback controlling) for ZDM. The first challenge is how to collect all necessary and huge amount of datasets from equipment and processes. In addition,many kinds of data which involved in the system should be carefully selected,classified and optimized because of the complexity of systems and processes. Mechanical and structural sensor systems have been studied extensively,and a large number of such devices are currently in use to monitor system performance for operational state assessment and tracking of fault indicators. A number of mechanical quantities (position,speed,acceleration,torque,strain,temperature,etc.) are commonly employed in dynamic systems. Most of devices for measuring these quantities are available commercially,and their operations have been amply described in textbooks and publications.
The second challenge is signal processing which involves two steps generally. The first step usually is called signal pre-processing and is intended to enhance the signal characteristics that eventually may facilitate the efficient extraction of useful information,that is,the indicators of the condition of a failing component or subsystem. The methods in this category include filtering,amplification, data compression,data validation,and de-noising and generally aim at improving the signal-to-noise ratio. The second step aims to extract the features or condition indicators from the pre-processed data that are characteristic of an incipient failure or fault [28].
The third challenge is knowledge discovery and decision making. The fault diagnosis and failure prognosis are crucial components in the whole integrated system. Zhao et al. [29] implemented DM in fault diagnosis and they concluded that DM can be effectively applied to diagnosis of rotating machinery by giving useful rules to interpret the data. Lian et al. [30] diagnosed dimensional variation of sheet metal assembly applying DM and knowledge discovery techniques. The practical implement proved that it was effective and efficient. Wang et al. [31] made condition diagnosis using static feature and information divergence and finally the fault can be effectively identified. Ray and Tangirala [32] presented a physics-based method for detecting cracks in metallic materials and predicting their remaining life. Their models used extended Kalman filters and stochastic differential equations. They validate their models using induced faults from a laboratory setting. Schwabacher [33] has made a survey of artificial intelligence (AI) for failure prognosis and concluded that for realistic systems ‘‘fully implementing prognosis is very difficult’’. Several researchers have stated their intention to do prognostics,and have described the progress they have made in fault detection,but have left estimation of useful life remaining to future work. Much research has been done in the area of structural prognostics using data from vibration sensors,but we are not aware of any fielded systems in that area. There has been much more progress made in fault detection and diagnosis than in prognosis. New algorithms for fault diagnosis,failure prognosis and decision making are needed to be developed and implemented. Statistic matching,data mining and knowledge discovery algorithms could be useful for reaching zerodefect manufacturing in the future.
CI [34] or soft computer is a rapidly growing area of fundamental and applied research in advanced information processing technologies. Some main CI methods can be used for maintenance optimization (or maintenance scheduling). SI [35],such as ant colony optimization (ACO) [36, 37]and particle swarm optimization (PSO) [38, 39] are proposed and the two methods are employed to manage the vast decision space. There are many literatures implementing GA and other traditional methods in maintenance optimization. The application of ACO and PSO to predictive maintenance optimization is still a challenge. 5 Framework of a ZDM: IFDAPS
Most of methodologies mentioned above are concentrated on the quality of finished product and the product condition in the manufacturing process. However,with these methods,it may not achieve ZDM. If there is a failure in the manufacturing process,some defects of the product might be generated and the cost may increase significantly. Thus, the condition of the equipment should be considered and the degradation of performance should be predicted.
A frame work called intelligent fault diagnosis and prognosis systems (IFDAPS) for manufacturing systems and process has been developed in Knowledge Discovery Laboratory at NTNU [40]. Figure 2 shows the general structure of IFDAPS which presents from the equipment and processes,sensors,signal processing,fault diagnosis and failure prognosis,operation/plan optimization and feedback control. The principal functions performed by IFDAPS are the following:
(i) Continuous collection of data coming from different sensors includes the information of status of equipment,processes and products.
(ii) Continuous processing of the data collected from sensors in order to get useful information to evaluate on-line the condition of the equipment and processes.
(iii) According to the useful information mentioned above,the condition or the fault can be identified. If there are any degradation becoming unaccepted, the system can tell operators and managers about which components of machines or which parameters in processes to take actions.
(iv) According to the condition of the component or machine,the remaining useful life or possible faults can be predicted.
(v) According to the results of diagnosis and prognosis, operation and plan can be optimized by some intelligent optimization algorithm.
(vi) The performance indicators and results can be used for self-adjustment of the control system to correct or compensate the faults ensuring zero-defect manufacturing.
CI and DM have been applied to optimize the solution. It can monitor plant floor assets,link the production and maintenance operations systems,acquire data,collect feedback from remote customer site,and integrate it into upper level enterprise applications,discovery and generate manufacturing knowledge. In addition,it can monitor the state of manufacturing process and predict the condition of the equipment.
IFDAPS using CI and DM techniques can make better manufacturing decisions to prevent occurrence and development of failures effectively,ensure the safety of equipment and personnel,and reduce economic lost caused by failure. It can use fault diagnosis,performance assessment of level of degrading,fault prognosis models to reach ZDM performance and improve productivity for a company. IFDAPS concept is a key to achieve ZDM.
The main benefits of ANNs are fault tolerance,generalization and adaptability. But the limitation is the lack of explanation function. GA is a robust,general-purpose search procedure; it can quickly explore huge search spaces and find those regions that have above-average fitness. However,when it comes to finding global optima,the convergence time will be very long. Fuzzy logic systems can be applied where accurate mathematical models are unavailable or difficult to be established,but empirical knowledge about the problem is needed to develop accuracy model of the subsystem.
Furthermore,the current methods are generally focused on solving the failure diagnosis problem and several prediction algorithms developed have been demonstrated in the laboratory,rather than real industrial validations. Therefore, intelligent fault diagnosis and prognosis system based on DM and industrial validation needs to be researched further. There are several projects that have been running in the Labortory. Next section presents three important ongoing projects: IFaCOM,WINDSENSE and 3D IQIS. 6 Ongoing projects related to ZDM using DM
To build a ZDM system,a systematic approach for monitoring and data processing of dimensional fluctuations is needed. The ZDM system should have a capability to diagnose and predict the behavior and performance of manufacturing equipment and processes automatically,selfadaptively and flexibly. The new advanced information processing techniques,such as computational intelligence, data mining,knowledge discovery,and swarm intelligence should be applied for developing the IFDAPS system. 6.1 IFaCOM
Based on the concept IFDAPS,Department of Production and Quality Engineering,NTNU,as an EU project coordinator,has launched a ZDM practice: IFaCOM (Intelligent Fault Correction and self Optimising Manufacturing systems,FoF NMP-285489). The vision of IFaCOM is to achieve zero-defect manufacturing for different manufacturing branches,with emphasis on production of high value parts,on large variety custom design manufacturing and high performance products.
A concept of IFaCOM is being developed (see Fig. 2), which can become a general framework for diagnosing, prognosing and controlling faults in manufacturing equipment and processes for different industrial branches. This framework proposes to use closed control loop to all realtime vital parameters related to equipment,products and processes. In today’s manufacturing it is still the case that many vital parameters are controlled indirectly,thus creating a larger variability in the output than acceptable within the zero-defect paradigm. The project will create a basic understanding of the method of direct closed loop control and apply it to manufacturing process in order to eliminate the propagation of defects along the process stages.
 |
| Fig. 2 Framework of zero-defect manufacturing system: IFDAPS |
The principles can be extended to processes with highly varied input,which causes high defect rates in manufacturing. This involves both the development of suitable measurement and monitoring techniques.
The control models must be upgraded in accordance with the increased insight in the operations,which can be obtained by the analysis of datasets available from multiple sensors. Furthermore,intelligent simulation-based optimization methods will be developed to extend the direct control over the entire process chain. 6.2 Windsense
Department of Production and Quality Engineering, NTNU,also use the concept of IFDAPS to participate a national research project called WINDSENSE-Add-on instrumentation system for wind turbines,which is supported by Norwegian Research Council (NRC). WINDSENSE is a collaboration project between some of the strongest wind power and instrumentation companies within Wind Cluster Mid-Norway,mainly located in the Trøndelag region of Norway. The project,which amounts to 22 MillionNOK,has been initiated through collaboration with the Norwegian Centers of Expertise Instrumentation (NCEI). It has been awarded a total of 10 MillionNOK from the Norwegian Research Council’s RENERGI programmer. The aim of WINDSENSE project is to develop a new and flexible instrumentation system for wind turbines, which makes wind turbines more effective by reducing unplanned shout downs,thus achieving high reliability of the powerplant. It also makes it possible to temporarily run the turbines at a lower capacity in anticipation of required maintenance.
A key challenge for the future is the adaptation of equipment and methods for maintenance from the maritime and oil and gas industry,for use on offshore wind turbines. Cost-effective operation of offshore wind turbines will require new technology that enables a greater degree of remote control and remote monitoring of the turbines. It also requires durable and reliable instruments to monitor the operation and components in harsh environments at sea. This system will primarily be an instrument for monitoring the technical condition of the wind turbine and the life cycle of the components used. It will make it possible to more accurately predict when the equipment must be replaced. Today,such assessments are usually done by operators using handheld inspection equipment.
Future maintenance,modification and repair of wind turbines will be based on measured technical condition of systems and components. There is a need to further develop the sensing and analytical capabilities to better performance in detection of faults and anomalies. There is a substantial R&D challenge in developing sensor technologies for increased on-line monitoring and processing capabilities. Another challenge is how to use intelligent DM methodology to make a better decision for diagnosis and prognosis of wind turbines based on massive datasets from the fields.
The project will be carried out according to accepted methods for R&D projects with a strong industrial anchoring. The main steps are: GAP analysis,requirement specification,evaluation,detailed specifications,implementation,laboratory testing,field testing,refinement and verification of methods,and dissemination. Industrialisation and marketing of the products will be performed by the industry partners subsequent to the R&D project.
The add-on instrumentation system in this project will be tested both in the laboratory and on real turbines. Possible test sites are the Statoil turbines: Hywind Demo SWP 2.3 MW,Havøygavlen SWP 3.0 MW and two turbines SWP 3.6 MW at Sheringham Shoal. In addition,one of NTE’s turbines at Hundhammerfjellet,and FLEXWT (part of the NOWERI research infrastructure project funded by the Research Council of Norway) are also relevant for testing. The various components of the system will also be tested at SINTEF Energy Research’s renewal energy laboratory,as well as at each participating company’s test infrastructure where relevant. Simulations and model testing are also possible approaches. 6.3 Pilot study: 3D IQIS
A pilot study for ZDM is 3D intelligent quality inspection system (3D IQIS). Product quality inspections are important to protect a company’s brand and reputation by minimizing defective merchandise. Automated,smart quality inspection is developed to meet the need for accurate,fast and objective quality inspection. Automated vision inspection (AVI) is the automation of quality control of manufactured products,normally achieved using a camera system with a computer. In quality inspection,the AVI system is not only to be required to recognize the objects, but also to qualify them.
With the advantages of non-contact and cost-effective, vision technique is commonly used to obtain the information such as the geometry dimension of parts in production line,which indicates the quality of the product [41]. Traditional 2D vision is not applicable to inspect the object with free surface such as the turbine blade. 3D vision provides an alternative for these problems with more flexibility while little cost added,including various technologies [42],which is a powerful tool in industrial quality inspection [43],welding [44],lens quality inspection [45], thin-walled components inspection [46] and suitable for sorts of working conditions [47, 48, 49].
Data mining is applied to accomplish the inspection on the basis of vision based data in many areas such as medical [50] and quality inspection [51]. In this paper, three data mining methods are tested,including ANN,DT and SVM. 6.3.1 Quality inspection problem
To verify the proposed 3D vision based quality inspection, LEGO® wheel assembly detection is taken as the example in this paper. The purpose is to check the quality of wheel assembly. A wheel is constituted of 2 components,the wheel and the tire. Five errors occur during the assembly process according to the relative position of the wheel and tire as shown in Fig. 3: i) Wheel assembly without errors; ii) Tire is compressed; iii) There exists an offset for one side; vi) Wheel is detached from the tire; v) Wheel is tilted.
 |
| Fig. 3 Classification of the wheel assembly error |
Traditional 2D vision is not applicable to distinguish some cases due to the similarity of pictures,as shown in Fig. 4. It is noticed that there is no much difference for the two wheels from the top view in the image; however,the height is different if seen from the side view. Structured light system (SLS) is effective to acquire 3D point coordinates of the inspected part,such as the real height value of the parts. The section views show the inner layout of each class in Fig. 5.
 |
| Fig. 4 Inspection difficulties from different point of view |
 |
| Fig. 5 Inner layout of each class from the section view |
SLS acquired the point cloud by projecting specific pattern with a project or onto the measured object and capturing the images with a camera. The point cloud of object surface can be acquired with the images analysis [52]. Figure 6 shows the working process of a typical SLS,which can be divided into 4 steps.
 |
| Fig. 6 Working process of a typical SLS |
Step 1 is the pattern projection. A single light pattern or pattern series are projected onto the scene following some specific coding rules.
Step 2 is the image recording. The captured images are stored in sequence if pattern series are used. The scene is captured previously as references without the presence of the object.
Step 3 is the phase map generating. Recorded images are analyzed according to the pattern encoding rules. The wrapped phase maps are obtained,and to be unwrapped to obtain a continuous phase distribution.
Step 4 is the transformation from phase to height. The height value of each image pixel is derived from its phase calibration or phase-height mapping.
In this case,the gray code and phase shifting (GCPS) technique is used. The pattern series consists of nGray Code patterns and 4 phase shifting patterns,wherenis the bit number of the Gray Code. Each Gray Code pattern is generated according to the Gray Code respectively constituted of 2 n stripes. If given n=4,the Gray Code pattern series are generated as shown in Table 1.

A typical phase shifting method is 4-step phase shifting algorithm,which takes a total number of 4 projection patterns constructed as gray scale bitmaps,with the intensity distributions respectively following the rule defined by equation
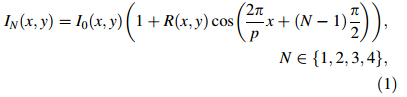
In the phase shifting procedure,a sequence of images is projected onto the inspected object,one ‘‘original’’ sinusoidal fringe pattern with N=1 and three phase-shifted versions of the ‘‘original’’ with step ofp/2. If set the phase of point (x,y)tou(x,y),where u(x,y)=2px/p,considering (1),


 |
| Fig. 7 3D structured light system |
 |
| Fig. 8 Acquired point cloud of the wheel part |
Geometry features are extracted as the input attributes on the basis of the 3D points and regression analysis. Regarding the lower reflectivity of tire compared with the wheel,to get a cleaner point cloud,the tire part is disregarded by lowering the contrast value. Thus,only the wheel part is kept for the further analysis. 6 line profiles are extracted from the point cloud of the wheel part for feature extraction in the next step,with 3 horizontals and 3 verticals. Only the end sections of each line profile are kept to do the analysis (see Fig. 9).
 |
| Fig. 9 Line profile of the wheel part |
As is shown in Fig. 10,two sections of profile are used to define the attributes of the wheel. Only the beginning and ending sections of the profile are kept while other sections are ignored. It is possible to use statistics to estimate the regression line of the values corresponding to the profile section [53]. Taking into account the slope of the regression line,it is possible to estimate the height and the pose of the wheel part.
 |
| Fig. 10 Attributes corresponding to the extracted profile |
The least squares linear regression is used to acquire the regression line. With the numerical data of a profile and the regression line corresponding to a wheel,5 values are obtained,which are respectivelyx1slope of the regression line,x2bias of the regression line,x3mean height value of points in the beginning section,x4 mean height value of points in the ending section,x5width between the starting point and the ending point.
With all the values extracted from a line profile and the regression line,a data vector is constructed for each of the six profiles of the wheel:
X={x1,x2,...,x5}
Thus,a vectorXS is used to denote a wheel where XS={X1 ,X2 ,…,X6} as the inputs of data mining approaches. 6.3.4 Data mining approaches for quality inspection
Data mining methods are often used to ascertain the product quality. In this paper,three typical data mining approaches are used: ANN,DT and SVM.
(i) DT
A decision tree is a flowchart-like tree structure,where each internal node denotes a test on an attribute,each branch represents an outcome of the test,and each leaf node holds a class label. The construction of DT classifiers does not require any domain knowledge or parameter setting,and therefore is appropriate for exploratory knowledge discovery. C4.5 is a classic algorithm for DT induction. In this case,the succedent algorithm C5.0 is implemented in IBM SPSS Modeler® to accomplish the DT induction and test.
(ii) ANN
As another effective data mining approach,an ANN consists of layers and neurons on each of them. Parameters are adjustable in an ANN such as the number of the hidden layers and neurons,the transfer functions between layers and the training method etc. In the case study,the structure of ANN is set to be 1 hidden layer of 20 nodes. The network training function is set to be transact,which updates weight and bias values according to the scaled conjugate gradient method.
(iii) SVM
The standard SVM is designed for binary classification. SVM training algorithms are available to build a model that assigns examples into corresponding category. New examples are then predicted based on the constructed model [54]. For multi-classification problem,a commonly used approach is to constructKseparate SVMs [55],where Kequals the number of classes. The polynomial kernel type is used in the paper.
(iv) Cross validation
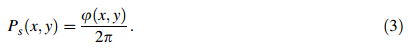
Tenfold cross validation is used to evaluate the performance of three different modelling approaches such as DT, ANN and SVM. The acquired examples are randomly partitioned into 10 subgroups. The validation process is repeated 10 times,with each of the 10 subgroups used as the test data while other 9 subgroups as the training data alternately. 1,000 samples are used in the case study. Thus in each validation,900 samples are used as the training sets while 100 samples as the test sets. Regarding each validation,6 measures are obtained for each classifier on the basis of 4 outcomes: true positive (TP),true negative (TN), false positive (FP) and false negative (FN),and the 6 measures are defined as following:
In the process of quality inspection,the vision system is necessary to be smart to accomplish the inspection,that is, it should be self-adaptive,more flexible and less human interferential. The integration of DM techniques and a vision system can improve the inspection performance and efficiency. SLS provides more possibilities to the quality inspection task with height information of inspected objects. Regarding the supposed wheel assembly problem, a 2D vision system is not applicable due to the similarity of the objects with different errors. However,SLS is able to solve this problem effectively.
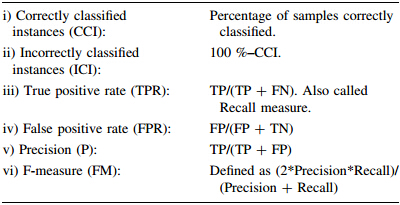
By acquiring 3D point cloud of the wheel,the geometrical attributes of the wheel are extracted from the section profiles and the regression analysis as the representation of the wheel assembly quality. Without loss of generality,tenfold cross validation and 6 measures are applied to evaluate three classifiers of ANN,DT and SVM respectively. The test result shows that the DM methods are applicable to the supposed classification problem. Especially,the SVM classifier has the best performance, such as the CCI value of 95.8 % and FPR value of 0.011, which is the most suitable approach to this case. The combination of SLS and feature extraction on the basis of the section profile is applicable for the objects with similar geometric specifics with the wheel,especially for the symmetrical inspected objects. 7 Conclusions
This paper presents the new concept of ZDM,which is the next generation of manufacturing systems. The general framework of ZDM developed describes the basic components of a ZDM system,which include intelligent sensor and data collection,signal processing and feature extraction,DM for diagnosis and prognosis,decision-making and feedback control. The most important component is DM. The main role of DM in ZDM is to discover the useful information and knowledge from a massive amount of manufacturing datasets measured. Then,models,rules and patters extracted by DM techniques are used for fault diagnosis and failure prognosis. These information and knowledge are used to help managers to make better and right decisions.
Three ongoing projects: IFaCOM,WINDSENSE and 3D IQIS have shown the interests of ZDM and demonstrated how to use DM technology to develop ZDM systems.
| 1. | Arumugam V, Antony J, Douglas A (2012) Observation: a leantool for improving the effectiveness of lean six sigma. TQM J24(3):275–287 |
| 2. | Halpin JF (1996) Zero defects: a new dimension in qualityassurance. McGraw-Hill, New York |
| 3. | Crosby PB (1979) Quality is free: the art of making qualifycertain. McGraw Hill, New York |
| 4. | Calvin TW (1983) Quality control techniques for ‘‘zero defects’’.IEEE Trans Compon Hybrids Manuf Technol 6:323–328 |
| 5. | Calvin TW (1983) Quality control techniques for ‘‘ZeroDefects’’. IEEE Trans Compon Hybrids Manuf Technol |
| 286. | Wang K (2007) Applying data mining to manufacturing: thenature and implications. J Intell Manuf 18(4):487–495 |
| 7 | Wang K (2005) Applied computational intelligence in intelligentmanufactruing systems. Advanced Knowledge International,Adelaide |
| 8 | Baragoin C, Andersen CM, Bayerl S et al (2001) Mining yourown business in health care using DB2 intelligent miner for data.IBM Redbook, California |
| 9 | Marishin AD, Stasenko IK (1970) Operating experience of pumpmanufacturing plants using the zero-defect system. Khimieheskoei Neftyanoe Mashinostroenie: 44–46 |
| 10 | Alpern P, Nelle P, Barti E et al (2009) On the way to zero defectof plastic-encapsulated electronic power devices—Part I: metallization. Device Mater Reliab 9:269–278 |
| 11 | Alpern P, Nelle P, Barti E et al (2009) On the way to zero defectof plastic-encapsulated electronic power devices—Part II:molding compound. Device Mater Reliab 9:279–287 |
| 12 | Alpern P, Nelle P, Barti E et al (2009) On the way to zero defectof plastic-encapsulated electronic power devices—Part III: chipcoating, passivation, and design. Device Mater Reliab 9:288–295 |
| 13 | Ga¨bler U, O ¨sterreicher I, Bosk P et al (2007) Zero defect manufacturing as a challenge for advanced failure analysis. In:Advanced semiconductor manufacturing conference, Stresa,Italy, 11–12 June 2007 |
| 14 | Raina R (2008) Achieving zero-defects for automotive applications. IEEE international test conference, Santa Clara, USA,28–30 Oct. 2008 |
| 15 | Linger RC (1993) Cleanroom software engineering for zerodefect software. In: The 15th international conference on software engineering, Baltimore, USA, 17–21 May 1993 |
| 16 | Mills HD, Dyer M, Linger RC (1987) Cleanroom softwareengineering. IEEE Softw 4(5):19–25 |
| 17 | Westkamper E, Warnecke HJ (1994) Zero-defect manufacturingby means of a learning supervision of process chains. Ann CIRP43(1):406–408 |
| 18 | Dakshinamoorthy S (2008) Zero defects quality and reliabilitychallenges for growing markets. In: Integrated reliability workshop final report, South Lake Tahoe, USA, 12–16 Oct. 2008 |
| 19 | Hu W, Starr AG, Zhou Z et al (2000) A systematic approach tointegrated fault diagnosis of flexible manufacturing systems. Int JMach Tools Manuf 40:1560–1587 |
| 20 | Kegg RL (1984) On-line machine and process diagnostics.Annals of the CIRP 32(2):469–573 |
| 21 | Zhou ZD, Chen YP, Fuh JH et al (2000) Integrated conditionmonitoring and fault diagnosis for modern manufacturing system.Ann CIRP 49(1):387–390 |
| 22 | Piewak S (1991) A predictive monitoring and diagnosis systemfor manufacturing. Ann CIRP 40(1):401–404 |
| 23 | Monostori L (1993) A step towards intelligent manufacturing:modeling and monitoring of manufacturing processes with artificial neural network. Ann CIRP 42(1):485–488 |
| 24 | Shinno H, Hashizume H (1997) In-process monitoring method formachining environment based on simultaneous multi-phenomenasensing. Ann CIRP 46(1):53–56 |
| 25 | Wang K (2003) Intelligent condition monitoring and diagnosissystems: a computational intelligence approach. IOS Press, Amsterdam |
| 26 | Wang K (2002) Intelligent condition monitoring and diagnosissystems. IOS Press, Amsterdam |
| 27 | Lee J, Ni J, Djurdjanovic D et al (2006) Intelligent prognosticstools and e-maintenance. Comput Ind 57:476–489 |
| 28 | Allocca A, Stuart A (1984) Transducers: theory and applications.Prentice-Hall. Englewood Cliff, NJ |
| 29 | Zhao G, Jiang D, Li K et al (2005) Data mining for fault diagnosis and machine learning. Key Eng Mater 293(294):175–182 |
| 30 | Lian J, Lai X, Lin Z et al (2002) Application of data mining andprocess knowledge discovery in sheet metal assembly dimensional variation diagnosis. J Mater Process Technol 129:315–320 |
| 31 | Wang H, Chen P, Wang S (2009) Condition diagnosis methodbased on statistic features and information divergence. In: 2009sixth international conference on fuzzy systems and knowledgediscovery, Tianjin, China, 14–16 August 2009 |
| 32 | Ray A, Tangirala S (1994) Stochastic modeling of fatigue crackdynamics for on-line failure prognostics. IEEE Trans ControlSyst Technol 4(4):443–451 |
| 33 | Schwabacher MA (2005) A survey of data-driven prognostics.American Institute of Aeronautics and Astronautics Report,Virginia |
| 34 | Wang K (2001) Computational intelligent in agile manufacturingengineering. In: Gunasekaran A (ed) Agile manufacturing: the 21stcentury competitive strategy. Elsevier, New York, pp 297–315 |
| 35 | Amin AMA, Korfally MI, Sayed AA et al (2007) Swarm intelligence-based controller of two-asymmetric windings inductionmotor. In: Processings of IEEE international electric machinesand drives conference, Antalya, Turkey, 3–5 May 2007 |
| 36 | Zomaya AY (2006) Handbook of natural-inspired and innovativecomputing: integrating classical models with emerging technologies. Springer Science?Business Media, Inc., New York |
| 37 | Bontoux B, Feillet D (2008) Ant colony optimization for thetraveling purchaser problem. Comput Oper Res 35:628–637 |
| 38 | Saha S, Pathak SS (2007) A novel swarm intelligence basedrouting scheme for MANET using weighted pheromone paths. In:IEEE military communications conference MILCOM militarycommunications conference, Orlando |
| 39 | Padma S, Bhuvaneswari R, Subramanian S (2007) Application ofsoft computing techniques to induction motor design. COMPELInt J Comp Mathematics Elec Electron Eng 26(5):1324–1345 |
| 40 | Wang K, Wang Y (2012) Data mining for zero–defect manufacturing. Tpir Academic Press, London |
| 41 | Connolly C (2009) Machine vision advances and applications.Assem Autom 29(2):106–111 |
| 42 | Barbero BR, Ureta ES (2011) Comparative study of differentdigitization techniques and their accuracy. Comput Aided Des43(2):188–206 |
| 43 | Xu J, Xi N, Zhang C et al (2011) Real-time 3D shape inspectionsystem of automotive parts based on structured light pattern. OptLaser Technol 43(1):1–8 |
| 44 | Huang W, Kovacevic R (2011) A laser-based vision system forweld quality inspection. Sensors 11(1):506–521 |
| 45 | Lin CS, Lin CH, Chen DC et al (2011) Measurement method ofthree-dimensional profiles of small lens with gratings projectionand a flexible compensation system. Expert Syst Appl 38(5):6232–6238 |
| 46 | Gentilini I, Shimada K (2011) Predicting and evaluating the postassembly shape of thin-walled components via 3D laser digitization and FEA simulation of the assembly process. ComputAided Des 43(3):316–328 |
| 47 | Bruno F, Bianco G, Muzzupappa M et al (2011) Experimentationof structured light and stereo vision for underwater 3D reconstruction. ISPRS J Photogrammet Remote Sens 66(4):508–518 |
| 48 | Wang K, Yu Q (2011) 3D computer vision using structured lightsystems: principles, systems and applications. SINTEFF Report,Trondheim |
| 49 | Wang K, Yu Q (2011) Accurate 3D object measurement andinspection using structured light systems. In: The 12th international conference on computer systems and technologies, Wien,Austria, 16–17 June 2011 |
| 50 | Lee MY, Yang CS (2010) Entropy-based feature extraction anddecision tree induction for breast cancer diagnosis with standardized thermograph images. Comput Methods Programs Biomed 100(3):269–282 |
| 51 | Ravikumar S, Ramachandran KI, Sugumaran V (2011) Machinelearning approach for automated visual inspection of machinecomponents. Expert Syst Appl 38(4):3260–3266 |
| 52 | Skotheim Ø, Couweleers F (2004) Structured light projection foraccurate 3D shape determination. ICEM12-12th internationalconference on experimental mechanics, Bari, Italy, 29 August–2September 2004 |
| 53 | Tellaeche A, Arana R, Ibarguren A et al (2010) Automatic qualityinspection of percussion cap mass production by means of 3Dmachine vision and machine learning techniques. Hybrid artificialintelligence systems, San Sebastian |
| 54 | Cortes C, Vapnik V (1995) Support-vector networks. Mach Learn20(3):273–297 |
| 55 | Bishop CM (2006) Pattern recognition and machine learning.Springer, New York |