The article information
- Wen-jing Zhou, Ke-qin Peng, Ying-jie Yu
- Surface roughness measurement and analysis of mechanical parts based on digital holography
- Advances in Manufacturing, 2016, 4(3): 217-224.
- http://dx.doi.org/10.1007/s40436-016-0146-5
-
Article history
- Received: Dec. 21, 2015
- Accepted: Jul. 1, 2016
- Published online: Aug. 4, 2016
Roughness is an important parameter to characterize the surface feature of mechanical parts. It is closely related with the properties of anti-wearing, the anti-corrosive, and the stability for fitting with other mechanical parts [1]. As ultra-precision engineering surfaces are becoming more important, so are surface quality requirements [2]. Surface 4 August 2016 roughness need be strictly controlled in mechanical pro-cessing, and the analysis and measurement of roughness has assumed great significance. Stylus is a representative traditional measurement method with high accuracy and resolution [3]. But the probe with the large size diameter (2-5 im) will result in a low lateral resolution and damage the surface, and it is also unable to achieve rapid mea-surement. Thus the non-contact measurement method with the advantages of non-destructive, full field and real time has been focused for roughness measurement.
There are some optical methods for roughness mea-surement, such as speckle correlation method, moire, fringe projection and interferometry [4-8]. Moire fringe is helpful to acquire quantitative information but it is time-consum-ing to extract complex data from patterns [9]. The fringe projection method is to project grating on the object and capture the images from different directions [10]. Phase-shifting interferometry and white-light interferometry [11] are typical interferometry methods. The reference [12] proposed a method based on phase-shifting interferometry. The method with high sensitivity can realize a fast, precise measurement. The Wyko NT Profilometers and the Ray-Dex Sensor [13] are typical commercial products based on white-light interferometry. The former is used in outer surface measurement and the latter is used in inner surface measurement. Generally, the interferometry can work with high precision, high sensitivity and fast measurement, and it has also some drawbacks such as the complex setup.
Digital holography is an imaging and measurement technology based on optical interference and diffraction. Both the intensity and the phase of object are obtained simultaneously from one hologram. It has been widely used in different fields, for example, biological cells [14], micro-mechanical components (materials in MEMS and NEMS) [15], temperature measurement [16, 17], particle size [18] and fluid flow velocity detection. In particular, digital holography has been applied to measure the surface rough-ness in Refs. [19-21]. In these works, a micro objective (MO) is always used in Mach-Zehnder interference system or Michelson interference system in order to magnify the object wave. Hence two problems may be produced. One is that the micro objectives will introduce the quadratic phase error which is difficult to be compensated. The other one is that the micro objectives also will magnify the depth of the object wave while magnifying the lateral size of the object wave. Actually, two problems will produce the reconstructed phase error to make the detected height greater or less than the actual height value. Hence in the paper, we built a digital off-axis holographic system for the reflective sample on the basis of the Michelson interference theory. It has no the micro objectives to avoid the quadratic phase error. The height reconstruction error was calibrated by the quartz step height standard (VLSI-SHS-880QC).
2 Principle of calculating surface roughness with digital holographyThe intensity distribution of hologram can be expressed
where I/(ξ, η), O(ξ, η), R(ξ, η)are the intensity distribution of the hologram, object wave and reference wave on the hologram plane (ξ, η), respectively. The symbol * repre-sents the conjugate function.
The convolution method is used to reconstruct the hologram and three times Fourier transform need be done. The numerical reconstruction process is [22]
where F is the Fourier transform operator; O' (x', y') is the reconstructed object wave on image plane (x', y'); R(ξ, η) is the reference wave; g(x', y', ξ, η) is the transfer function [22].
If the reference wave is a plane, then let R(ξ, η) = 1. So on the image plane, the reconstructed intensity /(x0, y0) and phase ψ(x', y') are as following:
Actually on the machined surfaces of mechanical compo-nents, roughness is defined to describe the level of ups and downs. Thus, the height is an important parameter to character the roughness. Generally the arithmetic average height value of the profile [23]——Ra is one of the evaluation parameters.Ra is defined as the arithmetic mean value of the absolute distance between all points on the contour line along measured direction (e.g., h axis) and the datum line of the sampling length. Assume that the contour line is expressed as h = h(x), then mathematical expression of Ra is calculated as following [22]
whereL is a specified sampling length to cover the mea-sured surface roughness and it should be selected according to the given roughness reference value by GB standard [23];h is the height distribution of the datum line (arith-metic average line); h(x) is the height distribution of every point in a sampling length area. SoRa represents the arithmetic mean of deviation absolute value between each point within sampling length and datum line. The height distribution of the tested object can be converted from the reconstructed phase ψ(x) of a hologram as
where λ is the wavelength of the laser.
Thus we can calculate Ra by using the following formula
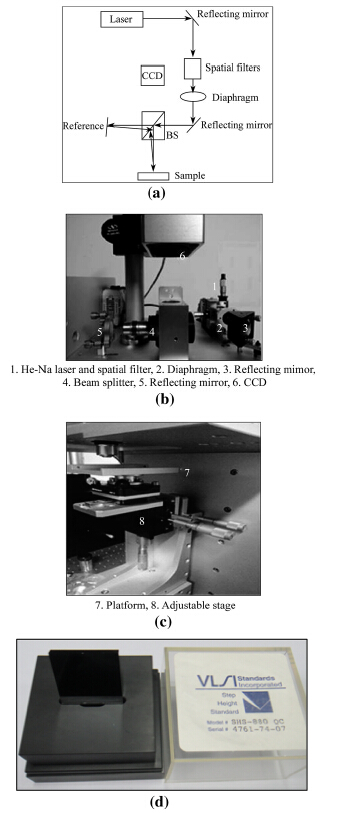
3 The off-axis hologram recording setup for the reflective samplesAn off-axis digital hologram recording system is built based on the principle of Michelson interference. Its sketch map is shown in Fig. 1a. The light source from the He-Ne laser passes through the spatial filter to become a plane wave. It is separated into two beams by the beam splitter. One of them illuminates the sample vertically and then is reflected from the sample surface to the CCD plane, which being called as the object wave. The other beam through the beam splitter is taken as the reference wave. It will return to the beam splitter again after being reflected from the reference mirror. Then it interferes with the object wave on the plane of the CCD with a small angle. Thus an off-axis hologram is captured by CCD. The wavelength of the laser is 633 nm. The recorded pixels of the CCD are 1 200 x 1 600 and its pixel size is 4.4μm. Because of the convolution method used in reconstruction, the spatial resolution of the reconstructed image is the same with one of CCD. Figures 1b, c are the internal construction and the adjustable stage, respectively.
|
| Fig. 1 Digital off-axis hologram recording setup based on Michelson interference and the sample for the height calibration (a Sketch map of the digital off-axis hologram recording setup based on Michelson interference, b–c Photo of the setup including the main optical path system and its platform, d Photo of the quartz step height standard (VLSI SHS-880QC)) |
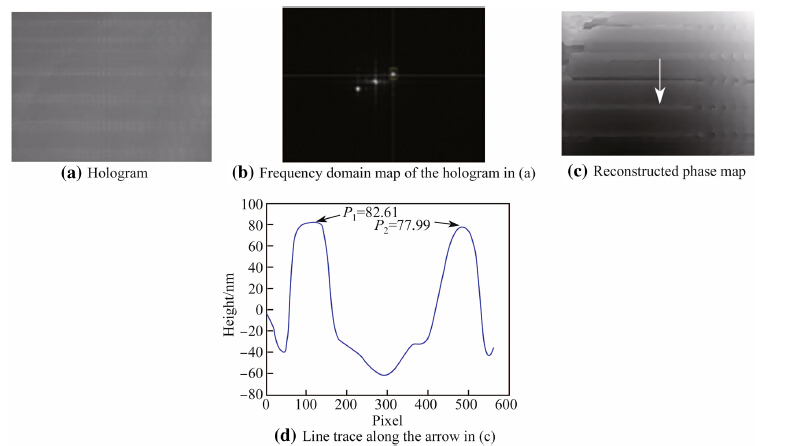
Firstly, the quartz step height standard (VLSI SHS-880QC) with 88 nm height is used to calibrate the height reconstructed error of the measurement system, as shown in Fig. 1d. Figure 2 presents the experimental results of the quartz step height. Figure 2a is the hologram, b is the fre-quency spectrum, and c is the reconstructed phase. Five horizontal line traces are taken from the phase map along the arrow. Then they are transferred to the height distribution on the basis of Eq. (6), and one of them is shown in Fig. 2d. As we can see, two peaks are 82.61 nm and 77.99 nm. Thus the average height is 80.3 nm, noted with P1 in Table 1. We also calculated the average height of the remaining line traces, noted with P2, P3, P4, P5, respectively. So the finally average height can be calculated with P1, P2, P3, P4 and P5 as 90.04 nm, and the height error is about 2.3%.
|
| Fig. 2 Measurement of VLSI SHS-880QC |
Subsequently, a scribed-line model shown in Fig. 3a is tested. The scribed-line model made of GCr15 is a metal part with the periodic contour on the surface. The labeled surface roughnessRa is 0.091μm. The second sample with the grinding surface is one of the surface roughness com-parison specimens being denoted by the elliptical line in Fig. 3b. The grinding surface shows the machining direc-tion, not clear trace lines. That is the reason that the machining trace is invisible in Fig. 3b. The labeled surface roughness parameterRa is 0.025 μm.

|
| Fig. 3 Photos of two measured samples |
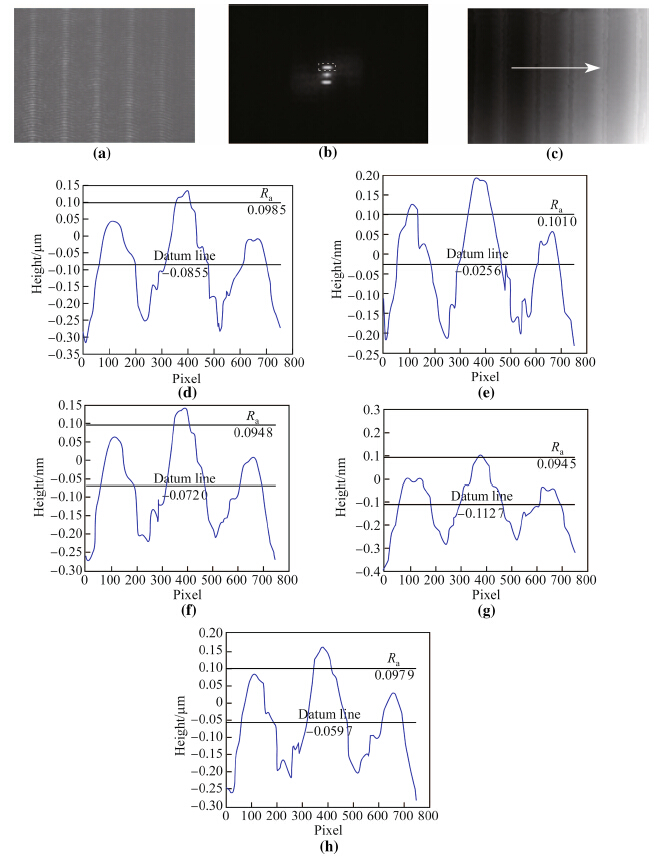
The results are shown in Fig. 4. Figure 4a is the holo-gram, b and c is the frequency spectrum and the recon-structed phase, respectively. Then, according to the sampling lengths, five line traces profiles along the arrow in phase map shown in Fig. 4c are taken and shown in Figs. 4d-h. All of them should be at different positions. Subsequently, for every line trace, two horizontal lines must be calculated. One is datum line which means the arithmetic mean of the taken line trace. The other one isRa line. Thus, five surface roughnessRa should be calculated, as shown in Table 2. Their average value isRa = 0.096 8 im and the error compared with the givenRa is 6.3%.
|
| Fig. 4 Measurement results of standard scribed-line model (a The hologram, b The frequency domain map, c The reconstructed phase, d–- h Five line traces according to five sampling length) |

|
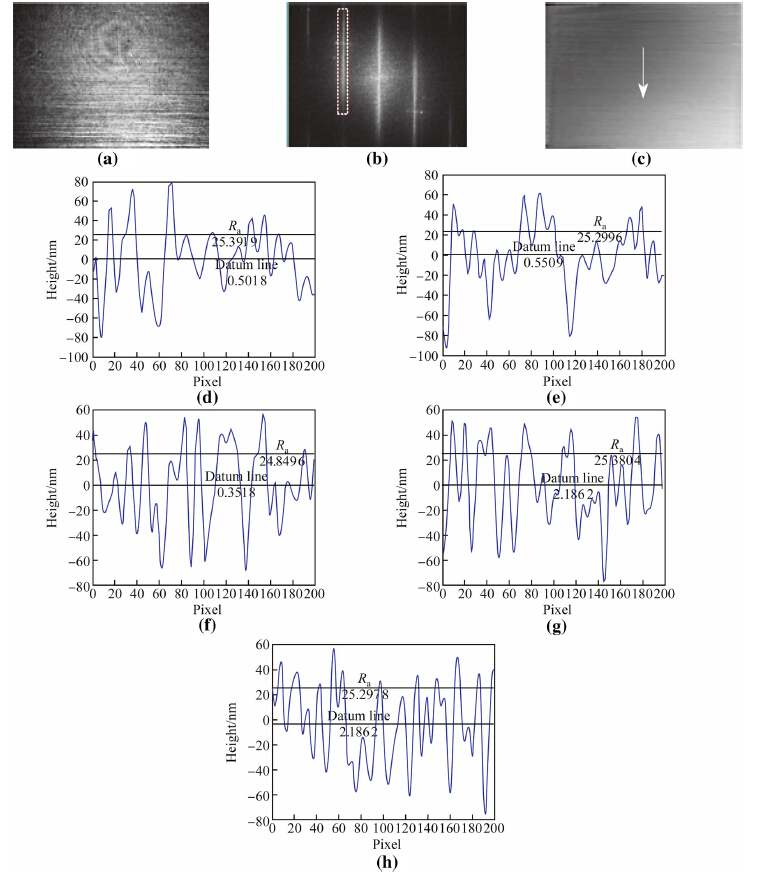
For the other sample, the measured results on the surface roughness are shown in Fig. 5. The captured hologram, the frequency domain map and the reconstructed phase map are shown in Figs. 5a-c, respectively. Because the sample surface here shows random contour profile, five line traces according to the sampling lengths are just taken along the arrow in phase map in Fig. 5c, which should be vertical with the grinding direction. Their profiles are shown in Figs. 5d-h, respectively. Their average value and rough-nessRa are calculated. We can find them in Table 3 with the average value -0.025 24μm. Thus the error is about 0.9%.
|
| Fig. 5 Measurement results of the grinding specimen (a The captured hologram, b The frequency spectrum, c The reconstructed phase, d–h The profile maps according to five sampling lengths along the arrow in c) |
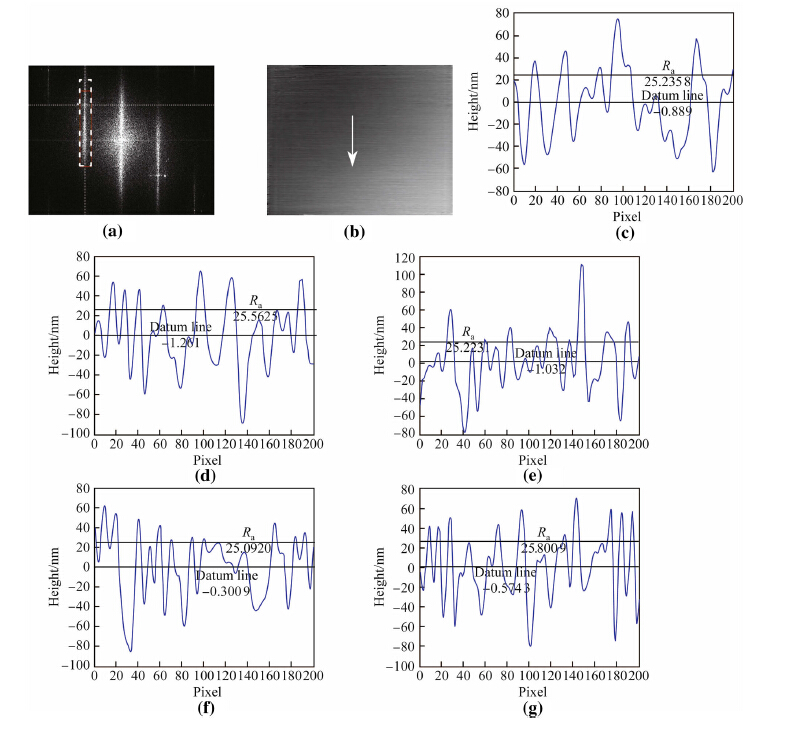
Actually, when the object wave can be reconstructed rightly described in Eq.(2), we have to use a window filter as the dotted line rectangle shown in Figs. 4b and 5b to get the useful frequency spectrum. The useful frequency spectrum distribution is always different because of the diffraction difference of the different samples. Thus, it is difficult to decide the window size of the filter. For example, in Fig. 4b, the whole useful frequency spectrum area can be gotten by a window filter. But in Fig. 5b just the main part of the frequency spectrum is contained because of the long shape. Thus we also analyze the effects of the different window size of the filter on the recon-struction results. For example, we choose another filter with 61 x 588 pixels as shown in Fig. 6a. It means that the central frequency is focused to reconstruct and the one on the edge will be missed. Figure 6b is the reconstructed phase. According to the same processing steps above, the profiles of five sampling length of Fig. 6b are shown in Figs. 6c-g.
|
| Fig. 6 Reconstructed results by using a different window size of filter for the grinding sample (a Spectrogram, b Phase map, c–g Profiles of sampling lengths) |
Even though the profile difference between Figs. 5d-h and 6e-g is not clear enough, the calculatedRa values indicate the difference clearly.Ra values of the profiles shown in Figs. 6e-g are 0.025 24 im, 0.025 56 (im, 0.025 22 im, 0.025 09 im, and 0.025 80 im, respectively. Their average value is 0.025 38μm. Compare it with the averageRa 0.025 24 im in Fig. 5, we can find that a narrow filter window should be more suitable to perform that.
6 ConclusionsA system for surface roughness measurement based on digital holography has been demonstrated in the paper. Generally, digital holography can characterize surface information effectively, and ensure high accuracy rough-ness measurement. But we also confirm that digital holography should be more suitable the samples with periodic contour surface for roughness measurement, but with the bigger measurement error. Actually, the mea-surement error is also connected with the pixel size. The smaller the pixel size is, the more precise the measurement results are. For the surface with random contour, the measurement error will be smaller, but the window size of filter during the hologram being processed should be dif-ficult to be decided. Thus, in next work, we will develop the wavelet filter to finish the frequency filtering of the off-axis hologram. Because the wavelet filter must not select the window size, which sounds a better choice for the roughness measurement with the random contour surface.
Acknowledgments The Young Scientists Fund of the Natural Science Foundation of China(Grant No. 61107004)| 1. | Ling LX, Pei FC, Ying W, et al(2012) Three-dimensional measuring technique for surface topography using a light-sectioning microscope. Appl Opt, 8, 1162-1170 |
| 2. | Jian CW(2008) Summary of surface toughness measurement technology. High Vocat Educ, 5, 76-78 |
| 3. | Xiao MX, Hong H(2009) Development of non-contact surface roughness measurement in last decade. IEEE Int Conf Meas Technol Mechatron Autom, 584, 210-213 |
| 4. | Chun XL, Qing RD, Hai XL(2010) Measurement of surface parameters from autocorrelation function of speckles in deep Fresnel region with microscopic imaging system. Opt Exp, 2, 1302-1312 |
| 5. | Yatafai T, Chiang FP(1982) Automatic fringe analysis for moiré topography. Opt Laser Eng, 3, 73-83 doi:10.1016/0143-8166(82)90018-5 |
| 6. | Takeda M, Mutoh K(1986) Fourier transform profilometry of 3D diffuse objects by spatial phase detection. Appl Opt, 16, 30-35 |
| 7. | Windecker R, Tiziani HJ(1995) Tonometry of technical and biological objects by fringe projection. Appl Opt, 36, 44-50 |
| 8. | Windecker P, Franz S, Tiziani HJ(1999) Optical roughness measurement with fringe projection. Appl Opt, 28, 37-42 |
| 9. | Dai YZ, Chiang FP(2000) Contouring by moiré interferometry. Exp Mech, 31, 76-81 |
| 10. | Zhang H, Wu F(2000) Spatiotemporal phase unwrapping and its application in fringe projection fiber optics phase-shifting profilometry. Opt Eng, 19, 58-64 |
| 11. | Manojlovic LM, Zivanov MB, Marincic AS(2010) White-light interferometry sensor for rough surface height distribution measurement. IEEE Sens J, 6, 1125-1132 |
| 12. | Metchkarov N(2000) High-accuracy surface measurement using laser-diode phase-stepping interferometry. Vacuum, 58, 464-469 doi:10.1016/S0042-207X(00)00206-2 |
| 13. | Michael Z (2002) High speed surface measurement with lateral scanning-white light interferometry. Veeco Instruments Inc., Town of Oyster Bay |
| 14. | Dirksen D, Droste H, Kemper B(2001) Lensless Fourier holography for digital holographic interferometry on biological samples. Opt Laser Eng, 2, 1-9 |
| 15. | Tankam P, Picart P(2012) Use of digital color holography for crack investigation in electronic components. Opt Laser Eng, 49, 1335-1342 |
| 16. | Mosarraf H, Chandra S(2009) Temperature measurement in laminar free convective flow using digital holography. Appl Opt, 10, 1869-1877 |
| 17. | Weidong Y, Alexander BK, Raymond AS(2006) Phase signature for particle detection with digital in-line holography. Opt Lett, 10, 1309-1401 |
| 18. | Taslima K, Mohammad NR, Arvind R(2011) Accurate size measurement of needle-shaped particles using digital holography. Chem Eng Sci, 12, 2699-2706 |
| 19. | Majinyang S, Constance KTT, Ruojin D(2010) Thickness and roughness measurement using a reflective digital holographic microscope. Proc SPIE, 7522, 7522671-9 |
| 20. | Lei X, Peng XY, Jian NM, et al(2001) Studies of digital microscopic holography with application to microstructure testing. Appl Opt, 28, 5046-5051 |
| 21. | Li HM, Hui W, Yong L, et al(2004) Numerical reconstruction of digital hologram for three-dimensional shape measurement. Appl Opt, 6, 396-400 |
| 22. | Schnars U, Juptner W(2002) Digital recording and numerical reconstruction of holograms. Meas Sci Technol, 13 |
| 23. | Guang JW (2011) Study on digital holography and its applications in the field of measurement. Dissertation, Beijing University of Technology |
 2016, Vol. 4


